Showing posts with label employment. Show all posts

Thursday, December 10, 2015

How Big the Gig Economy Really Is

By John Mauldin

There is growing awareness of what is being called the “gig economy.” It’s not just Uber driving or Airbnb. There are literally scores of websites and apps where you can advertise your services, get temporary or part time work, and do so from anywhere you happen to be.

Some “gigs” actually pay pretty good money, but they are for people with specialized skills who prefer to live a somewhat different lifestyle than the typical 9 to 5’er does. My hedge fund friend Murat Köprülü has been busy researching and documenting this phenomenon and regularly regales me with what he finds.

He goes and spends evenings and weekends with young gig workers, trying to figure out what it is they really do and how they make ends meet in New York City. It turns out they need a lot less to support their lifestyle than you might imagine, and they prefer working intermittent gigs, being able to do what they want, and having no boss.

A close look at the data indicates that the gig economy is indeed big and growing. But there is a great deal of debate among economists about how big it really is.

It’s Much Bigger Than the Employment Data Suggests

Gig workers don’t seem to show up clearly in the BLS employment data. Typically, we would expect those working in the gig economy to appear in the self employed category, but that category is actually drifting downward in numbers—relatively speaking.

But Harvard economist Larry Katz and Princeton’s Alan Krueger, who are working on research to document the rise of the gig economy in America, says that our current measures ignore the bulk of the gig economy.

 From a story at fusion.net:
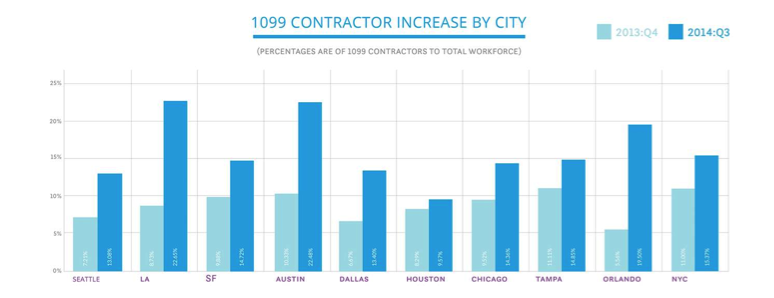
Katz said two pieces of evidence suggest current measures of self-employment and multiple-job holding are “missing a large part of the gig economy.” The first is that the share of the employed (and of the adult population) filing a 1099 form, the tax document “gig economy” workers must file, increased in the 2000s, even as standard measures of self-employment declined in the 2000s. Other groups have confirmed this: Zen Payroll, a site that tracks the sharing economy, found increases in the share of 1099 workers across many major U.S. metros.

Mauldin-Economics-Gig-Economy
Source: Zen Payroll via Small Business Labs

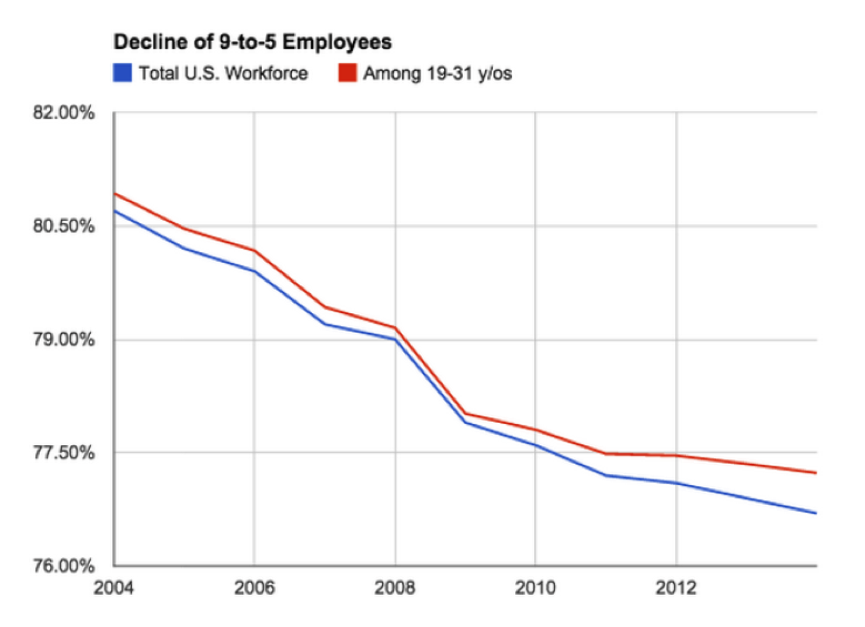
And data from research group EconomicModeling.com show the share of traditional, 9-to-5 workers in the labor force has declined…..

Mauldin-Economics-Gig-Economy
Source: Fusion, data via EconomicModeling.com

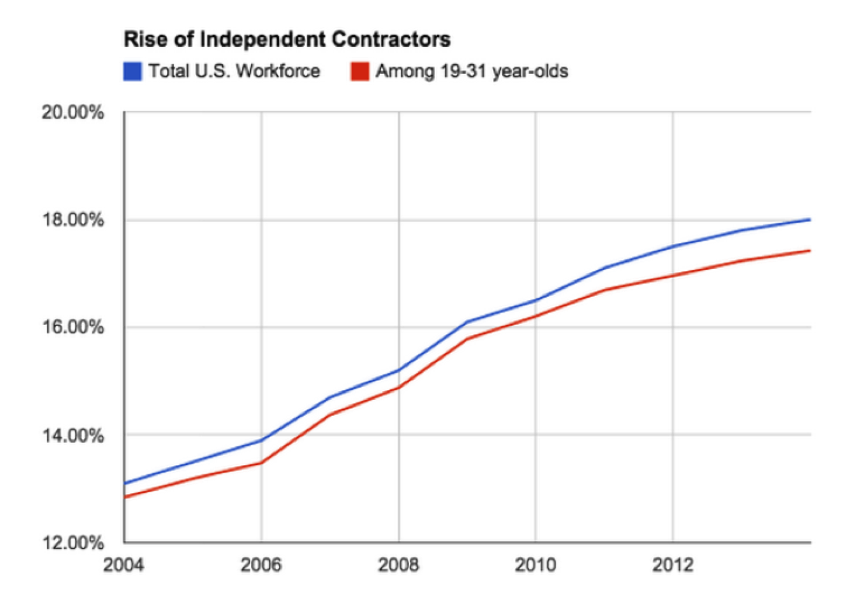
… while those who categorize themselves as “miscellaneous proprietors” is climbing.

Mauldin-Economics-Gig-Economy
Source: Fusion, data via EconomicModeling.com

A recent survey found 60 percent of such workers get at least 25 percent of their income from gig economy work.

The problem with the BLS estimates is that they overlook a sizable chunk of the true gig economy.
And this report absolutely squares with what my friend Murat’s research is showing: that gig economy is not shrinking. On the contrary, it’s on the rise, and a quite rapid rise.

Subscribe to Thoughts from the Frontline

Follow Mauldin as he uncovers the truth behind, and beyond, the financial headlines in his free publication, Thoughts from the Frontline. The publication explores developments overlooked by mainstream news to help you understand what’s happening in the economy and navigate the markets with confidence.

The article was excerpted from John F. Mauldin’s Thoughts from the Frontline. Follow John Mauldin on Twitter. The article How Big the Gig Economy Really Is was originally published at mauldineconomics.com.


Get our latest FREE eBook "Understanding Options"....Just Click Here!

Thursday, December 18, 2014

Crude Oil, Employment, and Growth

By John Mauldin


Last week we started a series of letters on the topics I think we need to research in depth as we try to peer into the future and think about how 2015 will unfold. In forecasting U.S. growth, I wrote that we really need to understand the relationships between the boom in energy production on the one hand and employment and overall growth in the US on the other. The old saw that falling oil prices are like a tax cut and are thus a net benefit to the US economy and consumers is not altogether clear to me. I certainly hope the net effect will be positive, but hope is not a realistic basis for a forecast. Let’s go back to two paragraphs I wrote last week:

Texas has been home to 40% of all new jobs created since June 2009. In 2013, the city of Houston had more housing starts than all of California. Much, though not all, of that growth is due directly to oil. Estimates are that 35–40% of total capital expenditure growth is related to energy. But it’s no secret that not only will energy related capital expenditures not grow next year, they are likely to drop significantly. The news is full of stories about companies slashing their production budgets. This means lower employment, with all of the knock on effects.

Lacy Hunt and I were talking yesterday about Texas and the oil industry. We have both lived through five periods of boom and bust, although I can only really remember three. This is a movie we’ve seen before, and we know how it ends. Texas Gov. Rick Perry has remarkable timing, slipping out the door to let new governor Greg Abbott to take over just in time to oversee rising unemployment in Texas. The good news for the rest of the country is that in prior Texas recessions the rest of the country has not been dragged down. But energy is not just a Texas and Louisiana story anymore. I will be looking for research as to how much energy development has contributed to growth and employment in the US.

Then the research began to trickle in, and over the last few days there has been a flood. As we will see, energy production has been the main driver of growth in the US economy for the last five years. But changing demographics suggest that we might not need the job creation machine of energy production as much in the future to ensure overall employment growth.

When I sat down to begin writing this letter on Friday morning, I really intended to write about how falling commodity prices (nearly across the board) and the rise of the dollar are going to affect emerging markets.

The risks of significant policy errors and an escalating currency war are very real and could be quite damaging to global growth. But we will get into that next week. Today we’re going to focus on some fascinating data on the interplay between energy and employment and the implications for growth of the US economy. (Note: this letter will print a little longer due to numerous charts, but the word count is actually shorter than usual.)

But first, a quick recommendation. I regularly interact with all the editors of our Mauldin Economics publications, but the subscription service I am most personally involved with is Over My Shoulder.
It is actually very popular (judging from the really high renewal rates), and I probably should mention it more often. Basically, I generally post somewhere between five and ten articles, reports, research pieces, essays, etc., each week to Over My Shoulder. They are sent directly to subscribers in PDF form, along with my comments on the pieces; and of course they’re posted to a subscribers-only section of our website. These articles are gleaned from the hundreds of items I read each week – they’re the ones I feel are most important for those of us who are trying to understand the economy. Often they are from private or subscription sources that I have permission to share occasionally with my readers.

This is not the typical linkfest where some blogger throws up 10 or 20 links every day from Bloomberg, the Wall Street Journal, newspapers, and a few research houses without really curating the material, hoping you will click to the webpage and make them a few pennies for their ads. I post only what I think is worth your time. Sometimes I go several days without any posts, and then there will be four or five in a few days. I don’t feel the need to post something every day if I’m not reading anything worth your time.

Over My Shoulder is like having me as your personal information assistant, finding you the articles that you should be reading – but I’m an assistant with access to hundreds of thousands of dollars of research and 30 years of training in sorting it all out. It’s like having an expert filter for the overwhelming flow of information that’s out there, helping you focus on what is most important.

Frankly, I think the quality of my research has improved over the last couple years precisely because I now have Worth Wray performing the same service for me as I do for Over My Shoulder subscribers. Having Worth on your team is many multiples more expensive than an Over My Shoulder subscription, but it is one of the best investments I’ve ever made. And our combined efforts and insights make Over My Shoulder a great bargain for you.

For the next three weeks, I’m going to change our Over My Shoulder process a bit. Both Worth and I are going to post the most relevant pieces we read as we put together our 2015 forecasts. This time of year there is an onslaught of forecasts and research, and we go through a ton of it. You will literally get to look “over my shoulder” at the research Worth and I will be thinking through as we develop our forecasts, and you will have a better basis for your own analysis of your portfolios and businesses for 2015.

And the best part of it is that Over My Shoulder is relatively cheap. My partners are wanting me to raise the price, and we may do that at some time, but for right now it will stay at $39 a quarter or $149 a year. If you are already a subscriber or if you subscribe in the next few days, I will hold that price for you for at least another three years. I just noticed on the order form (I should check these things more often) that my partners have included a 90 day, 100% money-back guarantee. I don’t remember making that offer when I launched the service, so this is my own version of Internet Monday.  

You can learn more and sign up for Over My Shoulder right here.

And now to our regularly scheduled program.

The Impact of Oil On U.S. Growth
I had the pleasure recently of having lunch with longtime Maine fishing buddy Harvey Rosenblum, the long-serving but recently retired chief economist of the Dallas Federal Reserve. Like me, he has lived through multiple oil cycles here in Texas. He really understands the impact of oil on the Texas and U.S. economies. He pointed me to two important sources of data.

The first is a research report published earlier this year by the Manhattan Institute, entitled “The Power and Growth Initiative Report.” Let me highlight a few of the key findings:

1. In recent years, America’s oil & gas boom has added $300–$400 billion annually to the economy – without this contribution, GDP growth would have been negative and the nation would have continued to be in recession.

2. America’s hydrocarbon revolution and its associated job creation are almost entirely the result of drilling & production by more than 20,000 small and midsize businesses, not a handful of “Big Oil” companies. In fact, the typical firm in the oil & gas industry employs fewer than 15 people. [We typically don’t think of the oil business as the place where small businesses are created, but for those of us who have been around the oil patch, we all know that it is. That tendency is becoming even more pronounced as the drilling process becomes more complicated and the need for specialists keeps rising. – John]

3. The shale oil & gas revolution has been the nation’s biggest single creator of solid, middle-class jobs – throughout the economy, from construction to services to information technology.

4. Overall, nearly 1 million Americans work directly in the oil & gas industry, and a total of 10 million jobs are associated with that industry.

Oil & gas jobs are widely geographically dispersed and have already had a significant impact in more than a dozen states: 16 states have more than 150,000 jobs directly in the oil & gas sector and hundreds of thousands more jobs due to growth in that sector.

Author Mark Mills highlighted the importance of oil in employment growth:


The important takeaway is that, without new energy production, post recession U.S. growth would have looked more like Europe’s – tepid, to say the least. Job growth would have barely budged over the last five years.

Further, it is not just a Texas and North Dakota play. The benefits have been widespread throughout the country. “For every person working directly in the oil and gas ecosystem, three are employed in related businesses,” says the report. (I should note that the Manhattan Institute is a conservative think tank, so the report is pro-energy-production; but for our purposes, the important thing is the impact of energy production on recent US economic growth.)

The next chart Harvey directed me to was one that’s on the Dallas Federal Reserve website, and it’s fascinating. It shows total payroll employment in each of the 12 Federal Reserve districts. No surprise, Texas (the Dallas Fed district) shows the largest growth (there are around 1.8 million oil related jobs in Texas, according to the Manhattan Institute). Next largest is the Minneapolis Fed district, which includes North Dakota and the Bakken oil play. Note in the chart below that four districts have not gotten back to where they were in 2007, and another four have seen very little growth even after eight years. “It is no wonder,” said Harvey, “that so many people feel like we’re still in a recession; for where they live, it still is.”


To get the total picture, let’s go to the St. Louis Federal Reserve FRED database and look at the same employment numbers – but for the whole country. Notice that we’re up fewer than two million jobs since the beginning of the Great Recession. That’s a growth of fewer than two million jobs in eight years when the population was growing at multiples of that amount.


To put an exclamation point on that, Zero Hedge offers this thought:

Houston, we have a problem. With a third of S&P 500 capital expenditure due from the imploding energy sector (and with over 20% of the high yield market dominated by these names), paying attention to any inflection point in the U.S. oil producers is critical as they have been gung-ho “unequivocally good” expanders even as oil prices began to fall. So, when Reuters reports a drop of almost 40 percent in new well permits issued across the United States in November, even the Fed's Stan Fischer might start to question [whether] his [belief that] lower oil prices are "a phenomenon that’s making everybody better off" may warrant a rethink.

Consider: lower oil prices unequivocally “make everyone better off.” Right? Wrong. First: new oil well permits collapse 40% in November; why is this an issue? Because since December 2007, or roughly the start of the global depression, shale oil states have added 1.36 million jobs while non shale states have lost 424,000 jobs.


The writer of this Zero Hedge piece, whoever it is (please understand there is no such person as Tyler Durden; the name is simply a pseudonym for several anonymous writers), concludes with a poignant question:

So, is [Fed Vice-Chairman] Stan Fischer's “not very worried” remark about to become the new Ben “subprime contained” Bernanke of the last crisis?

Did the Fed Cause the Shale Bubble?

Next let’s turn to David Stockman (who I think writes even more than I do). He took aim at the Federal Reserve, which he accuses of creating the recent “shale bubble” just as it did the housing bubble, by keeping interest rates too low and forcing investors to reach for yield. There may be a little truth to that. The reality is that the recent energy boom was financed by $500 billion of credit extended to mostly “subprime” oil companies, who issued what are politely termed high yield bonds – to the point that 20% of the high yield market is now energy production related.

Sidebar: this is not quite the same problem as subprime loans were, for two reasons: first, the subprime loans were many times larger in total, and many of them were fraudulently misrepresented. Second, many of those loans were what one could characterize as “covenant light,” which means the borrowers can extend the loan, pay back in kind, or change the terms if they run into financial difficulty. So this energy related high yield problem is going to take a lot more time than the subprime crisis did to actually manifest, and there will not be immediate foreclosures. But it already clear that the problem is going to continue to negatively (and perhaps severely) impact the high-yield bond market. Once the problems in energy loans to many small companies become evident, prospective borrowers might start looking at the terms that the rest of the junk-bond market gets, which are just as egregious, so they might not like what they see. We clearly did not learn any lessons in 2005 to 2007 and have repeated the same mistakes in the junk bond market today. If you lose your money this time, you probably deserve to lose it.

The high yield shake out, by the way, is going to make it far more difficult to raise money for energy production in the future, when the price of oil will inevitably rise again. The Saudis know exactly what they’re doing. But the current contretemps in the energy world is going to have implications for the rest of the leveraged markets. “Our biggest worry is the end of the liquidity cycle. The Fed is done. The reach for yield that we have seen since 2009 is going into reverse,” says Bank of America (source: The Telegraph).

Contained within Stockman’s analysis is some very interesting work on the nature of employment in the post recession U.S. economy. First, in the nonfarm business sector, the total hours of all persons working is still below that of 2007, even though we nominally have almost two million more jobs. Then David gives us two charts that illustrate the nature of the jobs we are creating (a topic I’ve discussed more than once in this letter). It’s nice to have somebody do the actual work for you.

The first chart shows what he calls “breadwinner jobs,” which are those in manufacturing, information technology, and other white collar work that have an average pay rate of about $45,000 a year. Note that this chart encompasses two economic cycles covering both the Greenspan and Bernanke eras.


So where did the increase in jobs come from? From what Stockman calls the “part time economy.” If I read this chart right and compare it to our earlier chart from the Federal Reserve, it basically demonstrates (and this conclusion is also borne out by the research I’ve presented in the past) that the increase in the number of jobs is almost entirely due to the creation of part time and low wage positions – bartenders, waiters, bellhops, maids, cobblers, retail clerks, fast food workers, and temp help. Although there are some professional bartenders and waiters who do in fact make good money, they are the exception rather than the rule.


It’s no wonder we are working fewer hours even as we have more jobs.

To continue reading this article from Thoughts from the Frontline – a free weekly publication by John Mauldin, renowned financial expert, best selling author, and Chairman of Mauldin Economics – please click here.


Get our latest FREE eBook "Understanding Options"....Just Click Here!


Friday, August 2, 2013

Amazon.com Creates 5,000 Jobs, Destroys 25,000 in the Process?

Amazon.com Creates 5,000 Jobs, Destroys 25,000 in the Process?

By Alex Daley, Chief Technology Investment Strategist

The Technology Jobs Conundrum

The past few weeks have seen the tech and business media abuzz about a not-so-little warehouse in Tennessee. That's because this distribution center, opening its doors with a burst of fanfare and even a few visits from nearby politicians, isn't a jumping-off point for Macy's or Target. Instead, the warehouse is the latest in a series of new locations being opened by retail technology giant Amazon.com.
The jobs this new mega warehouse is purported to create: 5,000.

The politicians who made the quick trip to Tennessee to get in front of the cameras included one President Barack Obama, who gave a rousing speech not just about the importance of the 5,000 jobs promised at this one facility (and another 2,000 corollary positions at customer service centers elsewhere in the country), but also about the "need" to raise taxes on the businesses that are creating them and use those taxes to fund "infrastructure" jobs in green energy and natural gas, among other areas.

The politically charged speech and the press conference from Amazon.com touting its job-creation abilities have understandably drawn quite the skeptical reaction from some. But surprisingly, in all the talk I've heard in the media these past few days, most of the fury seems directed not at the proposed tax hikes, but at Amazon itself for creating what might be fewer jobs than it claims… and possibly for destroying more jobs than it creates.
Along with its jobs announcement, Amazon's PR department was ready for the utterly predictable media criticism that the jobs are nothing more than menial, low-wage shop floor jobs. Its retort? These new jobs will pay on average 30% higher than typical retail jobs. That's a good thing for the employed, no doubt, to be paid more for a similar skill-level job.

But with its emphasis on low prices, how can Amazon afford to boost those wages so much? It all boils down to efficiency. Think about Amazon versus another retailing giant without the same level of sales, but with a similar "low prices" kind of push: TJX companies (owners of TJ Maxx, Marshalls, and Home Goods). Last year, Amazon had retail sales of over $60 billion globally (up from $47 billion in 2011); TJX brought in about half that, at almost $26 billion globally (up from $23 billion in 2011).

Whatever the companies' similarities, the differences between the two couldn't be bigger; and those differences have profound impacts for investors, as well as for the future of our economy.
On one hand, you have companies like TJX—so-called "bricks and mortar" retailers—which in order to do business every day must staff a few thousand stores, and keep them open for 10, 12, or even 24 hours per day. That means greeters, checkers, security, customer service, and stockroom employees, plus bright lighting, catchy displays, and other ordinary features of a quality retail facility.

Companies like Amazon have bricks and mortar too, of course, as displayed on the recent junket in Tennessee.  But that's about all they have. Amazon can operate in facilities far off the beaten path, with nothing but wire shelves and cement floors, and they can serve just as many customers from only a fraction of the locations—and a fraction of the manpower—that their competitors require. On just about every front, the company is more efficient than its peers. But let's look specifically at two of the top expenses for virtually any retail company: its plant and its people.

Facilities

Last year, TJX ended with 3,055 stores, making it one of the most prolific clothing and home goods retailers in the US. It pegs its sales at a respectable $8.5 million annually per store. That's not a big-box retailer like Best Buy, which racked up $25 million per store in 2011, but it's solid compared to many other clothing and home goods retailers (like Sears, with much larger stores and only $9.5 million in per location sales, or the Gap, with smaller, mall-style stores and only $5 million per outlet).

Amazon doesn't have stores, of course. It has "fulfillment centers," just like the new one in Tennessee that the POTUS visited. As of May 2013, a few dozen such centers are scattered across the world, including 37 in the US and 2 in Canada, and another dozen plus in Europe:


Of course, it's unfair to count only fulfillment centers, as the company handles customer service at separate locations, something a retailer like TJX would normally handle mostly onsite in the stores (excepting the separate online sales division, but that constitutes only a small fraction of TJX's business). Add in those locations, plus the newest centers Amazon plans to open, and you still have fewer than 100 retail operations centers globally.

If we round up just to be fair, that pegs Amazon's sales per location for the past year at $660 million, or about 80 times the sales per location of a TJX.

In addition to the amount of dollars per square foot in revenue that Amazon can push out its doors, the company can strike deals to grab land in otherwise desolate areas for its facilities, so long as UPS and FedEx will service them—no need for high-rent districts with lots of shopper traffic. This means that not only does the company have to support fewer square feet of space and make each square foot less glamorous, it can also push into districts willing to offer it big tax savings, or where construction costs are highly depressed (often one and the same). Amazon's negotiation power and economies of scale are both significantly higher than the average multi-thousand storefront retailer.

Employment

Of course, having more sales per location means less if you have to fill that location with just as many people to get the goods out the door. Sure, you save on the overhead from electricity to property taxes, but you can only gain so much efficiency in a labor intensive business. But here too, Amazon's differences are broadly apparent.

TJX Companies Inc. has approximately 179,000 employees: as with any retailer, it's a mix of full-time, part time, and seasonal workers.

Amazon's demand is just as cyclical as any other retailer. When queried at the press conference in Tennessee, a company rep wouldn't specify how many of the 5,000 promised new jobs are part-time and seasonal. He instead jumped back to the pre-approved talking point about pay being 30% higher on average. The spokesman did acknowledge that a good number of them would not be full-time, year-round positions.

(Amazon is able to staff much more efficiently than most retailers during non-holiday seasons, thanks to real-time, around-the-clock operations management and the ability to pull staff in for extra shifts and on short notice—a more difficult task for traditional storefront retailers, because having 10 extra people show up tomorrow from midnight to 6 a.m. doesn't help move any more product. So it's reasonable to assume Amazon will have more seasonal help as a percentage than most other retailers.)

In all, though, Amazon has managed to grow to its current level with just about 89,000 employees, or almost exactly half of TJX’s workforce. To do that yet pull down 150% more revenue makes Amazon about five times more efficient than TJX, measured by retail sales per staffer.

Amazon is able to do so because the number of shoppers who can be served per warehouse employee is much higher than at a typical retail location—especially the smaller stores that TJX mostly uses. The same goes for all the servers the company operates: one IT guy can take the midnight shift and keep a few thousand servers up and running, but one janitor cannot clean the floors at two locations, let alone 400—and many other aspects of the business share this limitation.

Stacking Up Against Retail's Big Boys

TJX wasn't cherry-picked as a counterexample—there are many retailers with far worse operating margins than TJX to pick on if that was the goal. Amazon stands out head and shoulders above nearly all other retailers in efficiency. Even when stacked up against larger competitors which can bring more scale to the business than TJX can, such as retail megastore Walmart, whose $470 billion in sales don't put a dent in the revenue-per-employee figure:

Wal-Mart
(NYSE:WMT)
CVS Caremark
(NYSE:CVS)
Target
(NYSE:TGT)
Amazon.com
(Nasdaq
GS:AMZN)
TJX Companies
(NYSE:TJX)
# of Employees
2,200,000
241,500
361,000
88,400
179,000
Revenue TTM (000s)
$470,339,000
$123,098,000
$73,140,000
$66,848,000
$26,269,900
Rev per Employee
$213,790.45
$509,722.57
$202,603.88
$756,199.10
$146,759.22

As is obvious above, Amazon's revenue per employee is leaps and bounds above its competition. The only other one on our short list that comes close is CVS, but despite the public perception of the company as a retailer, it now generates the overwhelming majority of its revenues from its insurance programs, so it's partially miscategorized. Even so, it still doesn't come close to Amazon in terms of revenue efficiency; CVS would need to grow its sales by greater than 50% without adding a single staffer in order to catch up.

Walmart? It would have to lay off over two-thirds of its employees or triple its same-store sales to even come close.

Amazon's revenue efficiency is remarkable by virtually any standard. And it's one of the reasons that despite a long track record of underperforming on earnings, the company has generally stayed in the market's good graces and been granted a hefty valuation relative to its peers. The market sees Amazon for what it is—a technology company with leverage that can grow revenues in a big way—and not a more traditional retailer.
But this also means that for every jar of Crazy Aaron's Thinking Putty that is shipped out the door, the number of people on the payroll is only one-fourth that of Walmart or Target… or one-fifth that of TJX.

What Does This Mean for the President's Jobs Plan?

Does this mean that Barack Obama is right? Does the government need to step in, tax these efficient companies harder, and spend that money on solar farms, wind turbines, and transport infrastructure? After all, you cannot efficiently deliver tens of millions of packages when roads are choked and bridges are crumbling.

At first glance, it would be easy to jump to that conclusion. That's the direction I heard quite a few of Tuesday and Wednesday's commentators heading with their questions, even on business-oriented stations like my morning commute companion, Bloomberg Radio.

And yes, in some senses, for every job Amazon "creates," four other jobs go away at a company like TJX.
But it's not that simple. First, with any efficiency comes inefficiency on another point. The relative competitiveness of two business models is driven by the economic weight of those items in contrast to each other—an equation that changes over time. For instance, Clayton Christensen eloquently pointed out years ago in his book The Innovator's Dilemma (available here at Amazon.com) that at one point the commonplace hydraulic backhoes and diggers that litter every construction site in the modern world were once considered vastly inferior to their cable-actuated big brothers. Per foot, they couldn't—and still can't—dig nearly as wide a moat per pass. But it didn't matter. They won the overall market on convenient smaller sizes, easier maintenance, and better safety. Their inefficiencies were simply smaller than the value of their improvements.

Much the same, while you can argue about Amazon's relative efficiency to TJX, you must be careful not to discount its INefficiency. For instance, at a store like TJMaxx, one truckload of goods can restock the place for weeks. To deliver the orders of a few dozen Amazon customers might require dozens of individual packages, shipped to half a dozen different sort facilities, and put on a few dozen different trucks.

TJX benefits from all the dinosaur dung burned by its customers coming to the store and driving goods back home for it. Amazon, on the other hand, takes those nearly countless millions of extra miles and absorbs them into its business model. Compared in this way, Amazon is incredibly inefficient.

What Amazon doesn't spend hiring direct employees, the company outsources to others, and the sum of those expenses is enormous.

In fact, the company is so good at spending that gross margin per staffer, that it usually manages to spend it all. Just look at this graph of Amazon's gross revenue and its profits for the past five years…


You might have to squint to find the red bars that represent profits. The difference between those two sets of colored bars is the amount Amazon spends on not just its 89,000 employees, but all of its operations and marketing. All of those dollars flow into the economy, be it through FedEx drivers and pilots, outsourced programmers, content licensing agreements, purchases of inventory to keep its unimaginable selection of goods growing, or any of hundreds of other paths. And each path is itself a series of jobs generated and a series of taxes that eventually do flow to the government to fund all of its activities—from building fences to keep out Mexicans to staffing the IRS to collect all that money.

Even if the company was profitable, the same would be true. Those people who made more money would be inclined to invest and spend it. The higher the relative profitability, the more free cash flow, and the more likely it is to turn into additional spending.

Any company whose technology improves efficiency in these ways is going to reduce employment in the affected industry. That's the breaks. But it does not necessarily mean those jobs are gone forever.
A time will come when the amount of efficiency gained by automation, aggregation, logistics, and other techniques puts another significant and serious dent in the demand for labor—we've already seen it with low-skill manufacturing jobs, and we are seeing it take hold now in retail sales. But that does not have to mean the end of the economy or an economy of no jobs. Instead, the efficiency flows outward to create new opportunities surrounding the new business and its investors.

Revenue efficiency creates demand for business services. What is not done in house gets pushed to other networks of suppliers—services contracted by the sellers or by the buyers. Also, profit efficiency creates income for investors, which gets reinvested into more new businesses. Just look to the Silicon Valley venture-capital scene, and you'll see years of investment gains flowing back into the markets to the tune of multiple billions of dollars per year in investments into companies bent on reinventing every area of the economy, from entertainment to building supplies to biotechnology to car rental, through technology.

The biggest risk to our economy and employment is not innovation, which speeds up the flow of capital. Rather, the risks to be on the lookout for are the ones that compromise the ability of businesses to innovate, or which otherwise impede the flow of capital—i.e., those that restrict lending, cause people or companies to hoard cash, or generate fear and distrust among trading partners.

Fears over banking failures in 2008 showed just how serious this risk can be. And while the short-term reaction of shoring up liquidity in financial markets may look to have been a smart one in retrospect, the long-term lack of consequences for outright criminal activity in that sector are damning for the future of the economy. Trust in our government, bankers, and currency continues to be at all-time lows, a factor that can only be slowing the return of economic growth.

If Barack Obama and camp want to generate more government revenues, they should consider backing off on the new taxes and focus instead on limiting the regulations that impede the flow of capital. They should help secure confidence in the economy, not just through buoying up the stock markets, but through justice and prudent oversight over the value of our money and security of our savings.

Companies like Amazon thankfully continue to invest and grow despite the rising tide of operational regulations (for all the deregulation in banking over the past 20 years, the same cannot be said of any other sector) and the continued political immunity of the banking class. As it does so, its innovations are making life better for the majority of people. While the industry-wide shift of employment will be painful to some, over time the economy will adjust, as it always has, and other employment opportunities will fill the gaps created.
Plus, it's not like Amazon has a lock on retail efficiency. After all, Costco—the star quarterback of the big-box store movement—generates over $975,000 in sales per employee. Yes, it seems like even Amazon could still learn a few things.

As for the question of whether more efficient companies—which employ software and even robots (as Amazon does in its warehouses increasingly every year) to save on labor—destroy more jobs than they create… it's not as simple as it might seem at first. Innovation ultimately benefits society, so we must be careful not to hamper it for fear of the unknown future it will bring.

While technology jobs pose a conundrum for politicians, companies like Amazon will continue to grow their market share and make handsome profits for investors. If you aren't making your share of them, consider a risk-free trial subscription to BIG TECH today, and see the actionable and profitable investment advice our technology team provides for yourself. Learn more and get started today.


Ready to start trading crude oil? Start right here....Advanced Crude Oil Study – 15 Minute Range

Friday, March 30, 2012

Option Trading: A Basic Explanation of Debit Spreads

Welcome back to the world of options. My reality exists in three dimensions and far more combinations of potential positions than does the one-dimensional world of the stock trader.
The view from my turret is ruled by the three primal forces of options — time to expiration, price of the underlying, and implied volatility. Consider for a moment the fact that each of these factors can independently impact a given option.
Multiply this by several available expiration dates and strike prices; add in the fact that individual option positions can include a variety of short and long positions at different strikes and expirations, and the potential combinations that make up an option position in a single underlying can approach a very large number.
For those traders first beginning to navigate this unfamiliar world, I think it is important to understand trade selection is manageable. There are certain families of trades that are unified by similar characteristics.
It is important to become familiar with the various trade constructions available to the knowledgeable options trader. Grouping the potential trades into related groups dramatically reduces the number of trade setups you must consider before entering a new trade.
If you are familiar with the various trade constructions, it makes discussion of a specific family member whom we may consider for employment in a trade far easier to understand.
Description of the family characteristics will take a little time, but it forms the framework on which we can hang the individual trades we will discuss in future postings.
I want readers to begin to become familiar with these patterns because it is these families of multi-legged option trades that we will return to on a regular basis to consistently perform for us.
Let me begin discussion of the various families by pointing out the redheaded stepchild of the trade constructions available. This family member, the single-legged position of being long either a put or call, is not completely without utility.
The reason for its seldom use is that for the knowledgeable options trader, this position rarely represents the best risk / reward structure given the variety of available trade constructions.
One basic and important family is that of the vertical spread. We will return several times to this family not only because of its utility in its basic form, but also because these spreads form the basic building blocks for more advanced spreads such as butterflies and iron condors.
The basic vertical spread is constructed by both buying and selling an option of the same type, either puts or calls, within the same expiration series. This is a directional spread with one breakeven point that reaches maximum profitability at expiration or when the spread has moved deep in-the-money.
It has a defined maximum profit and defined maximum loss when established. The spread is used to trade directionally in a capital efficient manner and largely neutralizes impacts of changes in implied volatility.
There are four individual vertical spread family members — the call debit spread, the call credit spread, the put debit spread, and the put credit spread. Each has its distinct and defining construction pattern. These are not the only names by which these spreads are known. Trying to keep independent option traders confined to a single set of terminologies is like trying to herd cats — it is not going to happen.
For this reason, the additional confusing and duplicative names for these spreads include bull call spread, bear call spread, bear put spread, and bull put spread. To make matters even more confusing, traders often refer to “buying a call spread” or “selling a put spread.” This multiplicity of names for the same trade structure is mightily confusing to those getting used to my world.
I am a visual learner and find that a picture is worth well more than the often cited thousand words. When I review in my mind the various option families available to use in trade construction, I think of the characteristic family portrait of each as displayed in the profit and loss, or P&L, curve.
Attached below is the first in our series of family portraits, but remember within this framework is abundant room for individual variation.

This particular example is a call debit spread, a bullish position in Apple (AAPL).
We will see trades displayed in this format with many variations as we meet the different families. The solid red line represents the profit or loss at expiration. The dotted line represents the P&L curve today and the dashed line the curve halfway to options expiration from today.
In future articles I will discuss other trade constructions that are regularly employed by experienced option traders. Until then, be sure to manage your risk accordingly.
In 2012 subscribers of my options trading newsletter have won 12 out of 13 trades. That’s a 92% win rate,  pocketing serious gains with the trades focusing only on low risk credit spread options strategies.
If you are looking for a simple one trade per week trading style then be sure to join Option Trading Signals.com today with our 14 Day Trial