Showing posts with label Oil. Show all posts

Monday, April 5, 2021

Find Out Which ETFs Will Benefit From as a Stronger U.S. Dollar Reacts to Global Market Concerns

The recent news of Hedge Fund and other institutional crisis events has opened many eyes as investors and traders realize the post 2008-09 global market credit bubble has extended well beyond what many people may realize. 

Recent news that China offered a “deferment” for Chinese corporations and state run enterprises content with shadow banking credit/debt issues at a time when China is tightening monetary policy shows that a process, like the 2008 Lehman incident, may be setting up where institutional level credit/debt liabilities ripple through the global markets as global central banks attempt to reign in monetary policies.

This process is not likely to happen suddenly though. If this type of contraction in global monetary policy takes place, resulting in increased pressures to contain excessive credit/debt functions in the markets, then we believe the process may result in an extended 9 to 16+ months of “hit-and-miss” events leading up to a potentially bigger event. 

The Archegos Fund forced unwinding of trades hit the markets recently as a wake-up call. Prior to the Archegos event, the Greensill Capital collapse shocked the global markets because of the size and scope of this failure. Now, we see Credit Suisse issuing warnings that Q1 earnings may have taken a big hit because of exposure to the Greensill and Archegos assets – which is leading to Credit Suisse attempting to put the Gupta Trading Unit into insolvency....Read More Here.

Monday, October 21, 2019

Revisiting Black Monday 1987

Back in the day, for those of you that are old enough to remember and have experienced one of the most incredible trader psychology driven stock market decline in recent history. The difference between “Black Monday” and most of the other recent stock market declines is that October 19, 1987, was driven by a true psychological panic, what we consider true price exploration, after an incredible price rally.

It is different than the DOT COM (2001) decline and vastly different than the Credit Market Crisis (2008-09) because both of those events were related to true fundamental and technical evaluations. In both of those instances, prices have been rising for quite some time, but the underlying fundamentals of the economics of the markets collapsed and the markets collapsed with future expectations. Before we get too deep, be sure to opt-in to our free market trend signals newsletter.

Our researchers believe the setup prior to the Black Monday collapse is strangely similar to the current setup across the global markets. In 1982, Ronald Reagan was elected into his second term as the US President. Since his election in 1980, the US stock market has risen over 300% by August 1987.

Reagan, much like President Trump, was elected after a long period of U.S. economic malaise and ushered in an economic boom cycle that really began to accelerate near August 1983 – near the end of his first term. The expansion from the lows of 1982, near 102.20, to the highs of 1987, near 337.90, in the S&P 500 prompted an incredible rally in the US markets for all global investors.


This is very similar to what has happened since 2015/16 in the markets and particularly after the November 2016 elections when the S&P500 bottomed near 1807.5 and has recently set hew highs near 3026.20 – a 67.4% price rally in just over 3 years.

One can simply make the assumption that global investors poured capital in the US markets in 1983 to 1986 as the US markets entered a rally mode just like we suspect global investors have poured capital into the US markets after the 2016 US elections and have continued to seek value, safety, and returns in the US markets since. These incredible price rallies setup a very real potential for “true price exploration” when investors suddenly realize valuations may be out of control.

So, what actually happened on October 19th, 1987 that was different than the last few market collapse events and why is it so similar to what is happening today?

On October 19, 1987, a different set of circumstances took place. This was almost a perfect storm of sorts for the markets. The US markets had risen nearly 44% by August 1987 from the previous yearly close – a huge rally had taken place. Computer trading, which some people suspected may have been a reason for the price decline on October 19, was largely in its infancy.

Floor traders were running the show in New York and Chicago. The London markets closed early the Friday, October 16, because of a weather event that was taking place. The “setup” of these events may have played a roll in the liquidity issues that became evident on Black Monday and pushed the US markets down 22.61% by the end of trading.

The US markets had set up a top near 2,722 in early August 1987 after rising nearly 44% from the 1986 end of year closing price level of 1,895. The SPX rotated lower from this peak to set up a sideways price channel near 315 throughout the end of August and through most of September. On October 5, 1987, the SPX started a downward price move that attempted to test the lower support channel near 312. On October 12, one week later, the SPX broke below this support channel and closed at 298.10 (below the psychological 300 level). The very next weekend was October 17 & 18 – the weekend before Black Monday.


Sunday night, October 18, in the US, the Asian markets opened for trading and a price sell-off began taking place in Hong Kong. Because the London markets has closed early on the 16th due to the storm, by the time they opened the UK markets began tanking almost immediately. Early in the day on Monday, October 19, the FTSE100 had collapsed over 136 points.

Our researchers believe the declines in the US markets in early October 1987 set up a breakdown event that, once support was broken, prompted a collapse event where liquidity issues accelerated the price decline volatility – much like the “flash crash”. Global investors were unprepared for the scale and scope of the price decline event and panicked at the speed of the price collapse.

In fact, at the height of the 1987 crash, systemic problems (mostly solvency and brokerage house operations) continued to threaten a much larger financial market collapse. Within days of Black Monday, it became evident that margin accounts and solvency issues related to operating capital, large scale risks and continued fear that the markets may continue to collapse presented a very real problem for the US and for the world. Have we re-entered another Black Monday type of setup across the global markets?


As new economic data continues to suggest the global markets are economically contracting and stagnating, the US Federal Reserve has started buying assets again while the foreign central banks continue to push negative interest rates while attempting to spark any signs of real economic growth. The US stock market has continued to push higher – almost attempting new all-time highs again just recently. The US stock market is up nearly 68% over the past 3.5 years since Trump was elected and as of Friday, October 18, 2019, the US stock markets fell nearly 0.75% on economic fears.

In Part II of this article, we’ll explore the potential of another Black Monday type of setup that may be playing out before our very eyes right now in the US stock market.

As a technical analysis and trader since 1997, I have been through a few bull/bear market cycles. I believe I have a good pulse on the market and timing key turning points for both short term swing trading and long-term investment capital. The opportunities are massive/life changing if handled properly.

I urge you visit my ETF Wealth Building Newsletter and if you like what I offer, join me with the 1-year subscription to lock in the lowest rate possible and ride my coattails as I navigate these financial market and build wealth while others lose nearly everything they own during the next financial crisis.


Chris Vermeulen
The Technical Traders


Stock & ETF Trading Signals

Tuesday, April 9, 2019

Crude Oil Nearing Resistance - Could a New Top Form Here?

The recent recovery in Crude Oil has, partially, been based on increasing expectations of a global economic recovery taking place and the continued news that the US/China will work out a trade deal. Crude inventories. Just last week U.S. Crude Oil inventories came in at +7.2 million barrels vs. expectations of -425,000 barrels. Additionally, concerns in Syria and Libya are pushing prices a bit higher as well. Whenever there are supply concerns or uncertainty out of this region, prices tend to rise.

The facts remain very dynamic for Oil. The U.S. is continuing to produce more and more oil and is expected to become a “net exporter” of oil this year. Economic issues will, eventually, resolve themselves, yet we don’t know the final outcome of these trade deals or how the economy will react to any milestones that are required within the final settlement. And, again, these continuing issues in Libya, Syria and near this region are likely to cause some increased levels of uncertainty over the next 60+ days.

Our researchers, at The Technical Traders, believe the $65.00 level will act as resistance to this current upswing. We believe the upside price move may continue to levels near $67.50 before weakening and beginning a topping formation. We believe our expectation that precious metals will bottom near April 21~24 is key to understanding the dynamics of this move in oil. As long as FEAR does not enter the market, then Oil will likely react to impulse factors exclusively related to oil. Once Gold breaks out above $1500 per ounce, our belief is that oil will react to fear factors related to some broader economic event driving investors into precious metals.

Therefore, we are urging traders to be cautious of the upside price swing in Oil at the moment. Yes, we believe the upside will continue for at least another 10~15 days (possibly changing direction near April 21~24). Yes, we believe current global dynamics support moderately higher Oil prices. Yet, we feel these factors may change within the next 20~45 days as we believe some increased fear levels are about to hit the global markets.


At this point, we would urge Bullish Oil traders to start to become more cautious of any downside risks and begin to prepare for increased volatility. We don’t have any real clue as to how this move will setup, but we do believe our other research support increased volatility within the Crude Oil markets and the potential for a new downside price swing before any further upside move sets up.

Please take a minute to review this research post from January 31, 2019 > Learning From our SP500, Gold and Oil Research & Profit.

We’ve recently launched a new technology solution for our members that delivers our incredible research and trading solutions. You can also visit The Technical Traders Free Research to learn more about our research team and past article. 20129 is going to continue to be an incredible year for skilled traders – you won’t want to miss these big moves that are setting up.

Chris Vermeulen


Stock & ETF Trading Signals

Tuesday, April 2, 2019

Waiting for the Russell 2000 to Confirm the Next Big Move

While we have recently suggested the US stock market is poised for further upside price activity with a moderately strong upside price “bias”, our researchers continue to believe the U.S. stock markets will not break out to the upside until the Russell 2000 breaks the current price channel, Bull Flag, formation. Even though the U.S. stock markets open with a gap higher this week, skilled traders must pay attention to how the Mid-Caps and the Russell 2000 are moving throughout this move.

As we continue to advise our clients that the upside pricing cycle in the U.S. stock market is being underestimated, see this research post: we also believe that increased volatility and price rotation will continue to drive larger rotations in price before the final breakout upside move takes place. We want to continue to warn traders that we still don’t have any confirmed upside breakout with price continuing to stay within this price channel in the Russell 2000. Eventually, when and if the price does breakout to the upside, we will have a very clear indication that continued higher prices and a larger upside move is happening. Until then, we need to stay cautious about the types and levels of rotation that continue within the markets.


Recently, volatility has started to increase as can be seen in this VIX chart. If the Russell 2000 is not able to break this trend channel with this current upside price move, then we fully expect continued price rotation in the U.S. stock markets and another increase in the VIX as this rotation takes place. The NQ recently rotated downward by nearly 4% while historical volatility continues to narrow. When volatility diminishes in extended price trends, we’ve learned to expect aggressive price rotation can become more of a concern. We expect the VIX to spike above 16~18 on moderate volatility as we get closer to the cycle inflection date near June/July 2019.


Overall, our researchers believe the upside price bias in the U.S. stock market will continue for another 30+ days as our research and predictions regarding precious metals and the longer term equities price cycles continue to play out. Skilled traders need to be aware that this upside price bias may include larger price rotation and volatility as we get closer to the May/June/July 2019 cycle inflection points. Stay aware of the risks as 4~6%+ price rotations should be expected over the next 30+ days throughout this upside price bias.

Do you want to find a team of dedicated researchers and traders that can help you find and execute better trades in 2019 and beyond? Please visit The Technical Traders to learn how we can help you prepare for the big moves in the global markets and find better opportunities for greater success in the future. Our team of researchers and traders continue to scan the markets for new trades and unique opportunities.

Chris Vermeulen


Tuesday, March 26, 2019

20 Days Left to Find Buying Opportunities in Gold

Our researchers have been glued to Gold, Silver and the Precious Metals sector for many months. We believe the current setup in Gold is a once in a lifetime opportunity for skilled traders to stake positions below $1300 before a potentially incredible upside price move. We’ve been alerting our members and follower to this opportunity since well before the October/December 2018 downside price rotation in the U.S. markets.

October 5, 2018: Prepare for a Gold and Silver Rally

December 9, 2018: Waiting for Gold to Erupt

Jan 25, 2018: Why Everyone is Talking About Gold and Silver

Additionally, our researchers called the bottom in the U.S. equities markets and warned of an incredible upside price rotation setting up just before the actual price bottom occurred on December 24, 2018.

December 26, 2018: Has The Equities Sell Off Reached a Bottom Yet

Our research continues to suggest that Gold and Silver will rotate within a fairly narrow range over the next 3-5 weeks before setting up a likely price bottom near April 21st, 2019. We’ve been predicting this bottom formation for many months and have been warning our followers to prepare for this move and grab opportunities below $1300 when they set up.

This first chart, a Monthly chart showing our TT Charger price modeling system, clearly illustrates the strength of this bullish price trend and the initiation of this trend back in early 2016. One of the strengths of the TT Charger modeling system is that it establishes a number of key price data points and trend factors. The background color highlighted ranges show price range breadth and range expansion or contraction. The dual channel facets show where price is likely to find support and resistance. The DOT LEVELS show where critical support or resistance is in terms of the overall trend channels.

Right now, we are still in a bullish trend with key support near $1165. The Dual Channel system is showing the $1260 to $1285 level is currently the most likely active support levels just below current price. Thus, we could see a move to near these levels over the next 3+ weeks and I would suggest skilled traders jump on this opportunity. The Range system is showing a current $250~350 price range, thus, any upside price breakout could easily rally within this range and push prices at least $250+ higher than current levels – likely well above $1550. If range expansion sets up, we could see prices well above $1750.


We’ve authored hundreds of research posts over the past 12+ months and the one thing that we continue to mention is that Fibonacci price theory continues to operate on the premise that “price must always attempt to find and establish new price highs or lows – at all times”. Please keep this in mind as we continue.

Take a look at the TT Charger chart, above, and the raw Monthly price chart, below. Price must always attempt to find and establish new price highs or lows – so where is price going based on the most recent price rotations? Let’s review…

After rallying in early 2016 to establish a price high of $1377.50, gold immediately rotated downward to establish a higher low near $1124.50. The $1377.50 high price was a “new price high” in terms of previous rotational highs while the $1124.50 low was a higher low price rotation point. Thus, a failed “new price low”.

Since these two price points, Gold has settled into a sideways price channel where new price highs and lows have been attempted, but have failed to breakout out of the existing previous high and low price levels. As a technician of price, we can immediately identify this as a possible “Pennant or Flag” formation. With the last “new price level” being a “new price high” we still believe that Gold will attempt to break above the recent high price levels and attempt a much bigger upside price swing.

Our analysis suggests the April 21st date as a critical date for the potential price bottom in Gold and Silver. Our belief is that this date will like result in a near term momentum bottom in price. Where price may fall, briefly, below $1290 and rotate into a “washout low” price rotation. The opportunity for this move could come 3-5 days before or after the April 21st date.


This last chart, a Monthly price chart, illustrating the Pennant/Flag formation in Gold should be the clearest example we can provide that Gold will soon break out to the upside and rally extensively higher if our research and analysis are correct. The momentum that has built up over the past 2+ years, as well as the global demand for Gold by central banks and by investors as a hedging instrument, could prompt Gold and Silver to rally at least 50~60% in this first upside breakout wave – resulting in $1900 gold prices. Silver could rally to well above $18-$19 in a similar move and the number our researchers believe may become the upside target in Silver is $21.

This big picture chart and technical pattern could still take months to unfold if the price is to test the lower end of the trading range at $1225. If our analysis is correct, Gold and Silver could begin an upside price breakout shortly after April 21st (very likely to become evident in early May 2019). The upside potential for this move is at least $1550 in Gold and at least $18 in Silver.

Please understand that any upside breakout in Gold and Silver will likely be associated with general global market weakness including the potential for some type of global crisis event. This could be related to the EU, BREXIT, China, France or any other nation burdened by debt, dealing with election turmoil or related to social or economic angst. We could almost throw a dart at a map of the globe and hit some area that is poised for some type of economic crisis.


Our last buy signal for gold and gold miners was in Sept 2018 and subscribers and our team profited from that $100 gold rally. This next opportunity here is to understand that we only have about 20-25 days to search out and isolate the best entry prices we can find in Gold and Silver before our April 21st momentum bottom date hits. This means we need to prepare for this upside breakout move in Precious Metals and prepare our other open positions for the possibility of extended downside pricing concerns. If you read our continued research posts, you’ll understand that we believe the U.S. stock market will rotate a bit lower prior to this April 21st date and rally as well.

We believe the U.S. equities markets will become a safe haven, like Gold, where foreign investors can balance the strength of the U.S. Dollar with the strong U.S. economy and continued equity price appreciation while more fragile nations deal with economic crisis events and debt concerns. Thus, we believe capital will flood the US markets after April 21st as evidence of these economic concerns drives foreign investors into U.S. equities.

Take a minute to find out why Technical Traders Ltd. is quickly becoming one of the best research and trading services you can find anywhere on the planet. We are about to launch a new technology product to assist our members and we continue to deliver incredible research posts, like this one, where we can highlight our proprietary price modeling systems and adaptive learning solutions.

 If you want to stay ahead of these markets moves and find greater success in 2019 and beyond Join Our Wealth Trading Newsletter Today.

Chris Vermeulen

Stock & ETF Trading Signals

Monday, January 7, 2019

Natural Gas Trades Through Our $3.20 Target – What Next?

Our trading partner Chris Vermeulen and his research team at the Technical Traders have been nailing the market moves with their proprietary price modeling tools. Our December 12, 2018 call that Natural Gas would collapse nearly 30% after reaching a price peak was a very bold call. Who would have thought that predictive price modeling could be so accurate and could identify a move like this – or call for what is expected to happen next?

Back when Natural Gas breached the $4.60 - 4.80 range, our ADL predictive modeling system was suggesting a massive price anomaly was setting up. These types of triggers are becoming more common as volatility in the general markets increases. The ADL system suggested that a massive -30% downside price move would happen before the end of February 2019.

Now, as that trade has completed and our targets have been reached, we are alerting our followers that natural gas should begin to consolidate between $2.80 and $3.30 before attempting to rocket back above $4.00 near April or May 2019. Read our original analysis of Natural Gas to learn why these moves provide an incredible opportunity for traders and visit The Technical Traders Free Research page to read up on our early 2019 market predictions.


Join our other members in making 2019 an incredibly successful year. We believe 2019 will provide exceptional opportunities for skilled traders and we’ll be happy to share our proprietary research and analysis with you as a member of Technical Traders Ltd. You really don’t want to miss these moves and this incredible opportunity. Think about it, one trade like this with a -30% selloff followed by a 24% price rally could make your entire year. Imagine being able to find trades like this every week or month for success. Visit The Technical Traders and get ready to make 2019 a fantastic year of success no matter if we have a bull market or bear market.

Chris Vermeulen


Stock & ETF Trading Signals

Tuesday, December 11, 2018

Is a Deleveraging Event About to Unfold in the Stock Market?

As 2018 draws to a close and the global equities markets continue to find pricing and valuation pressures driving prices lower, a few questions come to mind for all investors/traders – Is a deleveraging event about to unfold? What will it look like if it does happen and how can I protect my investments from such an event? This research article is going to help you answer those questions and should help to resolve any lingering questions you may have regarding the true nature of this market rotation and volatility.

Our research team at The Technical Traders has been digging through the data and charts in an attempt to identify key elements of this recent price move. We are starting with our Monthly Adaptive Dynamic Learning Cycles chart of the ES (E-mini S&P). As you can see from this chart, our ADL Cycles modeling system is showing a deep downside price rotation is likely to unfold over the next 8 - 12 months. One thing to remember about this chart is that these cycles and the width of the future cycle peaks and troughs are NOT indicative of price target levels. Therefore, this downside move is NOT suspected of reaching price lows near 1000 or 1200. These cycles are representative of a magnitude of cycle events. In other words, this current cycle, downward, is expected to be a major cycle event that establishes a major price bottom somewhere near the end of 2019 or early 2020.

We urge traders to understand the scope of this cycle event. Look at the previous cycle events on this chart. Numerous downside cycle events have taken place over the past 10+ years that represent somewhat similar down cycle price moves. The most recent was in 2015 - 2016. This event represented a moderately deep down cycle even that equated to a 300 - 400 point price rotation in the ES. If the current cycle event is relative in scope to the last, then this current down-cycle event will likely result in a 600 - 800 point price rotation, and we have already experienced a nearly 300 point rotation in the ES. This would suggest a potential price bottom near 2100 - 2300 on the ES if the scale and scope of the current cycle event are relative to the previous down cycle event.


This next chart highlights key time/price cycles on the SPY Monthly chart to help us keep the timing of these events in perspective. As we have suggested, above, a major down cycle even may be unfolding that results in a deleveraging even across the global markets. If this does, in fact, take place, there are a number of elements that will likely play out. First, currencies will fluctuate dramatically as deleveraging takes root. Capital will seek out and identify the safest and most suitable returns by rushing away from risky markets and into safer markets. Additionally, a prolonged deleveraging of global equities may take place where valuations are reduced as capital attempts to establish a balance between expectations and true market value. Overall, this is a very healthy event for the markets as long as it does not result in a total collapse of price, as we saw in 2008-09.

This SPY chart highlights three key components of the markets current setup. First, the RED LINE (a 2.618 Fibonacci extension from the 2015 - 2016 price rotation at $266.50) is acting like a strong support level in the markets. This level, along with the 2018 lows near $254.78, are important levels that we are watching to determine if any further downside price activity is unfolding. As long as these two levels are not breached to the downside, we can confidently say that the upside trend is still intact. Second, the two BLUE price channels, which originate from the 2009 market bottom, establish a powerful upside price channel that will act as critical support should price reach near the lower level of this channel. This means that any downside price rotation will likely find solid support near $232.00 or higher. Lastly, the vertical time/price series cycles are suggesting that May and Oct of 2019 are likely to prompt significant price reversal patterns/setups. This helps us to understand that any potential breakout moves (up or down) will likely reach some critical inflection point, or reversal points, near May and October of 2019.


Next, we fall back to our Custom US Market Index chart on a Monthly basis. This chart, again, shows the support level originating from the lows of 2009 in a heavy BLUE line as well as two price channel levels that represent current price ranges. The first thing we want you to focus on is the breadth of the current rotation within the regression channel on this chart (the red/blue shorter price channel). Currently, the price is within this standard regression channel and has yet to break the longer-term, more aggressive, upward price channel. Additionally, we can see from this chart that the recent price activity is still measurably above the 2018 price lows near 374.12. Secondly, the Pitchfork channel, originating from the 2009 lows and spanning the range of the 2015 - 2016 price rotation, provides additional confirmation that we are still well above the middle and lower areas of this price channel. Even if the current price did fall by another 4 - 8%, the price would still be within the normal channel levels of this extended upside price channel.

So, when we consider the scale and scope of this current downside price rotation, we have to be very aware of the real expectations of the market. Yes, it looks frightening when we see it on a Daily or Weekly chart. But when we consider the real reality of the long term perspective, we can begin to understand how the price is reacting to the recent upside acceleration since 2017.


Lastly, this Daily ES chart is showing what we believe is the most important data of all and why all traders need to understand the risks involved in this rotating market. First, this chart shows our Adaptive Dynamic Learning Fibonacci price modeling system and the results of this chart are clear to our team or researchers – although it might be a bit cluttered to you. So we’ll try to explain the basic components of this chart for you.

The heavy RED and GREEN levels that are drawn above and below the price action are the Fibonacci Price Trigger levels. These indicate where and when we would consider a new price trend to be “confirmed” As you can see, the most recent “confirmed” trigger happened on Oct 10 with a huge breakdown of price confirming a bearish price trend. Since then, these Fibonacci Price Trigger Levels have expanded outside price as volatility and price rotation has also expanded. This indicates that price will have to make a bigger push, higher or lower, to establish any new confirmed price trend based on this modeling system.

There are two heavy YELLOW lines bordering recent price rotation on this chart that help us to understand a rather wide flag/pennant formation appears to be forming within these rotation/channel levels. For example, the absolute low of the current bar touched this lower YELLOW level and rebounded to the upside very sharply. It is very likely that a washout low price pattern executed today that may provide further price support near 2626 in the ES in the immediate future. Either way, the price will have to exit this YELLOW price channel if it is going to attempt any new upside or downside price trends. As long as it stays within this channel, we have a defined range that is currently between 2626 and 2800.

Lastly, the LIGHT BLUE oblique has been our estimated critical support level in the ES since our September 17 market call that a 5 - 8% downside price rotation was about to hit the markets. This level was predicted by our ADL predictive price modeling system and has been confirmed, multiple times, by price over the past few months. It is very likely that this level will continue to act as major support going forward and will be the last level of defense if price attempts a downside price move. In other words, as we stated above, 2600 - 2680 is a very strong support range in the markets right now. Any breakdown below this level could push the markets toward the 2018 price lows (or lower). As long as this level holds, we could see continued deleveraging in the markets as US Dollar, Energy, Commodity, Currency or global market price weakness while the US markets attempt to hold above the 2018 lows.


Pay very close attention to our Fibonacci price modeling and U.S. Custom Index charts, above, because we believe these charts paint a very clear picture. Yes, a deleveraging event is likely already unfolding in the global markets. It has been taking root in various forms over the past 12+ months in all reality. The U.S. markets are continuing to shake off the downside pricing pressures that we’ve seen in other global markets, and this is likely due to the “capital shift” event that is also unfolding throughout the globe.

Our advice for active traders would be to consider drastically reducing your trading sizes as well as pare back your open long positions if you are concerned about a market breakdown. Our modeling systems are suggesting we have many months of rotation within the market to reposition and evaluate our plans for future success. Unless the 2018 lows and the multiple critical support levels we’ve highlighted are threatened, we believe this rotation is nothing more than standard price rotation with acceptable ranges (see the charts above again if you have questions). Yes, there is still concern that a price breakdown may unfold and we are certainly seeing a deleveraging event taking place. We are not calling for a price collapse at the moment, and we have explained the reasons why we believe our research is accurate.

Use the best tools you can to assist you, just as we do for our members. The only thing you can do in a situation like this is taking factual data, evaluate the true price data and make an educated and logical conclusion about the markets. If you want to learn how we help our clients find and execute better trades and how we are preparing to make 2019 an incredibly successful year with our members, then visit The Technical Traders and see what we offer our members.

Chris Vermeulen


Stock & ETF Trading Signals

Wednesday, October 3, 2018

Why We Expect a 3rd Quarter Earnings Surprise

Our focus is on developing and deploying very specialized price modeling and predictive analysis systems. Our objective is to inform our members of these potential price moves and to assist them in finding successful trading opportunities. We are alerting all of our followers of a potential move today, because we believe this move could frighten some investors as we expect price rotation as Q3 earnings data is released just before the November 2018 mid-term elections.

The weekly $INDU (Dow Industrial Average) chart shows our Adaptive Predictive Learning (ADL) modeling system at work. In this example, we asked our ADL system what it believed would be the most likely outcome originating from July 23, 2018. The reason we selected this date is because this weekly price bar prompted the current upside price move. This type of price trigger can often generate highly accurate future predictive price data.

This bar consisted of 11 unique price markers that predict future price moves, first lower, then back to the upside, with a range of probability from 83% to 96%. The initial downside price move suggests that an initial -800 to -1000 pt move (-4%) will take place before November 10, 2018. Subsequently, price should begin to move upward again after the US mid-term elections and through the end of 2018.


In conclusion, October is known as a weak month for US equities so get ready for price volatility and expect the Tech heavy NASDAQ to rotate in a larger range than the S&P and the $INDU. Additionally, expect the VIX to increase in value over the next 30+ days as October passes.

I will admit the charts in July/Early September were showing signs of a market correction in mind September but no bearish reversal pattern formed and price continued higher. During this time we closed out a position in YINN for 14% profit and another 4.3% in the IYT ETF. This goes to show how we can profit to the long side even when we are expecting a sell off the markets. We trade based on technical analysis and use our ADL and other forecasting analysis to add more conviction to a move, but we don’t trade based on predictions along.

If you want to know how we help our members find and execute for greater success, visit The Technical Traders to see our completed trades for this year and learn how we can help you find great opportunities now and in the future.

Chris Vermeulen


Monday, September 24, 2018

Is Gold and the Miners About to Explode Upward?

After many weeks of pricing pressure as the U.S. Dollar extended a rally delivering nearly unending devaluation pricing in most commodities, Gold is setting up for a big upside rally and is likely to extend beyond $1240 in this initial run higher. We believe the immediate bottom has formed in Gold and we believe the upside move will consist of two unique legs higher. The first leg is likely to run to near $1240 - 1250 and end near the middle of November 2018. The second leg of this move will likely run to near $1310 and end near May 2019.

This move is the precious metals and miners will likely coincide with some moderate U.S. Dollar weakness as well as extended global market concerns related to the trade war with China, economic factors originating from China and the EU as well as concerns stemming from the existing emerging market issues. The bottom line is that all of these global concerns are setting up a nearly perfect storm for Gold, Silver and the mining sector to see some extended rallies over the next 6+ month – possibly longer.

Get our Free Newsletter Right Here

This Weekly Gold chart shows our proprietary Fibonacci price modeling system and we’ve highlighted key price points that are currently being predicted as targets. The CYAN colored line on this chart (near $1245) shows a number of key Fibonacci projected price levels align near this level. These coordinated price targets usually result in key price levels that price will target. So, $1240 - 1250 is setting up as our first upside target.

The second key level is the MAGENTA level near $1300. This lone target well above the other aligns with historical support going back to October/November 2017.


Ultimately, our Fibonacci price modeling system is showing projected price targets as high as $1435 and $1570 – see the YELLOW ARROWS on the chart below. These levels are valid targets given the current price rotation and the potential for these levels to be reached, eventually, should not be discounted. Our Fibonacci price modeling systems are adaptive and learns from price activity as it operates. It identifies these levels based on price activity, relational modeling and active learning of Fibonacci price structure and price theory. We believe these levels will become strong upside targets over the next 12+ months which indicates we have a potential for a massive 18% to 30% upside potential in Gold.


Please take a moment to read some of our other research posts at The Technical Traders to learn how we keep our members keenly aware of these market moves before they happen and help our members find profits with strategic trading signals. Our most recent trade has already gained over 8% in less than 2 days.

Our team of researchers are dedicated to helping you find and execute greater success and our advanced proprietary price modeling solutions are some of the best in the industry. Isn’t it time you decided to invest in your future by finding a solid team of professionals to help you create greater success?


Wednesday, June 27, 2018

Why Gold Miners Should Rally as U.S. Equities Fall on Fear

The US Equities markets rotated over 1.35% lower on Monday, June 25, after a very eventful weekend full of news and global political concerns. Much of this fear results from unknowns resulting from Europe, Asia, China, Mexico and the US. Currently, there are so many “contagion factors” at play, we don’t know how all of it will eventually play out in the long run.

Europe is in the midst of a moderate political revolt regarding refugee/immigration issues/costs and political turmoil originating from the European Union leadership. How they resolve these issues will likely be counter to the populist demands from the people of Europe.

Asia is in the midst of a political and economic cycle rotation. Malaysia has recently elected Prime Minister Dr. Mahathir Mohamad, the 92 year old previous prime minister (1981-2003) as a populist revolt against the Najib Razak administration. In the process, Mahathir has opened new and old corruption and legal issues while attempting to clean up the corruption and nepotism that has run rampant in Malaysia. Most recently, Mahathir has begun to question the established relationship with Singapore and the high speed rail system that was proposed to link the two countries.

China is experiencing a host of issues at the moment. Trade concerns, capital market concerns, corporate debt concerns and an overall economic downturn cycle that started near the beginning of 2018. What will it take to push China over the edge in terms of a credit/consumer market crash is anyone’s guess? Our assumption is that continued inward and outward pressures will not abate quickly – so more unknowns exist.

Mexico will have new Presidential elections on July 1, 2018. What hangs in the balance of this election cycle is just about everything in terms of North American economic cooperation and future success. It is being reported that a populist “anti-neoliberal” movement is well underway in Mexico and the newly elected leader may begin a broader pushback against President Trump regarding NAFTA, immigration, US corporations operating in Mexico and more. We won’t know the full outcome of this election till well after July 2018.

Meanwhile, back in the USA, our political leaders in Congress and the House of Representatives seem hell bent on opposing everything President Trump and many Americans seem to want – clean up the mess in our government and get a handle on the pressing issues before us. The U.S. has a growing and robust economy. The last thing anyone wants right now is anything to disrupt this growth. Yet, it seems the political divide in the U.S. is so strong that it may take some crisis event to push any resolution forward.

What does this mean for investors and traders? Fear typically appears in one place before it appears anywhere else – the Metals markets (Gold, Silver, Platinum, and Palladium). This Daily Gold Chart shows our predictive cycle analysis pointing to a near term bottom formation as well as a strong likelihood of immediate upside price action. These cycles do not represent price levels. So the cycle peak does not represent where price will go – it simply indicates future cycle trends and direction.

Given this information, it is very likely that Gold will recover to near 1320 within the next couple weeks and possibly push higher on global concerns. For traders, this means we are sitting near an ultimate bottom in the metals and this could be an excellent buying opportunity.


The Gold Miners ETF shows a similar cycle pattern but notice how prices in the Miners ETF have diverged from the Gold chart, above, by not resorting to a new price low as deep as seen above. This could be interpreted as the Gold market reacting to global concerns in an exaggerated way while the miners ETF is showing a more muted reaction. Additionally, notice how the ADL cycle analysis is pointing to similar price peaks in the future with near term bottoms forming. This is key to understanding what we should be expecting over the next few weeks in Gold.


Our interpretation is that the global fear will manifest as a renewed upside trend in Gold and Gold Miners over the next few weeks with the potential for a 5 to 8% rally in Gold. The long term upside is incredible for these trades but that is if you look years into the future.

As these fear components and unknowns continue to evolve, the metals markets should find support and push higher as fear continues to manifest and global markets continue to weaken.

As we have been stating since the beginning of this year, 2018 is setting up to be a trader’s dream. Bigger volatility. Bigger swings. Bigger profits if you are on the right side of these moves. Our proprietary predictive modeling systems and price analysis tools help us to stay ahead of the markets.

We help our members understand the risks and navigate the future trends by issuing research posts, providing Daily video analysis complete with cycle projections and by delivering clear trading signals that assist all of our members in finding profits each year. We are showing you one of our proprietary tools right now, our ADL Predictive Cycle tool and what we believe will be the start of a potential upside move in the metals markets.

 Get ready for some great trading over the next few months!


Stock & ETF Trading Signals

Wednesday, June 20, 2018

Are the Global Markets Shifting Away from U.S. Price Correlation?

Well over a month ago we warned our followers of a “capital market shift” that was taking place in the global markets. Nearly 3 months before that time, we warned that China’s economy was about to enter a sustained economic down trend cycle that could be dangerous to the global markets. Today, we offer further evidence that the global markets are, in fact, shifting away from a price correlation to the U.S. stock market and this move could be a warning sign that emerging markets and global markets could lead the world into an extended stagflation cycle.

Think about this for a minute, as we briefly discussed in our last article, what would happen if the U.S. markets continued to rally on a strong economy with strong consumer participation while the U.S. Fed was slow to raise interest rates while supporting a transitional shift of the US economy towards more manufacturing, technology, and expectations? How would the world’s economies react to such a shift given their current economic cycles and opportunities? Would they be able to keep up with the U.S. or would they start to trail further and further behind the U.S.?

It is our belief that any continued strengthening of the U.S. economy could, in fact, present real dangers for many of the world’s economies simply because they may fall completely out of sync with the U.S. stock market as their currencies, economies and consumer expectations fail to keep up with the U.S. capabilities. How all of this will play out over the next few months/years is our concern. We know it will result in some tremendous trading opportunities for investors, but it could also create a new class of undervalued assets that could present some real long term opportunity over the next 20+ years.

Let’s start by taking a look at our China/Asia custom index to show how the past 60+ days have more clearly shown this price disconnect happening. When you look at this chart, pay attention to how closely this custom index (the candles) have moved in relation to the SPY (the blue area chart overlaid onto the candles). Notice how the moves in the SPY were relatively closely mirrored by the custom index. This is a direct price correlation to the SPY over an extended period of time.

Now, focus on the last 6 - 9 bars on this chart and take a really close look at how the SPY has rallied higher while this custom index has stayed flat to lower over the same time frame. The only answer for this type of price disconnect is that a global capital shift could be underway that is driving capital out of certain markets and away from risk and danger. In other words, it is our opinion that the China/Asia markets are starting to be perceived as riskier and more dangerous in relation to the U.S. market and other more mature markets.


Now, let’s take a look at the BRICS custom index. YIKES!! What happened here? Through most of 2017, a price correlation can be seen where the BRICS index moved somewhat in unison with the SPY price activity – although in some cases a bit delayed. Yet, after March 2018, something dramatic happened. When the SPY rotated lower in late March 2018, the BRICS index stayed relatively flat near the highs. Then in May 2018, a price disconnect became very evident as the SPY began to rally while the BRICS index began to sell off – very dramatically. The BRICS index also broke through the BLUE price channel recently which is another sign that price trends/activities have shifted.


You should now be starting to see what we have been warning you about for months – the global capital market shift that is taking place. This is happening because mature nations and economies are capable of achieving great economic growth and stability than many foreign markets and because many foreign markets have squandered the last 10+ years attempting to expand externally and not support their fundamental economic needs. As we have used this example before, a flower only has two modes of operation – flower mode (expand) or survive (keep the core plant alive). We believe these foreign markets have been in “flower mode” for the past 10+ years and have failed to support the core elements of their economies.

Now, onto more examples, this time Western Europe. Again, this custom index is weighted with the SPY, so it should reflect some of the price support of the recent uptrend. Yet, we see the most recent few weeks of this chart have shown a dramatic downtrend? This would indicate that the European markets/currencies are disconnecting from the US majors at a much more dramatic pace, recently, that they have been over the past few years. Yikes!


What about India & SE Asia? Our custom India index has shown relatively FLAT recent price activity compared to the SPY. Overall, our opinion is that India has yet to completely diverge from the U.S. majors and we urge all investors to be aware that any further price breakdown in this India custom index will warn that the Indian/SE Asian economies are losing their battle to stay correlated to the U.S. markets going forward. Right now, there is evidence of weakness in the India custom index – yet there are limited signs of a broken correlation to the U.S. markets. It certainly shows that this price disconnect could be happening and likely is happening – yet we don’t have clear signs that this custom index is breaking to new lows (yet).


Lastly, let's take a look at our Russia/Eastern Europe custom index for signs of a price disconnect. This chart is somewhat similar to the India chart (above). There are signs of weakness and downside price rotation while the SPY has been rallying, yet there is not massive disconnect evident on the right edge of the chart. We believe the recent downside price rotation within this custom index are the early warning signs of a price disconnect in the early stages of setting up (just like in the India chart). We believe these charts clearly show that the US market (and other mature economies) are advancing beyond the functional capabilities of many emerging and foreign markets. What will come from this, if it continues to play out as we expect, is a huge number of opportunities for traders and investors.


The next 3 to 5 years are likely to be very interesting and exciting for traders and investors. These types of moves don’t happen too often and should these markets continue to rotate as we are expecting, we could see some very big currency and foreign market moves over the next few months and years. You owe it to yourself to stay ahead of this move and learn how to profits from the extended volatility that will likely result from this price disconnect.

We believe we have nailed this analysis as we have correctly called the weakness in China/Asia as well as the global capital shift that is starting to play out in the global markets. We already know what will likely move and when we should expect these opportunities to set up. We are preparing our valued subscribers for this move and protecting them by providing them even more detailed research and analysis than you are seeing here.

Visit The Technical Traders to learn how this could be the biggest opportunity of your trading and investing life and how you need a qualified and dedicated team of researchers to help you stay ahead of these moves over the next 2+ years with our long term discounted subscription plan and Save 39%. There will come a time when you will be wishing you had access to our proprietary research and member only trade alerts and investment positions. Become a technical trader today [just visit here] and prosper with us!

Chris Vermeulen
Technical Traders Ltd.

Monday, June 11, 2018

Here’s Why We See the G7, Central Banks and U.S. Fed Will Drive Stock Prices this Week

After last weeks closing bell for stocks and the early signs of the Capital Market Shift which we mentioned previously was taking place are now clearly evident. We wanted to alert all of our followers that this week could be very dramatic with a number of key events playing into global expectations.

Our research team at Technical Traders Ltd. have been combing through the charts trying to find hints of what may happen and what to expect in terms of price volatility next week. We know our ADL price modeling system is telling us that certain price weakness will continue in certain sectors and strength in others – but we are searching for the next opportunities for great trades.

One of the key elements of the G7 meeting is the continued communication regarding global participation in key infrastructure projects and national cooperation in regards to economic stability.

Over the past 8+ years, the bulk of the global recovery has been based on the US economic stability and recovery. US interest rates allowed for a global “carry trade” that supported a large component of the economic bias in foreign countries. Additionally, the deeply discounted U.S. bonds provided a “fire sale” opportunity for many countries to secure U.S. Treasuries at a time when global central banks were printing cash to support failing economies. Overall, the economic conditions from 2009 to 2015 were such that every opportunity was provided to the global markets to make it easier to attempt a proper recovery.

Some nations were able to capitalize on this environment while others squandered the opportunity to create future growth, capabilities and new opportunities for success. Given the current global market environment, we expect some harsh comments to come from the G7 meeting as well as some wishful thinking comments. Overall, we believe the outcome of the G7 meeting will become a defining moment for the remainder of the year in terms of global economic expectations and forward intent. It will certainly be interesting to see how these leaders decide to operate within the constructs of the ever changing global market liabilities to say the least.

Right now, a lot of concern has been directed towards the Emerging Markets and what appears to be a near term market collapse. Debt spreads and global indexes have been moving in a pattern that clearly illustrates the Central Banks problems in containing the diverse economic conditions throughout the globe. Infrastructure projects, social/political shifts and currency valuations are complicating matters by creating extended pressures in many global economies recently. All of this centers around the strength of the U.S. economy and the US dollar as related to expectations and valuations of other foreign economies and currencies.

Almost like a double edged sword, as the U.S. economy/dollar continues to strengthen, foreign capital will migrate into these US assets because of the inherent protection and gains provided by the strength and growth of these markets. While at the same time, the exodus of capital from these foreign markets create a vacuum of value/capability that results in a continued decline in asset valuations and more.

Almost like the 1994 Asian Currency Crisis, the more the US economy strengthens, the more pressures the global markets feel as valuations and assets become more risky to investors. As investors flee this risk, they search for safe returns and value that is found in the US economy/Dollar – driving US equities higher and strengthening the US Dollar. It is a cycle that will likely continue until some equilibrium point is reached in the future.

The US markets are on a terror rally because global capital is searching and seeking the greatest returns possible – and the only place on the planet, right now, that is offering this type of return is the US economy and the US equities market. Our recent research shows that the NASDAQ indexes may stall and rotate over the next few months as price valuations have accelerated quite far and because the blue chips are relatively undervalued at the moment. This means, capital will likely continue to pour into the S&P and DOW heavyweights as this capital shift continues to play out.

The G7 meeting, in Toronto, this week will likely present some interesting outcomes. Early talk is that the G6 nations (minus the US) may enact some deal that they believe would be suitable for these nations going forward. Our concern is not the deal or the threat of these nations trying to engage in some deal without the US – far from it. Our concern is that their wishes may be grandiose and ill timed given these currency and valuation issues.

Imagine, for a second, the G6 nations engage in some grand scheme to engage in something to spite the USA. Some plan that seems big and bold and over the top. Yet, 5 months from now, debt issues plague these nations, currency valuations have destroyed any advantage they may have perceived they had and the member nations are beginning to feel the pressures of their own entrapment. What then? The USA to the rescue....again?

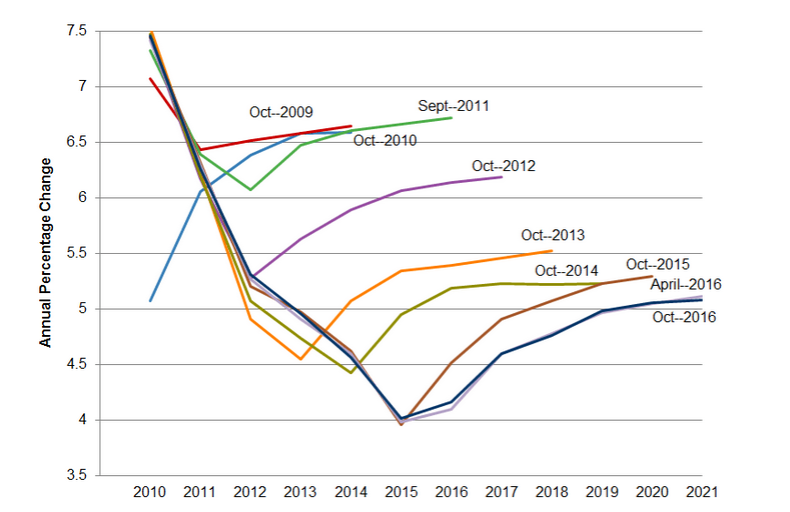
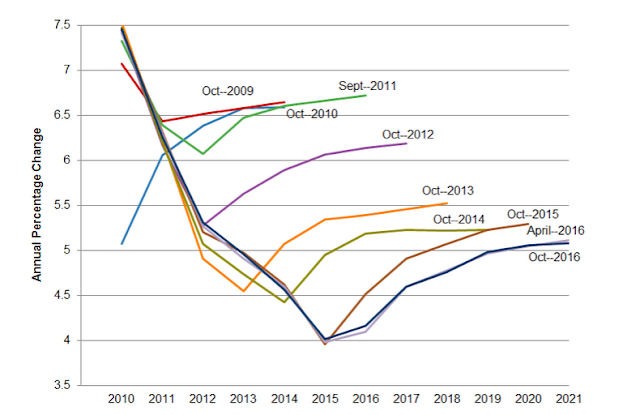
Recently, Ben Bernanke, a Senior Fellow at The Brookings Institute, warned that Donald Trump’s economy was like a Wile E. Coyote going over a cliff. Everything seems well and fine till the road ends and the cliff begins. I would like to remind all of our readers that The Brookings Institute does not have a stellar record of predicting much of anything over the past 10+ years. Take a look at this graph showing the economic expectations and predictions from The Brookings Institute over the past decade or so. Do these people seem capable of accurately predicting anything regarding the U.S. or global economy?

Now, ignoring all of the what if scenarios that are being presented by different people. The bottom line is that the next 6+ months are going to be very exciting for traders and investors. There are huge issues that are unfolding in the global economy right now. Currency levels are about to be shaken even further and the G6 nations, by the time they complete their high priced dinners and evening events, will walk out of the G7 meeting staring down a greater global debt/currency/economic beast of their own creation.

SE Asia is in the process or rewriting and resolving issues of the past 10+ years (see Malaysia / Singapore).


China is in the midst of a massive debt cycle that is about to play out over the next 18+ months (totaling about 1.8 Trillion Yuan).


The Brasil Bovespa Index has rotated into new BEARISH territory.


The Mexican iShares (EWW) ETF is about to break multi-year lows.


The Hang Seng Index is setting up a possible topping pattern that could break down given state and corporate debt concerns.


The iShares Turkey (EURONEXT) index has already broken to new multi-year lows.


The G6 better have some rabbits in their hats that they can magically transform into big bullish projects over the next 12 months or the economic functions that are at play in the world already are likely to steamroll over the top of any news that originates from the G7 meeting.

The U.S. markets are setup for a continued bullish rally with a bit of Summer capital shifts. Our recent research called the rotation out of the tech heavy NASDAQ and a renewed capital shift into the S&P and the DOW leaders. This rotation is likely to continue for many weeks or months as global investors realize the earnings capabilities and dividends values within the U.S. blue chips are of far greater long term value than the risks associated with technology and bio-tech firms. Because of this, we believe the S&P and DOW/Transports are setting up for a massive price rally to break recent all time market highs.

Here is a Daily chart of the YM futures contract showing the recent price breakout and rally. Our expectation is that 26,000 will be breached within 30 days or so and that a large capital shift will drive a continued advance through the end of 2018 – possibly further.


Here is a Daily $TRANS chart showing a similar bullish move. Although the Transportation Index has not broken to new highs yet, we believe this upside move is just beginning and we believe the continued improvements in the US economy will drive the Transportation index to near 11,450 or higher before the end of this year.


Our opinion continues to support the hypothesis that the US markets are the only game on the planet (at the moment) and that a great capital shift is underway in terms of investment in, purchases of and generally opportunistic investment opportunities for US equities and markets going forward. Until something changes where the US dollar strength, foreign economic weakness and foreign debt cycles are abated or resolved, we believe the great capital shift that we have been warning of will continue which will put continued pressures on certain foreign markets and expand debt burdens of at risk nations over time.

Smart traders will be able to identify these opportunities and capitalize on them. They will see this shift taking place and take advantage of the opportunities that arise for quick and easy profits. If you like our research and our understanding of the global markets, be sure to join our premium research and Trade Alert Wealth Building Newsletter. Our valued members stay with us because we have continually proven to be ahead of nearly every market move this year – in many cases many months ahead of the global markets. So, with all of this playing out over the next 6+ months, we suggest you consider joining The Technical Traders to learn how we can help to keep you out of trouble and ahead of the markets for greater success.





Stock & ETF Trading Signals