Showing posts with label Mauldin Economics. Show all posts

Saturday, January 2, 2016

A Half Dozen 2016 Stock Market Poisons

By Tony Sagami

Most of the “adults” on Wall Street are on vacation this week, and trading volume shrivels up to a trickle. That low volume is exactly the environment that the momentum crowd uses to paint the tape green. I call it the financial version of Reindeer Games.

However, once the “adults” return, the stock market will need to pay attention to the actual economic fundamentals and deal with facts—like, 2015 being the first year since 2009 when S&P 500 profits declined for the year.


I expect that 2016 is going to be a very difficult year for the stock market. Why do I say that? For any number of reasons, such as:

Poison #1: The Strong US Dollar

The greenback has been red hot. The US dollar index is up 9% in 2015 after gaining 13% in 2014.
A strong dollar can have a dramatic (negative) impact on the earnings of companies that do a significant amount of business outside of the US—for example, Johnson & Johnson, Ford, Yum Brands, Tiffany’s, Procter & Gamble, and hundreds more.


Poison #2: Depressed Energy Prices

I don’t have to tell you that oil prices have fallen like a rock. That’s a blessing when you stop at a gas station, but the impact on the finances of petro dependent economies, including certain US states, has been devastating. Plunging energy prices are going to clobber everything from emerging markets to energy stocks, to states like North Dakota and Texas.


Poison #3: Junk Bond Implosion

You may not have noticed because the decline has been orderly, but the junk bond market is on the verge of a total meltdown.


Third Avenue Management unexpectedly halted redemption of its high-yield (junk) Focused Credit Fund. Investors who want their money… tough luck. The investors who placed $789 million in this junk bond fund are now “beneficiaries of the liquidating trust” without any idea of how much they will get back and or even when that money will be returned. Third Avenue admitted that it may take “up to a year” for investors to get their money back. Ouch!

The problem is that the bids of the junkiest part of the junk bond market have collapsed. For example, the bonds of iHeartCommunications and Claire’s Stores have dropped 54% and 55%, respectively, since June!
What the junk bond market is experiencing is a liquidity crunch, the financial equivalent of everybody trying to stampede through a fire exit at the same time. In fact, the International Monetary Fund (IMF) warned that blocking redemptions could lead to an increase in redemption requests at similar funds.


Poison #4: Rising Interest Rates

As expected, the Federal Reserve hiked interest rates at its last meeting. The reaction (so far) hasn’t been too negative; however, we may have several more interest rate hikes coming our way.


Every single one of the 17 Federal Reserve members expects the fed funds rate to increase by at least 50 bps before the end of 2016, and 10 of the 17 expect rates to rise at least 100 bps higher in the next 12 months. I doubt our already struggling economy could handle those increases.


Poison #5: Government Interference

Sure, 2016 is an election year, which brings uncertainty and possibly turmoil. But the Obama administration could shove several changes down America’s throat via executive action—such as higher minimum wage, limits on drug pricing, gun control, trade sanctions including tariffs, immigration, climate change, and increased business regulation.


I don’t give the Republican led Congress a free pass either, as I have no faith that it will put the best interests of the US ahead of its desire to fight Obama.


Poison #6: China Contagion

We do indeed live in a small, interconnected world, and it’s quite possible that something outside of the US could send our stock market tumbling. Middle East challenges notwithstanding, the one external shock I worry the most about is one coming from China. The sudden devaluation of the yuan and the significant easing of monetary policy by the People’s Bank of China are signs that trouble is brewing.


However, I think the biggest danger is an explosion of non-performing loans in China. Debt levels in China, both public and private, have exploded, and I continue to hear anecdotal evidence that default and non-performing loans are on the rise.


Conclusion

To be truthful, I have no idea which of the above or maybe even something completely out of left field will poison the stock market in 2016, but I am convinced that trouble is coming. Call me a pessimist, a bear, or an idiot… but my personal portfolio and that of my Rational Bear subscribers are prepared to profit from falling stock prices.
Tony Sagami
Tony Sagami
30 year market expert Tony Sagami leads the Yield Shark and Rational Bear advisories at Mauldin Economics. To learn more about Yield Shark and how it helps you maximize dividend income, click here.

To learn more about Rational Bear and how you can use it to benefit from falling stocks and sectors, click here.


Get out latest FREE eBooK "Understanding Options"....Just Click Here

Thursday, December 10, 2015

How Big the Gig Economy Really Is

By John Mauldin

There is growing awareness of what is being called the “gig economy.” It’s not just Uber driving or Airbnb. There are literally scores of websites and apps where you can advertise your services, get temporary or part time work, and do so from anywhere you happen to be.

Some “gigs” actually pay pretty good money, but they are for people with specialized skills who prefer to live a somewhat different lifestyle than the typical 9 to 5’er does. My hedge fund friend Murat Köprülü has been busy researching and documenting this phenomenon and regularly regales me with what he finds.

He goes and spends evenings and weekends with young gig workers, trying to figure out what it is they really do and how they make ends meet in New York City. It turns out they need a lot less to support their lifestyle than you might imagine, and they prefer working intermittent gigs, being able to do what they want, and having no boss.

A close look at the data indicates that the gig economy is indeed big and growing. But there is a great deal of debate among economists about how big it really is.

It’s Much Bigger Than the Employment Data Suggests

Gig workers don’t seem to show up clearly in the BLS employment data. Typically, we would expect those working in the gig economy to appear in the self employed category, but that category is actually drifting downward in numbers—relatively speaking.

But Harvard economist Larry Katz and Princeton’s Alan Krueger, who are working on research to document the rise of the gig economy in America, says that our current measures ignore the bulk of the gig economy.

 From a story at fusion.net:
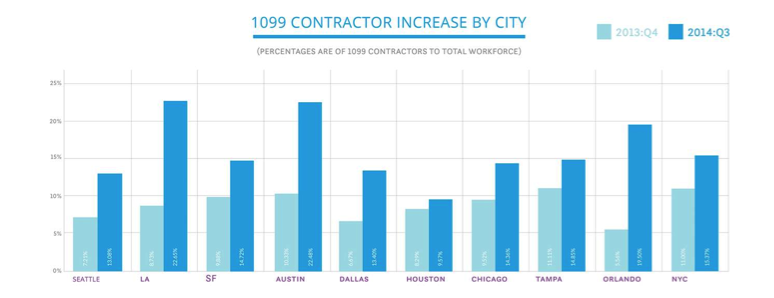
Katz said two pieces of evidence suggest current measures of self-employment and multiple-job holding are “missing a large part of the gig economy.” The first is that the share of the employed (and of the adult population) filing a 1099 form, the tax document “gig economy” workers must file, increased in the 2000s, even as standard measures of self-employment declined in the 2000s. Other groups have confirmed this: Zen Payroll, a site that tracks the sharing economy, found increases in the share of 1099 workers across many major U.S. metros.

Mauldin-Economics-Gig-Economy
Source: Zen Payroll via Small Business Labs

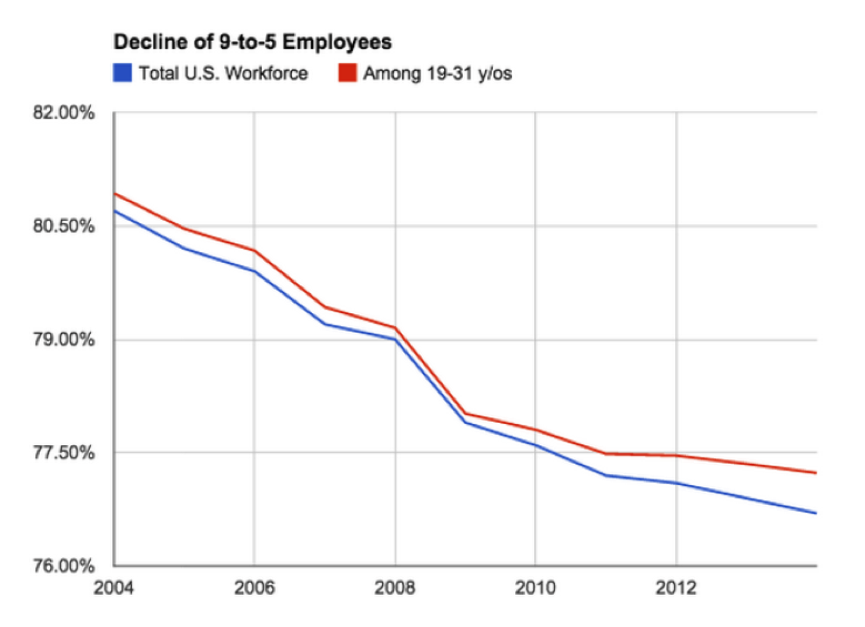
And data from research group EconomicModeling.com show the share of traditional, 9-to-5 workers in the labor force has declined…..

Mauldin-Economics-Gig-Economy
Source: Fusion, data via EconomicModeling.com

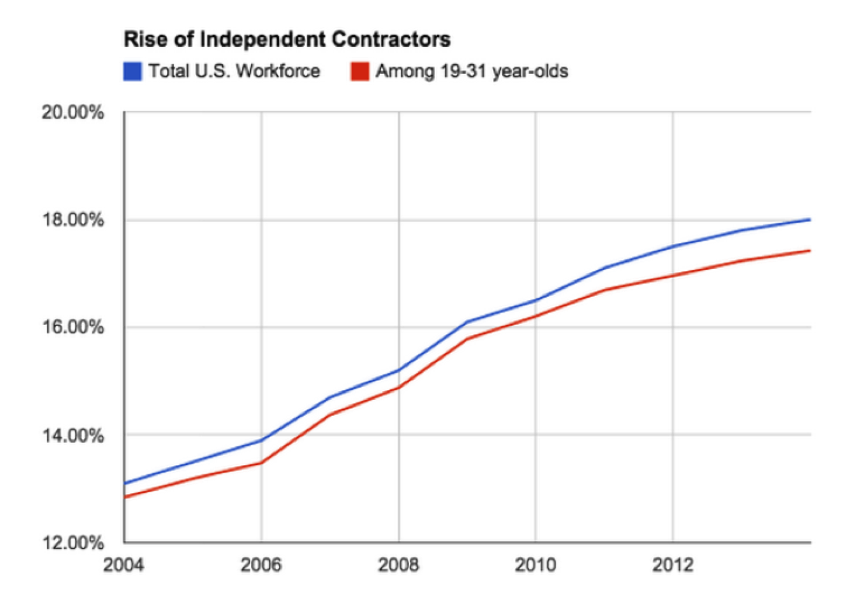
… while those who categorize themselves as “miscellaneous proprietors” is climbing.

Mauldin-Economics-Gig-Economy
Source: Fusion, data via EconomicModeling.com

A recent survey found 60 percent of such workers get at least 25 percent of their income from gig economy work.

The problem with the BLS estimates is that they overlook a sizable chunk of the true gig economy.
And this report absolutely squares with what my friend Murat’s research is showing: that gig economy is not shrinking. On the contrary, it’s on the rise, and a quite rapid rise.

Subscribe to Thoughts from the Frontline

Follow Mauldin as he uncovers the truth behind, and beyond, the financial headlines in his free publication, Thoughts from the Frontline. The publication explores developments overlooked by mainstream news to help you understand what’s happening in the economy and navigate the markets with confidence.

The article was excerpted from John F. Mauldin’s Thoughts from the Frontline. Follow John Mauldin on Twitter. The article How Big the Gig Economy Really Is was originally published at mauldineconomics.com.


Get our latest FREE eBook "Understanding Options"....Just Click Here!

Sunday, November 8, 2015

Jared Dillian is Pulling Out All the Stops

By Jared Dillian


When I was a teenager, I had a different sort of part-time job. I was a church organist. Actually, it was the best job ever because I was something of a piano prodigy as a child. Around age 12, my parents and I had to make a conscious decision about whether I was going to pursue a career in music. I decided not to, which has greatly reduced the amount of Ramen noodles I have eaten over the years.At age  13, I decided I wanted to play the organ. I took lessons from the organist in the big Catholic church downtown. What an incredible instrument!

Playing the organ is a lot harder than it looks. In case you hadn’t noticed, there is a whole keyboard at your feet—yes, you play with both your hands and your feet. And since you can’t possibly learn all the hymns, you have to be really good at sight-reading three lines of music at once. It takes a great deal of coordination. Plus, you have two or more “manuals” (keyboards) and dozens of stops, which activate the different sounds in the organ. This is where the phrase “pulling out all the stops” comes from.

So I got a job as the organist at the Unitarian church down the street. For the first and only time of my life, I was a member of a union—the American Guild of Organists. I received my union-protected minimum wage of $50 per service, which is a great deal of money if you’re 16 years old in 1990. $50 a week definitely put gas in my car. And there was a girl in the congregation that I dated a couple of times.

I felt sorry for my poor schlep classmates who were bagging groceries for $4/hour. They had to work 12 hours to make what I made in one. I felt pretty smug.  The high point was when I transcribed the theme from “A Clockwork Orange” and played it as the prelude for one of the church services. You can see where the subversive streak comes from.

I Got Skills

So why did I make more than 12 times what my high school classmates made? Because my skills were worth 12 times as much. Bagging groceries is kind of the definition of unskilled labor. Literally anyone can bag groceries. The supply of labor that has those skills is limitless.

Church organists are in slightly higher demand. But not by much! I think a church organist these days—if you are hired by the church to play every week, plus run all the choir and music programs, probably pays about $35,000 to $50,000 a year, depending on the church. So not a lot!

It’s a decent living if you like playing the organ, but you also have to deal with church politics. The wages of an organist not only depend on the supply of labor but the demand for labor as well. And church construction has gone way down in recent years. Not to mention the fact that the latest fad in religious services is “contemporary music.”


However, the fact that church organists make more money than grocery baggers does reflect the level of skill the occupation requires. Before I became a church organist, I had been playing either the piano or organ for six years. Six years of practicing 30 minutes to an hour a day, every day.

Nobody practices bagging groceries for 30 minutes a day, every day.

I don’t particularly like manual labor (though I have done it on occasion). That’s why I do my best to acquire skills that are rare and marketable so I don’t have to do things like chip paint. In this country (and others), we have this unhealthy obsession with manual labor. Politicians talk about “working Americans” all the time. We say things like “putting in a hard day’s work.” The most popular car is the Ford F-150. Who wants to put in a hard day’s work? Not me! Instead, I will put in a hard day’s thinking.

Hate and Discontent

A lot of people spend too much time thinking about what other people make. It’s unproductive. Everyone thinks Wall Street guys are overpaid, for example. Okay, so let’s take your average ETF option trader at a bank. Say he makes $500,000 a year (which might even be generous these days). Let’s examine one trade of many that he is confronted with on a daily basis. A sales trader stands up and yells to him, “20,000 XLE Jan 75 calls, how?”

What’s happening here is that a client is asking for a two-sided market on the January 75 call options in XLE, which is the Energy Select Sector SPDR ETF, 20,000 times, which means options on 2,000,000 shares, or about $140,000,000. It’s a big trade, definitely, but there are bigger ones. So let’s think of all the things the option trader needs to know. He needs to know what an option is, starting from scratch.

He needs to know what XLE is, that it’s an energy ETF, and he should have a good idea of what stocks are in the portfolio. He might have a cursory knowledge about factors affecting supply and demand for crude oil. In order to come up with a price for these options, he has to have an idea of what implied volatility should be and what realized volatility might be going forward.

This requires a knowledge of an option pricing model like Black-Scholes and many, many years of college mathematics, including probability theory and differential equations. He needs to know how he is going to hedge this option. Will he hedge the delta all in the stock? Will he hedge with other options? How will he dynamically hedge the trade until maturity? Will he lay off some of the risk in other strikes? Will he buy single stock options on some of the names in the index, like XOM, CVX, or COP, to effect a dispersion trade?

This means he has to know what a dispersion trade is. More math. He also needs to understand liquidity. What will be his execution impact by trying to sell 800,000 shares of XLE? This affects how wide he makes his market. And best of all, he needs to think about all of these things in a split-second, without hesitation. If he is off by even a penny—he loses money on the trade. I would characterize that as “skilled labor.” And we haven’t even talked about the emotional fortitude it takes to take that kind of risk. $500,000 a year seems low.

CEOs

People get the most upset about executive pay. Here you have some dillweed CEO who is the direct beneficiary of the agency problem. If company XYZ does well, he gets paid millions. If it does poorly, he gets fired and loses nothing, personally. We say that he has no skin in the game.

Well, do you have what it takes to run one of the 500 largest companies in the world?

Pretend we’re talking about McDonald’s. Many people think McDonald’s is doing a terrible job. There’s a lot of evidence that they are. They’re losing market share to Chipotle and lots of other “fast casual” restaurants.

But running a company is hard enough. You have 50,000 odd restaurants, you have to manage supply and distribution for this massive network, you have to do all the managerial science behind what is on the menu and how much it costs, you have to directly negotiate, and I mean meet with leaders of foreign governments, you need to go on CNBC from time to time and not be a mutant, and above all, you need to lead inspirationally.

Not many people can do all that. I can’t. Maybe I’m smart enough, but I don’t have the emotional maturity or even the desire for that kind of responsibility. Everyone wants to be the boss, but nobody really wants to be the boss. If you think you are underpaid—maybe you are. The labor market is not perfectly efficient. Anomalies can persist.

Take a look at people who you think are overpaid. What are they doing that you aren’t? Maybe you just aren’t willing to do those things (like kiss lots of ass). The responsibility is yours and yours alone. And that, my friends, is something nobody wants to hear.
Jared Dillian
Jared Dillian

If you enjoyed Jared's article, you can sign up for The 10th Man, a free weekly letter, at mauldineconomics.com. 

The article The 10th Man: Pulling Out All the Stops was originally published at mauldineconomics.com.


Get our latest FREE eBook "Understanding Options"....Just Click Here!

Saturday, October 3, 2015

A Worrying Set Of Signals

By John Mauldin 

There is presently a bull market in complacency. There are very few alarm bells going off anywhere; and frankly, in reaction to my own personal complacency, I have my antenna up for whatever it is I might be missing that would indicate an approaching recession.

It was very easy to call the last two recessions well in advance because we had inverted yield curves. In the US at least, that phenomenon has a perfect track record of predicting recessions. The problem now is that, with the Federal Reserve holding the short end of the curve at the zero bound, there is no way we can get an inverted yield curve, come hell or high water. For the record, inverted yield curves do not cause recessions, they simply indicate that something is seriously out of whack with the economy. Typically, a recession shows up three to four quarters later.

I know from my correspondence and conversations that I am not the only one who is concerned with the general complacency in the markets. But then, we’ve had this “bull market in complacency” for two years and things have generally improved, albeit at a slower pace in the current quarter.

With that background in mind, the generally bullish team at GaveKal has published two short essays with a rather negative, if not ominous, tone. Given that we are entering the month of October, known for market turbulence, I thought I would make these essays this week’s Outside the Box. One is from Pierre Gave, and the other is from Charles Gave. It is not terribly surprising to me that Charles can get bearish, but Pierre is usually a rather optimistic person, as is the rest of the team.

I was in Toronto for two back-to-back speeches before rushing back home this morning. I hope you’re having a great week. So now, remove sharp objects from your vicinity and peruse this week’s Outside the Box.

Your enjoying the cooler weather analyst,
John Mauldin

Stay Ahead of the Latest Tech News and Investing Trends...

Each day, you get the three tech news stories with the biggest potential impact.

A Worrying Set Of Signals

By Pierre Gave
Regular readers will know that we keep a battery of indicators to gauge, among other things, economic activity, inflationary pressure, risk appetite and asset valuations. Most of the time this dashboard offers mixed messages, which is not hugely helpful to the investment process. Yet from time to time, the data pack points unambiguously in a single direction and experience tells us that such confluences are worth watching. We are today at such a point, and the worry is that each indicator is flashing red.

Growth: The three main indices of global growth have fallen into negative territory: (i) the Q-indicator (a diffusion index of leading indicators), (ii) our diffusion index of OECD leading indicators, and (iii) our index of economically-sensitive market prices. Also Charles’s US recession indicator is sitting right on a key threshold (see charts for all these indicators in the web version).

Inflation: Our main P-indicator is at a maximum negative with the diffusion index of US CPI components seemingly in the process of rolling over; this puts it in negative territory for the first time this year.

Risk appetite: The Gavekal velocity indicator is negative which is not surprising given weak market sentiment in recent weeks. What worries us more is the widening of interest rate spreads—at the long end of the curve, the spread between US corporate bonds rated Baa and treasuries is at its widest since 2009; at the short-end, the TED spread is back at levels seen at the height of the eurozone crisis in 2012, while the Libor-OIS spread is at a post-2008 high. Moreover, all momentum indicators for the main equity markets are at maximum negative, which has not been seen since the 2013 “taper tantrum”.

These weak readings are especially concerning, as in recent years, it has been the second half of the year when both the market and growth has picked up. We see three main explanations for these ill tidings:

1) Bottoming out: If our indicators are all near a maximum negative, surely the bottom must be in view? The contrarian in us wants to believe that a sentiment shift is around the corner. After all, most risk-assets are oversold and markets would be cheered by confirmation that the US economy remains on track, China is not hitting the wall and the renminbi devaluation was a one-off move. If this occurs, then a strong counter-trend rally should ramp up in time for Christmas.

2) Traditional indicators becoming irrelevant: Perhaps we should no longer pay much attention to fundamental indicators. After all, most are geared towards an industrial economy rather than the modern service sector, which has become the main growth driver. In the US, industrial production represents less than 10% of output, while in China, the investment slowdown is structural in nature. The funny thing is that employment numbers everywhere seem to be coming in better than expected. In this view of things, either major economies are experiencing a huge drop in labor productivity, or our indicators need a major refresh (see Long Live US Productivity!).

3) Central banks out of ammunition: The most worrying explanation for the simultaneous decline in our indicators is that air is gushing out of the monetary balloon. After more than six years of near zero interest rates, asset prices have seen huge rises, but investment in productive assets remains scarce.

Instead, leverage has run up across the globe. According to the Bank for International Settlements’ recently released quarterly review, developed economies have seen total debt (state and private) rise to 265% of GDP, compared to 229% in 2007. In emerging economies, that ratio is 167% of GDP, compared to 117% in 2007 (over the period China’s debt has risen from 153 to 235% of GDP). The problem with such big debt piles is that it is hard to raise interest rates without derailing growth.

Perhaps it is not surprising that in recent weeks the Federal Reserve has backed away from hiking rates, the European Central Bank has recommitted itself to easing and central banks in both Norway and Taiwan made surprise rate cuts. But if rates cannot be raised after six-years of rising asset prices and normalizing growth, when is a good time? And if central banks are prevented from reloading their ammunition, what will they deploy the next time the world economy hits the skids?

Hence we have two benign interpretations and one depressing one. Being optimists at heart, we want to believe that a combination of the first two options will play out. If so, then investors should be positioned for a counter-trend rally, at least in the short-term. Yet we are unsettled by the market’s muted response to the Fed’s dovish message. That would indicate that investors are leaning towards the third option. Hence, we prefer to stay protected and for now are not making a bold grab for falling knifes. At the very least, we seek more confirmation on the direction of travel.

Positioning For A US Recession

By Charles Gave
Since the end of last year I have been worried about an “unexpected” slowdown, or even recession, in the world’s developed economies (see Towards An OECD Recession In 2015). In order to monitor the situation on a daily basis, I built a new indicator of US economic activity which contains 17 components ranging from lumber prices and high-yield bond spreads to the inventory-to-sales ratio. It was necessary to construct such an indicator because six years of extreme monetary policy in the US (and other developed markets) has stripped “traditional” cyclical economic data of any real meaning (see Gauging The Chances Of A US Recession).

Understanding this diffusion index is straightforward. When the reading is positive, investors have little to worry about and should treat “dips” as a buying opportunity. When the reading is negative a US recession is a possibility. Should the reading fall below – 5 then it is time to get worried – on each occasion since 1981 that the indicator recorded such a level a US recession followed in fairly short order. At this point, my advice would generally be to buy the defensive team with a focus on long dated US bonds as a hedge. This is certainly not a time to buy equities on dips.

Today my indicator reads – 5 which points to a contraction in the US, and more generally the OECD. Such an outcome contrasts sharply with official US GDP data, which remains fairly strong. Pierre explored this discrepancy in yesterday’s Daily (see A Worrying Set Of Signals), so my point today is to offer specific portfolio construction advice in the event of a developed market contraction. My assumption in this note is simply that the US economy continues to slow. Hence, the aim is to outline an “anti-fragile” portfolio which will resist whatever brickbats are hurled at it.

During periods when the US economy has slowed, especially if it was “unexpected” by official economists, then equities have usually taken a beating while bonds have done well. For this reason, the chart below shows the S&P 500 divided by the price of a 30 year zero coupon treasury.

A few results are immediately clear:
  • Equities should be owned when the indicator is positive.
     
  • Bonds should be held when the indicator is negative.
     
  • The ratio of equities to bonds (blue line) has since 1981 bottomed at about 50 on at least six occasions. Hence, even in periods when fundamentals were not favorable to equities (2003 and 2012) the indicator identified stock market investment as a decent bet. 
Today the ratio between the S&P 500 and long dated US zeros stands at 75. 
This suggests that shares will become a buy in the coming months if they underperform bonds by a chunky 33%. The condition could also be met if US equities remain unchanged, but 30 year treasury yields decline from their current 3% to about 2%. Alternatively, shares could fall sharply, or some combination in between. 


Notwithstanding the continued relative strength of headline US economic data, I would note that the OECD leading indicator for the US is negative on a YoY basis, while regional indicators continue to crater. The key investment conclusion from my recession indicator is that equity positions, which face risks from worsening economic fundamentals, should be hedged using bonds or upping the cash component.
Like Outside the Box?

Sign up today and get each new issue delivered free to your inbox. It's your opportunity to get the news John Mauldin thinks matters most to your finances.


The article Outside the Box: A Worrying Set Of Signals was originally published at mauldineconomics.com.


Get our latest FREE eBook "Understanding Options"....Just Click Here!

Monday, August 31, 2015

How I Learned to Stop Worrying and Love Market Fluctuations

By Patrick Cox

Most of you know that my day job involves finding disruptive technologies for investors. Most of you also know that the stock market has recently taken a southward plunge.

When I was younger, I always wondered why big fluctuations in markets seemed to cause so many people so much anxiety and consternation. It’s not as if we don’t know that, historically, markets have always displayed big swings. Understanding this, it always seemed clear to me that a rational individual would not invest money in equities if that money might be needed in the short run.

Obviously, I have a tendency to overestimate other people’s rationality because every one of these big swings inevitably creates the same predictable tsunami of lamentation and dread. So, once again, I’m feeling like an outsider in this industry. Not only am I emotionally unaffected by the market’s downturn, I’m pleased… for several interrelated reasons.

One reason is that fluctuations induce resiliency. A steady predictable market is a market that is susceptible to being stampeded, either up or down. Neither is particularly good for the economy. Nevertheless, the traders who take big paper losses when the market takes a nose dive tend to sell off, allowing investors to buy at reduced prices. This is good for the economy. Big fluctuations tend to move resources into the hands of investors, where they are less volatile and better serve the overall economy.

This means that fluctuations serve the interests of serious investors. The secret to success in the market is to “buy low and sell high.” Mathematically, this investment philosophy is pretty much impossible to implement if the market is never low. If you’re an investor rather than a trader, you welcome big downturns because they provide bargain prices.

I’ve talked to several other investment analysts recently about this and none of them share my perspective. They know that I’m right about the long run, but they worry when their customers are worried. My policy, however, is to make sure that my subscribers know that such events are going to happen as surely as the seasons change.

Moreover, I make sure to tell them that they should always be prepared to exploit the panic of the herd to add beaten-down stocks to their portfolios. If you implement this strategy, big downturns (like the one we’ve been seeing) are huge financial opportunities as well as a reason to celebrate.

There is, however, a third reason to welcome downturns. Sometimes, markets need to go down.

If the world reflected the wishes of investors and analysts, stocks would all go up… forever. But that’s not how the world or capitalism works. For progress to be made, innovation has to replace established and formerly successful businesses. Joseph Schumpeter, probably my favorite economist, coined the term “creative destruction” to describe this process.

The concept of creative destruction may seem oxymoronic simply because most people don’t think of destruction as a positive or creative process. Schumpeter, however, was an economist versed in the biological sciences. He was well aware of the fact that evolutionary processes always move forward by doing away with less adaptive systems. Creation of the new requires the destruction of the old.

A lot of people don’t understand or like this, but the extinction of species is the cost of adaptation. For innovation to move forward, the old order must die. Typically, investors are among those who fear this sort of change.

This brings me back to my original question: “Why aren’t I bothered by the destruction inherent in market downturns?” Prior to having my genome sequenced and analyzed, I had no clue. In fact, I never expected to have any sort of insight into why I am the way I am.

That changed when my genome was sequenced and analyzed by brilliant genomicists. Besides having markers associated with autism, I have significant contribution of genes associated with Neanderthal ancestry. Both characteristics are believed to reduce emotional sensitivities, though hopefully not in any sort of sociopathic way. In fact, the analysis of my genome was unsettling in many ways… simply because I saw so many of my personal characteristics in the code of my DNA. I’m not saying we are biological machines.

I am saying, however, that there are sophisticated and subtle things about every one of our personalities and natures rooted in our genes. Next week, I think I’ll get around to telling you how my sequenced genome settled a generations long argument my father’s family has had about our racial makeup.

I think it’s appropriate that there be some sort of personal impact from genomics. The decoding of our software is, after all, changing everything. Genomics may be the single greatest source of creative destruction our species has yet seen.

What we know today about the genetic causes of disease is changing medicine, but we’ve only begun to unravel the double helices of our fates. Every day, some new genetic discovery opens up new avenues to increase human health and health spans. The implementation of this new knowledge will not be a consistent process. It will be creative destruction at its best, yielding dramatic improvements in healthcare technologies while leaving entire sectors of the economy in ruin.

Despite the fact that everybody knows our healthcare institutions are obsolete and failing, many of those in the crosshairs of creative destruction are whistling in the wind, pretending that all is well. Moreover, they will resist change with their considerable institutional resources. But they will lose. And they will lose sooner than almost anybody expects.

Last week, I talked about Eric Topol, M.D., the cardiologist, geneticist, researcher, and writer who serves as Director of the Scripps Translational Science Institute in La Jolla, California. Topol is predicting rapid and radical change in the ways that healthcare is delivered. I’m currently reading his new book, “The Patient Will See You Now: The Future of Medicine is in Your Hands.”

If you don’t want to read a book, I would really recommend watching the following video about the way digital medicine will change and improve healthcare. This wakeup call is appropriately titled, “Creative Destruction of Medicine.”


Delivered at Strictly Mobile 2014 in Mountain View, CA, it is primarily about the impact of mobile devices on healthcare, but he refers to the much bigger impact that genomics will have on medicine. It’s not surprising that he only glosses over this area, however, as it is a topic way too big for a YouTube video.
Patrick Cox

From the TransTech Digest research team: To begin reading Patrick’s Tech Digest newsletter for free each Friday, simply click here. At Patrick’s Transformational Technologies site, you can join Tech Digest by entering your email address at the top right of the page. Thanks for reading.


Get out latest FREE eBooK "Understanding Options"....Just Click Here

Monday, August 24, 2015

Playing the Chinese Trump Card

By John Mauldin

“I know the Chinese. I’ve made a lot of money with the Chinese. I understand the Chinese mind.” – Donald Trump, 2011

Back in the olden days (pre-2000 or so), information junkies like me relied on printed newspapers, paper magazines, TV newscasts, and snail mail newsletters. All these channels still exist, but they can’t begin to compete with the constant stream of data rushing into our tablets and smartphones. And on some days the stream rushes faster.

Last week, for instance, it seemed I couldn’t go five minutes without another story on either (a) China or (b) Donald Trump. For a day or so, I really wondered if someone had planted malware in my browser to make me think all other topics were inconsequential. It was all Trump and China, all day and all night. China has pushed the Fed into second place (for a few days at least) – perhaps we should be grateful that at least something has. Of course, there is the little problem that a bear market might be in the offing. Commodity prices seem to be in the toilet. Global currency markets are throwing up. Isn’t the world supposed to be on vacation in August?

Let’s see if we can find a connecting thought or three among all these topics. Plus, I want to show you how the current market meltdown is being brought to you courtesy of your friendly US Federal Reserve Bank. As our starting point, though, let’s cast an eye at The Donald and Chinese currency manipulation.

“Nobody Does Anything”

As we all know by now, on Aug. 11 the People’s Bank of China changed the way it manages the renminbi daily trading band against the US dollar. The result was a two day drop for the RMB and a lot of consternation on trading floors around the world.

Taking questions at an event in Michigan that day, Donald Trump had this to say:
I think you have to do something to rein in China. They devalued their currency today. They’re making it absolutely impossible for the United States to compete, and nobody does anything. China has no respect for President Obama whatsoever, whatsoever.

Well, you have to take strong action. How can we compete? They continuously cut their currency. They devalue their currency. And I have been saying this for years. They have been doing this for years. This isn’t just starting. This was the largest devaluation they have had in two decades. They make it impossible for our businesses, our companies to compete.
                       
They think we’re run by a bunch of idiots. And what’s going on with China is unbelievable, the largest devaluation in two decades. It’s honestly – great question – it’s a disgrace.” Before you dismiss this as nonsense, remember that it comes from a Wharton School graduate.

Still not impressed? You’re right; it is indeed nonsense. Trump and all those who prattle on about Chinese currency manipulation have the economic comprehension of a parakeet. Is Trump really so clueless?

In one sense, it doesn’t matter. Trump isn’t talking to most of us. He draws an audience of frustrated, mostly middle-class Americans who are still hurting from the Great Recession. They want to blame someone. China is an easy target. So are illegal immigrants and Mexico and other faceless culprits. Furthermore, his audience has legitimate concerns. They are fully aware that both political parties ignore them.

A recent Gallup poll shows that 75% of our country believes there is significant corruption in government. They’re tired of it. They want to try something different. It is telling that a recent Michigan poll of Republican party activists found that 55% would go with either untested non politicians or Ted Cruz, who is about as much of an outsider as you can find inside the Washington DC Beltway.

I find almost nothing attractive about Donald Trump, but significant numbers in both parties have clearly demonstrated that they are looking for real change. Shades of Greece and Syriza’s coming to power, or France and the startling surge by Marine Le Pen’s Front National. The US is beginning to experience what our European friends have been living through the past few years.

Back to Trump and currency manipulation. I could do a sentence-by-sentence analysis of his populist harangue on China, but let’s take the really egregious statement: How can we compete? They continuously cut their currency. They devalue their currency. And I have been saying this for years. They have been doing this for years. This isn’t just starting. This was the largest devaluation they have had in two decades. They make it impossible for our businesses, our companies to compete.

No, they haven’t. This whole myth that China has purposely kept their currency undervalued needs to be completely excised from the economic discussion. First off, the two largest currency manipulating central banks currently at work in the world are (in order) the Bank of Japan and the European Central Bank. And two to four years ago the hands down leading manipulator would have been the Federal Reserve of the United States. The leaders/aggressors in the currency wars come and go.

Today, the euro is off over 30% from its highs, as is the Japanese yen. Numerous other currencies are likewise well into double digit slides. China has moved maybe 3 to 4%. Oh, wow.

Secondly, Donald (and to be fair I should address this to Senators Schumer and Graham, et al., too) the Chinese have not been continuously cutting their currency for years. In fact, if they have manipulated their currency, it was first to make it even stronger when the dollar was falling and then to hold those gains in the face of the steadily rising dollar. Meanwhile the rest of the world (Japan, Europe, Great Britain, Brazil, India, among others) was letting their currencies drift down.

The simple fact is that the Chinese currency rose by 20% over the last five years up until a week ago, for reasons we will examine a little later. It is utterly wrong headed to call a 20% rise over almost 10 years “continuous devaluation.” Yes, prior to that time they did allow their currency to devalue rather precipitously, but if you look back and think about it, they were faced with something of a crisis at the time. Most currencies do fall during periods of economic stress.

Don’t get me wrong. The United States and China have a several page list of issues that need to be worked out between them. If you read my recent book on China, you learned about more than a few of those problems. But given that the Federal Reserve has been the most egregious currency manipulator in the world over the last five years, hearing the pot calling the kettle black probably sticks in the craw of most non US citizens. I understand it makes for a great populist harangue. It’s always easiest to blame our problems on someone else. But it doesn’t get us anywhere we want to go.

Back to the main story. Let’s look at this fascinating chart from my friend Chris Whalen over at the Kroll Bond Rating Agency:


Chris writes:

With the end of QE in sight in 2014, the dollar began to climb against most major currencies with the exception of the yuan, which remained effectively pegged against the dollar because of intervention by the PBOC. The yuan has, in fact, appreciated steadily against the dollar since 2006 and continued to move higher within the managed foreign exchange regime maintained by the Chinese government. 

Until last week, the PBOC had been using its foreign exchange reserves to cope with the increased demand for dollars from domestic investors. The decision to end the defense of the currency has economic as well as financial ramifications. For example, investors are starting to wonder just how much foreign currency debt China has accumulated to fund infrastructure investment as well as foreign ventures, and whether this total is reflected in official debt statistics.

Oil and copper are priced in dollars. From the point of view of China, and much of the rest of the world, oil is up several times in the last 15 years, and copper is up 2 to 3 times, even after the recent selloffs. From an inflation-adjusted standpoint, the rest of the world just sees things as getting back to normal. A strong dollar can do that.

Chinese Déjà Vu

Trump’s China complaints are nothing new. I wrote an entire issue on this topic five years ago (and Jonathan Tepper and I dealt with it at length in both Endgame and Code Red.) At that time, economist Paul Krugman and a group of senators led by New York Democrat Chuck Schumer wanted to impose a 25% tariff on Chinese imports. This is from my March 20, 2010, issue: I probably shouldn't take on a Nobel Laureate who got his prize for his work on trade, but this truly scares me. People pay attention to this nonsense, including the five senators, led by Schumer of New York, who want to start the process of targeting China.

First, the Chinese have got to be wondering what they have to do to make these guys happy. In 2005 they were demanding a 30% revaluation of the Chinese yuan. And over the next three years the yuan actually rose by 22% at a gradual and sustained pace. Then the credit crisis hit, and China again pegged their currency [even as the dollar got weaker!]. From their standpoint, what else were they to do? Force their country into a recession to appease our politicians?

They responded by a massive forcing of loans to their businesses and governments and huge infrastructure projects. Kind of like our stimulus, except they got a lot more infrastructure to show for their money. It remains to be seen how wise that policy was, and how large the bad (non performing) loans will be that came from that push – just as there are those (your humble analyst included) who do not think the way we went about the stimulus plan in the US was the wisest allocation of capital.

But the reality is that the Chinese will do what is in their best interest. I wrote in 2005 that the yuan would rise slowly over time. The political posturing of Schumer, et al., was counterproductive then, and it still is now.

My prediction? The Chinese will begin to allow the yuan to rise again sometime this year, just as they did three years ago, because it will be to their advantage. A stronger yuan will act as a buffer to inflation, which they may face due to the massive stimulus they created. They are going to need some help in that area. But it will be 5–7% a year, so as not to create a shock to their export economy. Not 25% at one time. And at some point they will allow the yuan to float against the dollar. They know they will have to in order to get the currency status they want.

Back then, it was Schumer and Krugman who wanted to “rein in” China. Now we have Trump saying more or less the same things. Look at what happened in the intervening five years, in this chart from Krugman’s home-base New York Times.


And sure enough, right on schedule and as I predicted in 2010, the RMB began to slowly rise and rose through early 2014. This was about the same time that “China stopped acting Chinese,” as I wrote earlier this month. At about that time, China Beige Book detected a noticeable shift in Chinese business behavior, when companies stopped using the government’s stimulus to add new capacity.

Our hypothesis, you may recall, is that the Chinese monetary stimulus began going into stocks instead of capital improvement projects. That inflow led to the stock bubble that has popped over the last few weeks. Which resulted in an apparent panic in the halls of Chinese government.

Code Red at the PBOC

Sorting through the approximately 47,000 China reports people sent me in the last 10 days, I see two broad categories of analysis. To continue reading this article from Thoughts from the Frontline – a free weekly publication by John Mauldin, renowned financial expert, best-selling author, and Chairman of Mauldin Economics – please click here.


Get out latest FREE eBooK "Understanding Options"....Just Click Here


Tuesday, August 18, 2015

A Great Insight into Why Commodity Weakness Will Persist

By John Mauldin 

In today’s Outside the Box, good friend Gary Shilling gives us deeper insight into the global economic trends that have led to China’s headline making, market shaking devaluation of the renminbi. He reminds us that today’s currency moves and lagging growth are the (perhaps inevitable) outcome of China massive expansion of output for many products that started more than a decade ago. China was at the epicenter of a commodity bubble that got underway in 2002, soon after China joined the World Trade Organization.

As manufacturing shifted from North America and Europe to China –with China now consuming more than 40% of annual global output of copper, tin, lead, zinc and other nonferrous metal while stockpiling increased quantities of iron ore, petroleum and other commodities – many thought a permanent commodity boom was here.

Think again, Australia; not so fast, Brazil. Copper prices, for instance, have been cut nearly in half as world growth, and Chinese internal demand, have weakened. Coal is another commodity that is taking a huge hit: China’s imports of coking coal used in steel production are down almost 50% from a year ago, and of course coal is being hammered here in the US, too.

And the litany continues. Grain prices, sugar prices, and – the biggee – oil prices have all cratered in a world where the spectre of deflation has persistently loomed in the lingering shadow of the Great Recession. (They just released grain estimates for the US, and apparently we’re going to be inundated with corn and soybeans. The yield figures are almost staggeringly higher than the highest previous estimates. Very bearish for grain prices.)

Also, most major commodities are priced in dollars; and now, as the US dollar soars and the Fed prepares to turn off the spigot, says Gary, “raw materials are more expensive and therefore less desirable to overseas users as well as foreign investors.” As investors flee commodities in favor of the US dollar and treasuries, there is bound to be a profound shakeout among commodity producers and their markets.

See the conclusion of the article for a special offer to OTB readers for Gary Shilling’s INSIGHT. Gary’s letter really does provide exceptional value to his readers and clients. It’s packed with well-reasoned, outside-the-consensus analysis. He has consistently been one of the best investors and analysts out there.

There are times when you look at your travel schedule and realize that you just didn’t plan quite as well as you could have. On Monday morning I was in the Maine outback with my youngest son, Trey, and scheduled to return to Dallas and then leave the next morning to Vancouver and Whistler to spend a few days with Louis Gave. But I realized as Trey and I got on the plane that I no longer needed to hold his hand to escort him back from Maine. He’s a grown man now. I could’ve flown almost directly to Vancouver and cut out a lot of middlemen. By the time that became apparent, it was too late and too expensive to adjust.

Camp Kotok, as it has come to be called, was quite special this year. The fishing sucked, but the camaraderie was exceptional. I got to spend two hours one evening with former Philadelphia Fed president Charlie Plosser, as he went into full-on professor mode on one topic after another. I am in the midst of thinking about how my next book needs to be written and researched, and Charlie was interested in the topic, which is how the world will change in the next 20 years, what it means, and how to invest in it. Like a grad student proposing a thesis, I was forced by Charlie to apply outline and structure to what had been only rough thinking.

There may have been a dozen conversations like that one over the three days, some on the boat – momentarily interrupted by fish on the line – and some over dinner and well into the night. It is times like that when I realize my life is truly blessed. I get to talk with so many truly fascinating and brilliant people. And today I find myself with Louis Gave, one of the finest economic and investment thinkers in the world (as well as a first class gentleman and friend), whose research is sought after by institutions and traders everywhere. In addition to talking about family and other important stuff, we do drift into macroeconomic talk. Neither of us were surprised by the Chinese currency move and expect that this is the first of many
.
I did a few interviews while I was in Maine. Here is a short one from the Street.com. They wanted to talk about what I see happening in Europe. And below is a picture from the deck of Leen’s Lodge at sunset. Today I find myself in the splendor of the mountains of British Columbia. It’s been a good week and I hope you have a great one as well.


Oops, I’ve just been talked into going zip-trekking this afternoon with Louis and friends. Apparently they hang you on a rope and swing you over forests and canyons. Sounds interesting. Looks like we’ll do their latest and greatest, the Sasquatch. 2 km over a valley. Good gods.

Your keenly aware of what a blessing his life is analyst,
John Mauldin, Editor

Stay Ahead of the Latest Tech News and Investing Trends...

Each day, you get the three tech news stories with the biggest potential impact.

Commodity Weakness Persists

(Excerpted from the August 2015 edition of A. Gary Shilling’s INSIGHT)
The sluggish economic growth here and abroad has spawned three significant developments – falling commodity prices, looming deflation and near-universal currency devaluations against the dollar. With slowing to negative economic growth throughout the world, it’s no surprise that commodity prices have been falling since early 2011 (Chart 1). While demand growth for most commodities is muted, supply jumps as a result of a huge expansion of output for many products a decade ago. China was the focus of the commodity bubble that started in early 2002, soon after China joined the World Trade Organization at the end of 2001.


China, The Manufacturer


As manufacturing shifted from North America and Europe to China – with China now consuming more than 40% of annual global output of copper, tin, lead, zinc and other nonferrous metal while stockpiling increased quantities of iron ore, petroleum and other commodities – many thought a permanent commodity boom was here.

So much so that many commodity producers hyped their investments a decade ago to expand capacity that, in the case of minerals, often take five to 10 years to reach fruition. In classic commodity boom-bust fashion, these capacity expansions came on stream just as demand atrophied due to slowing growth in export-dependent China, driven by slow growth in developed country importers. Still, some miners maintain production because shutdowns and restarts are expensive, and debts incurred to expand still need to be serviced. Also, some mineral producers are increasing output since they believe their low costs will squeeze competitors out. Good luck, guys!

Copper, Our Favorite


Copper is our favorite industrial commodity because it's used in almost every manufactured product and because there are no cartels on the supply or demand side to offset basic economic forces. Also, copper is predominantly produced in developing economies that need the foreign exchange generated by copper exports to service their foreign debts. So the lower the price of copper, the more they must produce and export to get the same number of dollars to service their foreign debts. And the more they export, the more the downward pressure on copper prices, which forces them to produce and export even more in a self reinforcing downward spiral in copper prices. Copper prices have dropped 48% since their February 2011 peak, and recently hit a six year low as heavy inventories confront subdued demand (Chart 2).


Even in 2013, after two solid years of commodity price declines, major producers were in denial. That year, Glencore purchased Xtrata and Glencore CEO Ivan Glasenberg called it “a big play” on coal. “To really screw this up, the coal price has got to really tank,” he said at the time. Since then, it’s down 41%. But back in February 2012 when the merger was announced, coal was selling at around $100 per ton and Chinese coal demand was still robust.

Nevertheless, Chinese coal consumption fell in 2014 for the first time in 14 years and U.S. demand is down as power plants shift from coal to natural gas. Meanwhile, coal output is jumping in countries such as Australia, Colombia and Russia. China’s imports of coking coal used in steel production are down almost 50% from a year ago. Many coal miners lock in sales at fixed prices, but at current prices, over half of global coal is being mined at a loss. U.S. coal producers are also being hammered by environmentalists and natural gas producers who advocate renewable energy and natural gas vs. coal.

Losing Confidence?


Recently, major miners appear to be losing their confidence, or at least they seem to be facing reality. Anglo-American recently announced $4 billion in writedowns, largely on its Minas-Rio $8.8 billion iron ore project in Brazil, but also due to weakness in metallurgical coal prices. BHP took heavy writedowns on badly timed investments in U.S. shale gas assets. Rio Tinto’s $38 billion acquisition of aluminum producer Alcan right at the market top in 2007 has become the poster boy for problems with big writeoffs due to weak aluminum prices and cost overruns.

Glencore intends to spin off its 24% stake in Lonmin, the world’s third largest platinum producer. Iron ore-focused Vale is considering a separate entity in its base metals division to “unlock value.” Meanwhile, BHP is setting up a separate company, South 32, to house losing businesses including coal mines and aluminum refiners. That will halve its assets and number of continents in which it operates, leaving it oriented to iron ore, copper and oil.

Goldman Sachs coal mines suffered from falling prices and labor problems in Colombia. It is selling all its coal mines at a loss and has also unloaded power plants as well as aluminum warehouses. The firm’s commodity business revenues dropped from $3.4 billion in 2009 to $1.5 billion in 2013. JP Morgan Chase last year sold its physical commodity assets, including warehouses. Morgan Stanley has sold its oil shipping and pipeline businesses and wants to unload its oil trading and storage operations.

Jefferies, the investment bank piece of Leucadia National Corp., is selling its Bache commodities and financial derivatives business that it bought from Prudential Financial in 2011 for $430 million. But the buyer, Societe Generale, is only taking Bache’s top 300 clients by revenue while leaving thousands of small accounts, and paying only a nominal sum. Bache had operating losses for its four years under Jefferies ownership.

Grains and other agricultural products recently have gone through similar but shorter cycles than basic industrial commodities. Bad weather three years ago pushed up grain prices, which spawned supply increases as farmers increased plantings. Then followed, as the night the day, good weather, excess supply and price collapses. Pork and beef production and prices have similar but longer cycles due to the longer breeding cycles of animals.

Sugar prices have also nosedived in recent years (Chart 3). Cane sugar can be grown in a wide number of tropical and subtropical locations and supply can be expanded quickly. Like other Latin American countries, Brazil – the world's largest sugar producer – enjoyed the inflow of money generated from the Fed’s quantitative easing. But that ended last year and in combination with falling commodity prices, those countries’ currencies are plummeting (Chart 4). So Brazilian producers are pushing exports to make up for lower dollar revenues as prices fall, even though they receive more reals, the Brazilian currency that has fallen 33% vs. the buck in the last year since sugar is globally priced in dollars.


Oil Prices


Crude oil prices started to decline last summer, but most observers weren’t aware that petroleum and other commodity prices were falling until oil collapsed late in the year. With slow global economic growth and increasing conservation measures, energy demand growth has been weak. At the same time, output is climbing, especially due to U.S. hydraulic fracking and horizontal drilling. So the price of West Texas Intermediate crude was already down 31% from its peak, to $74 per barrel by late November.

Cartels are set up to keep prices above equilibrium. That encourages cheating as cartel members exceed their quotas and outsiders hype output. So the role of the cartel leader – in this case, the Saudis – is to accommodate the cheaters by cutting its own output to keep prices from falling. But the Saudis have seen their past cutbacks result in market share losses as other OPEC and non-OPEC producers increased their output. In the last decade, OPEC oil production has been essentially flat, with all the global growth going to non-OPEC producers, especially American frackers (Chart 5). As a result, OPEC now accounts for about a third of global production, down from 50% in 1979.


So the Saudis, backed by other Persian Gulf oil producers with sizable financial resources – Kuwait, Qatar and the United Arab Emirates – embarked on a game of chicken with the cheaters. On Nov. 27 of last year, while Americans were enjoying their Thanksgiving turkeys, OPEC announced that it would not cut output, and they have actually increased it since then. Oil prices went off the cliff and have dropped sharply before the rebound that appears to be temporary. On June 5, OPEC essentially reconfirmed its decision to let its members pump all the oil they like.

The Saudis figured they can stand low prices for longer than their financially-weaker competitors who will have to cut production first. That list includes non-friends of the Saudis such as Iran and Iraq, which they believe is controlled by Iran, as well as Russia, which opposes the Saudis in Syria. Low prices will also aid their friends, including Egypt and Pakistan, who can cut expensive domestic energy subsidies.

The Saudis and their Persian Gulf allies as well as Iraq also don’t plan to cut output if the West's agreement with Iran over its nuclear program lifts the embargo on Iranian oil. As much as another million barrels per day could then enter the market on top of the current excess supply of two million barrels a day.

The Chicken-Out Price


What is the price at which major producers chicken out and slash output? It isn’t the price needed to balance oil-producer budgets, which run from $47 per barrel in Kuwait to $215 per barrel in Libya (Chart 6). Furthermore, the chicken out price isn’t the “full cycle” or average cost of production, which for 80% of new U.S. shale oil production is around $69 per barrel.


Fracker EOG Resources believes that at $40 per barrel, it can still make a 10% profit in North Dakota as well as South and West Texas. Conoco Phillips estimates full cycle fracking costs at $40 per barrel. Long run costs in the Middle East are about $10 per barrel or less (Chart 7).


In a price war, the chicken out point is the marginal cost of production – the additional costs after the wells are drilled and the pipelines laid – it’s the price at which the cash flow for an additional barrel falls to zero. Wood Mackenzie’s survey of 2,222 oil fields globally found that at $40 per barrel, only 1.6% had negative cash flow. Saudi oil minister Ali al-Naimi said even $20 per barrel is “irrelevant.”

We understand the marginal cost for efficient U.S. shale oil producers is about $10 to $20 per barrel in the Permian Basin in Texas and about the same on average for oil produced in the Persian Gulf. Furthermore, financially troubled countries like Russia that desperately need the revenue from oil exports to service foreign debts and fund imports may well produce and export oil at prices below marginal costs – the same as we explained earlier for copper producers. And, as with copper, the lower the price, the more physical oil they need to produce and export to earn the same number of dollars.

Falling Costs


Elsewhere, oil output will no doubt rise in the next several years, adding to downward pressure on prices. U.S. crude oil output is estimated to rise over the next year from the current 9.6 million level. Sure, the drilling rig count fell until recently, but it’s the inefficient rigs – not the new horizontal rigs that are the backbone of fracking – that are being sidelined. Furthermore, the efficiency of drilling continues to leap. Texas Eagle Ford Shale now yields 719 barrels a day per well compared to 215 barrels daily in 2011. Also, Iraq’s recent deal with the Kurds means that 550,000 more barrels per day are entering the market. OPEC sees non-OPEC output rising by 3.4 million barrels a day by 2020.

Even if we’re wrong in predicting further big drops in oil prices, the upside potential is small. With all the leaping efficiency in fracking, the full-cycle cost of new wells continues to drop. Costs have already dropped 30% and are expected to fall another 20% in the next five years. Some new wells are being drilled but hydraulic fracturing is curtailed due to current prices. In effect, oil is being stored underground that can be recovered quickly later on if prices rise Closely regulated banks worry about sour energy loans, but private equity firms and other shadow banks are pouring money into energy development in hopes of higher prices later. Private equity outfits are likely to invest a record $21 billion in oil and gas start ups this year.

Earlier this year, many investors figured that the drop in oil prices to about $45 per barrel for West Texas Intermediate was the end of the selloff so they piled into new equity offerings (Chart 8), especially as oil prices rebounded to around $60. But with the subsequent price decline, the $15.87 billion investors paid for 47 follow-on offerings by U.S. and Canadian exploration and production companies this year were worth $1.41 billion less as of mid-July.


Dollar Effects


Commodity prices are dropping not only because of excess global supply but also because most major commodities are priced in dollars. So as the greenback leaps, raw materials are more expensive and therefore less desirable to overseas users as well as foreign investors. Investors worldwide rushed into commodities a decade ago as prices rose and many thought the Fed’s outpouring of QE and other money insured soaring inflation and leaping commodity prices as the classic hedge against it.

Many pension funds and other institutional investors came to view them as an investment class with prices destined to rise forever. In contrast, we continually said that commodities aren’t an investment class but a speculation, even though we continue to use them in the aggressive portfolios we manage.

We’ve written repeatedly that anyone who thinks that owning commodities is a great investment in the long run should study Chart 9, which traces the CRB broad commodity index in real terms since 1774. Notice that since the mid-1800s, it’s been steadily declining with temporary spikes caused by the Civil War, World Wars I and II and the 1970s oil crises that were soon retraced. The decline in the late 1800s is noteworthy in the face of huge commodity-consuming development then: In the U.S., the Industrial Revolution and railroad building were in full flower while forced industrialization was paramount in Japan.


At present, however, investors are fleeing commodities in favor of the dollar, Treasury bonds and other more profitable investments. Gold is among the shunned investments, and hedge funds are on balance negative on the yellow metal for the first time, according to records going back to 2006. Meanwhile, individual investors have yanked $3 billion out of precious metals funds.

Commodity Price Outlook

Commodity prices are under pressure from a number of forces that seem likely to persist for some time.

1. Sluggish global demand due to continuing slow economic growth.
2. Huge supplies of minerals and other commodities due to robust investment a decade ago.
3. Chicken games being played by major producers in the hope that pushing prices down with increasing supply will force weaker producers to scale back. This is true of the Saudis in oil and hard rock miners in iron ore.
4. Developing country commodity exporters’ needs for foreign exchange to service foreign debt. So the lower the prices, the more physical commodities they export to achieve the same dollars in revenue. This further depresses prices, leading to increased exports, etc. Copper is a prime example.
5. Increased production to offset the effects on revenues from lower prices, which further depresses prices, etc. This is the case with Brazilian sugar producers.
6. The robust dollar, which pushes up prices in foreign currency terms for the many commodities priced in dollar terms. That reduces demand, further depressing prices.

It’s obviously next to impossible to quantify the effects of all these negative effects on commodity prices. The aggregate CRB index is already down 57% from its July 2008 pinnacle and 45% since the more recent decline commenced in April 2011. To reach the February 1998 low of the last two decades, it would need to drop 43% from the late July level, but there’s nothing sacred about that 1998 number.

In any event, ongoing declines in global commodity prices will probably renew the deflation evidence and fears that were prevalent throughout the world early this year. And they might prove sufficient to deter the Fed from its plans to raise interest rates before the end of the year.

Like Outside the Box? Sign up here today and get each new issue delivered free to your inbox.
It's your opportunity to get the news John Mauldin thinks matters most to your finances.

The article Outside the Box: Commodity Weakness Persists was originally published at mauldineconomics.com.


Get our latest FREE eBook "Understanding Options"....Just Click Here!

Sunday, August 2, 2015

Distressed Investing

By Jared Dillian 

When most people think of distressed investing, they think of buying CCC-rated bonds at 20 or 30 cents on the dollar, then maybe sitting in bankruptcy court to divvy up the capital structure, making healthy risk-adjusted returns in the end. You just need to hire a few lawyers.

Distressed investors are a different breed of cat. It’s one of those countercyclical businesses, like repo men, who do well when everyone else is getting hammered.

I remember distressed guys killing it in 2002. Most people remember the dot-com bust, but there was a nasty credit crunch that went along with it. Nasty. High yield/distressed investments had some amazing years in 2003 and 2004. Convertible bonds in particular.

Funny thing about distressed investors is that they like to stay within their comfort zone. In my experience, they’re not keen on commodities. Like coal mining, which this week saw one bankruptcy filing and another one in the works. Distressed guys hate commodities because they are just timing the earnings cycle – which is the same as market timing.  Distressed guys want less volatile earnings so their projections aren’t totally dependent on commodity prices rising.

Coal is distressed, all right. But you don’t see the distressed guys getting involved. Even they are too scared!


Here’s a somewhat controversial statement: I think most commodities are distressed. Coal is definitely distressed. So is iron ore. Copper, too. And yes, even gold. Corn and beans have had a nice little run, but metals and energy in particular have been a complete horrorshow.

So I think it’s time to start looking at commodities as a distressed asset class. The assumption is that fair value of these commodities/producers is well above current market prices, and current market prices are wrong because of, well, a lot of things. In particular, a self-reinforcing process where selling begets more selling.

If you’re a distressed investor and you’re buying something at a deep discount, if you have a long enough time horizon, you’ll be vindicated eventually. Sometimes, it takes a long time. Sometimes, not very long at all. It’s pretty great when it works.

I have never had much aptitude for it. But I am trying it now.

Gold: A Special Case


Gold is a little different.

How do you value gold? It has no cash flows. An industrial commodity like copper is pretty easy to value. With gold, you’re trying to gauge investment demand (at the retail or sovereign level), which is hard, against mining production, which is a little easier.

But what an ounce of gold is worth is entirely subjective. More subjective than copper or cocoa or coffee. For example, if everyone started using bitcoin, there would be little to no demand for gold. (For the record, I think cryptocurrencies indeed have had an impact on gold demand.)

Basically, people want gold when they think their government no longer cares about the purchasing power of their currency. In our case, that was when the Fed was conducting quantitative easing, known colloquially as printing money.

But that’s not really what people were nervous about. Think about it. The Fed was printing money for monetary policy reasons. They were trying to effect monetary policy with interest rates at the zero bound. That’s different from printing money to buy government bonds because nobody else wants to. That’s called debt monetization.

When budget deficits get sufficiently large, people worry about things like failed bond auctions, that the Fed will have to step in and be the buyer of last resort. This is the nightmare scenario described in Greenspan’s Gold and Economic Freedom essay.

We had $1.8 trillion deficits not that long ago. The bond auctions were a little scary. I thought debt monetization was a possibility.

The deficit is lower today, mostly because of higher taxes, more aggressive revenue collection, and economic growth. As you can see, the price of gold has corresponded almost perfectly with the budget deficit.


With a small deficit today, nobody cares about gold.

Is the deficit going higher or lower in the future? Higher. Ding-ding-ding, we have a winner. One of the reasons I’m happy owning gold as a part of my portfolio.

Paper vs. Things


Asset allocation gets a lot easier when you figure out that the financial markets are a tug-of-war between paper and things. Sometimes, like now, financial assets (stocks and bonds) outperform. Stocks are overpriced, and bonds are way overpriced. Other times, like 10 years ago, commodities outperformed.

It has to do with the degree of confidence people have in… other people. A bond is a promise to repay. A stock is a promise to pay dividends, or that there will be something left over at the end. A dollar is a promise that it’s worth something, namely, a divisible part of the sum total of the productive abilities of all the people in the country.

These are pieces of paper. Paper promises. When confidence in promises is high, nobody needs gold, coal, or copper. When confidence in promises is low, time to build that underground bunker in the backyard. Confidence in promises is currently at all-time highs. Without making a positive statement either way, I’d say that only in the year 2000 were commodities more undervalued than they are right now.

Sidebar: it is tempting to treat commodities as an asset class, but you should try not to. They are idiosyncratic, and for most commodities, the cost of carry is high enough that it’s impractical to hold them for long periods of time.

Commodity related equities are a different story.

Disclaimer


I’m kind of biased on this, and I always think commodities are undervalued because I’m a deeply suspicious person and I don’t believe promises. I’ve owned gold and silver for years (plus GLD and SLV, and GDX and SIL), and if prices get low enough, I will add to those positions.

Keep in mind that I worked for the government under the Clinton administration. Clinton’s mantra to government employees was, “Do more with less.” The man did a lot to restrain the growth of government—and he was a Democrat!


People resented him for it. They wanted their fancy toys and their boondoggles. Public servants have been much happier under Bush and Obama. Not coincidentally, gold bottomed in 2000, at the end of Clinton’s presidency, and has basically been going up since.

So here is the secret sauce: You want to know when commodities are going up?
Watch the deficit. If someone dreams up free college for everyone, buy commodities with veins popping out of your neck.
Jared Dillian
Jared Dillian

If you enjoyed Jared's article, you can sign up for The 10th Man, a free weekly letter, at mauldineconomics.com. Follow Jared on Twitter @dailydirtnap


The article The 10th Man: Distressed Investing was originally published at mauldineconomics.com.


Get our latest FREE eBook "Understanding Options"....Just Click Here!


Sunday, July 19, 2015

The Biggest Trade Ever....No Exaggeration

By Jared Dillian


I won’t keep you in suspense. The biggest trade ever is in demographics. In particular, our rapidly increasing life expectancy.

Quick story. My Coast Guard friends are retiring now. You get to retire after 20 years of service, but some of them have been taking advantage of early retirement and are leaving the service as young as age 40.
Oh my God, what a deal: At age 40, you can bring home about $50K a year and then start a whole new career on the side!

In the old days, you could offer that deal because military folks would die at 47. Now they will live to 100.
Paying out benefits for 60 years to retired military personnel doesn’t sound like a great deal for the taxpayer.
Of course, the military pensions are just the tip of the iceberg. To receive Social Security, you can retire at age 62 (or 67 for full benefits). Again, that’s fine when most people die before 62. The blended life expectancy (for both men and women) is almost 79 years and trending higher.


Or my favorite chart on life expectancy ever, also a rebuttal to those who don’t like capitalism.


If you pay attention to Silicon Valley stuff, you know that Google and Ray Kurzweil and some other folks are working on projects that will allow us to live to 150 or even beyond. That would involve doing a couple of things, first
  1. Curing cancer
  2. Curing heart disease
  3. Curing Alzheimer’s disease
You do these three things, it increases life expectancy by another 10 years or more. And we are actually doing those things!

Once you have a cure for all known diseases (attainable in my lifetime), then you have a different problem. Cells get old and die. The Silicon Valley folks are working on that too. Funny, if you don’t smoke, eat right, and get a little exercise, you will pretty much live to 80, no matter what. What happens beyond that is up to genetics, which we will solve one day. So what will the world look like if people live to 100, 150, or more?

It Looks Like Greece


Greece’s retirement age (to receive benefits) used to be 55 years. Again: retiring at 55, what a deal! I would only have 14 more years to go. People are pretty healthy at 55 (though maybe not the Greeks—they have the highest rate of tobacco use in the developed world).

So if people live way longer than the retirement age, the Social Security system goes kablooey. It just does. And yet people resist all attempts to reform it. We know Social Security is in trouble. George W. Bush tried to tackle it. For all his faults, it was the right thing to do. But he got laughed at.

The first thing we will do is to means-test the benefits, which will just make it more progressive but won’t solve the actual problem. You need to push back the retirement age, like, to 80.

But wait a minute. There aren’t even enough jobs for people to work until age 80.

I know…..

The World Was a Lot Simpler When People Just Died When They Were Supposed To


We’re going to look back at the 1940s-2000s as an exceptional period in economic history—with high, virtually straight line, uninterrupted economic growth. We had debt problems before, but biology has made them intractable.

In fact, the whole profession of economics is based on the very idea that there is population growth and inflation. What happens if birth rates decline? They are. Population growth rates will peak very soon. (By the way, the old Malthusian idea of overpopulation is being discredited.) What does the profession of economics look like with declining populations, people living longer, a dearth of unskilled jobs?

Is it nonstop deflation?

Many economists predict years of global deflation based on this premise. They say that you should buy bonds at any price. It’s a compelling argument. I think we’re going to learn a lot of really interesting things about money velocity in the coming years.

The Trade


Like tech in the ‘90s and energy in the 2000s, health care has been and will be the trade of the 2010s. You have the happy accident of huge technological advances and a government that seems willing, for the time being, to pay for it all. You hear some squawking about the cost of some treatments, but seriously, if you can cure cancer for $250,000, who is going to say no? Especially when that person’s chemotherapy, radiation, and hospital bills could easily exceed $2,000,000.

Lots of folks thought that Obamacare would tomahawk the health care sector. In classic market fashion, it has done the exact opposite. The insurers in particular have been the biggest beneficiary. You probably saw the recent Aetna/Humana merger.

People have tried for years to short biotech. Hasn’t been fun for them.

People have funny attitudes about death, you know. You ask someone if they’d like to live to 100, 120. “Noooooo,” they say. “I wouldn’t want to just sit in a chair.” Me, personally, I’d be okay with sitting in a chair. But the point of these treatments is that you can be active into your 100s. What then?

“I don’t know…” they say.

Are you kidding me? Forever young, my man. I’m 41, and I look a lot younger than my parents at the same age (sorry, Mom and Dad). I’m still DJing parties, for crying out loud.
Still don’t get the point of Snapchat, though.
Jared Dillian
Jared Dillian


Get our latest FREE eBook "Start Identifying Patterns in the Markets Today"....Just Click Here!