Showing posts with label Natural Gas. Show all posts

Sunday, March 29, 2020

Three Charts Every Trader and Investor Must See

Understanding the stock market and its potential through the use of technical analysis and historical price events has been proven repeatedly to outperform all forms of fundamental trading styles. The following is a story that walks you through my experience, the shift in my mindset and how I came to the conclusion that the three charts I share in this article are critical to your understanding of to make money in today’s market!

When I first learned to trade, I got all caught up with researching companies and finding the ones with the best earnings and future growth. I did that for several years after studying and following many “professional traders” who said it was the best way to trade and invest long term. We lost our shirts during the 2000 bear market by continuing to trade on fundamentals as stocks fell in value week after week. Even the companies that showed quarterly earnings growth fell in value – none of it seemed to make any sense to me, and it was very frustrating.

Losing money when buying the best companies made no logical sense, making me step back from the markets and ask myself, ‘what am I doing wrong here‘. People today are asking themselves the same question given today’s dizzying markets:

· Telsa shares fell from $971 a share down to $347, whopping 63% drop, in only a few weeks and then rebounded again too xx

· Netflix is down 30%, even though people are stuck at home desperately trying to find things to watch)

· Amazon has fallen 26% in the past couple of weeks despite soaring demand for their delivery services

· GDXJ, the gold miners sector that is typically a safe haven during times of volatility, crashed 57% even though gold is usually a safe haven during times of volatility.

So, what was I doing wrong? I started calling and visiting traders who were making money during the bear market to see what they were doing, and 100% of them were doing the same thing – Trading with Technical Analysis. I wasn’t doing anything wrong, per se. I was simply using the wrong tools and analysis for success!

What is Technical Analysis? In short, it’s the study of price, time, and volatility of any asset using price charts and indicators. Traders use technical analysis to find cycles and patterns in the market and trade on the analysis of preferred indicators as opposed to the fundamentals of a company and/or the economy in general.

When you start studying technical traders, you will notice every trader has a particular time frame, a preferred set of indicators, and trading frequency that fits their unique personality and lifestyle. Their brains can see the charts in ways you and I may not see them to predict future price direction over the next few hours, days, weeks, or months ahead. I quickly learned there are infinite ways to trade using technical analysis.

I was very surprised by how much these pro traders allowed me. While standing over their shoulders, I was looking at their charts to try to divine their high-level strategies and learn how they think, analyze, and trade. It was amazing how different each of them traded the market. Some traded currencies; others traded stocks, indexes, options, futures, etc. Most were day traders, swing traders, or a mix of the two. But none of them gave me their secret sauce. That is why I turned 100% of my focus to technical analysis. I was excited at the prospect of being able to profit from both rising and falling prices and no concern for anything other than price action reduced my research time dramatically. It was and is the biggest AH-HA moment of my life and a turning point for my career as a trader.

The year was 2001, when I made the shift to technical analysis. I unsubscribed from everything fundamental based. I canceled my CNBC, stopped listening to news, and stopped reading other people’s reports altogether. My goal was to create my own technical trading strategy that best suited my personality and lifestyle. I would have to discover the securities I was most comfortable trading, the frequency I would trade, and the type and amount of risk I was prepared to take.

I traded options, covered-calls, currencies, stocks, ETFs, and futures. From day trading to position trading (holding several months), I tried it all, hoping something would click for me to pursue at a much deeper level. Day trading, momentum, and swing trading were my sweet spots. Having three of them was a bonus as I know some traders only ever master one in their lifetime if they are lucky. I grew a liking for trading the major indexes like the DJIA, S&P 500, and Nasdaq… great liquidity with big money always at play.

Along my journey, I realized that if I could predict the overall market trend direction for the day or week, then I could day trade small cap stocks in the same direction as the index, knowing 80+% of the stocks follow the general stock market trend. I could generate much larger gains in a very short period of time. As time went on, I became comfortable predicting, trading, and profiting from the indexes, and my new trading strategy began to emerge.

I was fortunate enough to start learning about the markets and trading in college with a $2,000 E-Trade account, and then retiring (kinda) in 2009 at the age of 28. I built my dream home on the water, bought cars and boats, and spent time traveling with my growing family. I love trading and sharing my analysis with others – it is better than I had ever imagined and why I continue to help thousands of traders around the world every day with these video courses Trading System Mastery, and Trading As Your Business.

I contribute 100% of my trading success and lifestyle to the fact that I embraced technical analysis, where my strategy involves nothing more than price movement, position-sizing, and trade risk management techniques. All these allow me to easily reduce exposure, drawdowns, and losses with proper position sizing and protective strategies. If you want quick and simple, read about my journey and core trading tools in my book Technical Trading Mastery – 7 Steps to Win with Logic. My strategy is represented by human psychology and historical trading, as expressed in the three charts below.

Chart 1 – Human Psychology is What Drives Price Action

This chart is my favorite as it explains trader and investor psychology at various market stages. It also includes a simplified market cycle in the upper right corner, letting you know where the maximum financial risk is for investors and the highest opportunity for a trade.


Chart 2 – 2000 Stock Market Top & Bear Market That Followed

The chart may look a little overwhelming, but look at each part and compare it to the market psychology chart above. What happened in 2000 is what I feel is happening this year with the stock market sell-off.

In 2000, all market participants learned of at the same time was that there were no earnings coming from their darling .com stocks. Knowing they were not going to make money for a long time, everyone started selling these terrible stocks, and the market collapsed 40% very quickly.

What is similar between 2000 and 2020? Simple really. COVID-19 virus has halted a huge portion of business activity, travel, purchases, sporting events, etc. Everyone knows earnings are going to be poor, and many companies are going to go bankrupt. It is blatantly clear to everyone this is bad and will be for at least 6-12 months in corporate earnings; therefore, everyone is in a rush to sell their stock shares and are in a panic to unload them before everyone does.


Chart 3 – The 2020 Stock Market Top Looks to Be Unfolding

As you can see, this chart below of this year’s market crash is VERY similar to that of 2000 thus far, it’s based on a similar mindset, which is the fear of losing money, which causes everyone to sell their positions.

I am hopeful that we get a 25-30% rally from these lows before the market starts to fall and continue the new bear market, which I believe we are entering. Only the price will confirm the direction and major trend to follow, and since we follow price action and do not pick tops or bottoms, all we have to do is watch, learn, and trade when price favors new low risk, high reward trade setups.

It does not matter which way the market crashes from here, we will either profit from the next leg down, or will miss/avoid it depending on if we get a tradable setup. Either cause is a win, just one makes money, while the worst case scenario just preserves capital in a cash position, you can’t complain either way if you ask me.


Before you continue, be sure to opt-in to our free market trend signals before closing this page, so you don’t miss our next special report!

Concluding Thoughts

In short, is if you lost money during the recent market crash, then you likely have not mastered a technical trading strategy and do not have proper trade management rules in place. All traders must manage risk and trades to be sure you lock in profits and limit losses when prices start pullback or collapse. Without either of these, you will not be able to achieve long term success/gains, and that’s a fact.

While we can all make money during a bull market when stocks are rising, if you cannot retain or grow your account during market downturns, then you may as well be a passive buy and hold investors. You are better at riding the emotional investor rollercoaster without wasting your time and effort as a trader if you are not going to spend the time and money to learn to follow someone to become a successful trader. Without proven trading strategies or someone to follow, you are more likely to underperform a long term passive investor.

I get dozens of emails from people every week trying to trade this wild stock market and use leveraged ETFs, which doing so during these unprecedented market conditions is absolute craziness if you ask me.

These people think that because there are big moves in the market, they should be trading. That big money should be made trading them, which drives me crazy because it could not be further from the truth unless you are a scalp or day trader. To me, in this market condition, it’s about preserving capital, not risking it, in my opinion.

A subscriber to my market video analysis and ETF trading newsletter said it perfectly:

“Always intrigues me how many amateur surfers get to the north shore beaches in Hawaii, take one look at monster waves and conclude it’s way too dangerous. Yet the amateur trader looks at treacherous markets like these and wants to dive right in!!” Richard P.

I have to toot my own horn here a little because subscribers and I had our trading accounts close at a new high watermark for our accounts. We not only exited the equities market as it started to roll over we profited from the sell off in a very controlled way.

I hope you found this informative, and if you would like to get a pre-market video every day before the opening bell, along with my trade alerts, visit my ETF swing trading visit my website at The Technical Traders.

Chris Vermeulen
Founder of The Technical Traders 



Stock & ETF Trading Signals

Thursday, March 12, 2020

Revisiting Our July 2019 Crude Oil Predictions & Our 2020 Forecast

When it comes to our Adaptive Dynamic Learning (ADL) predictive modeling system, we get asked questions from our friends and followers about how it could predict a virus event or how it could predict a price event so far out into the future. The truth of the matter is the ADL predictive modeling system doesn’t predict unknown virus, banking or other types of events.

What it does do, quite well we might add, is identify historically accurate price events (almost like unique DNA markers) and attempts to identify future price events that align with recent price bar (DNA) setups. In other words, it maps the markets highest probability outcomes by studying past price activity and using a unique DNA like mapping system. Once this analysis is complete for any chart, we can ask it what is likely to happen in the future.

On July 8, 2019, our researchers did exactly that and posted an article regarding our findings that many people continue to write us about. Some, at first, in total disbelief that Crude Oil could fall to levels below $40 ever again and others that wanted to know how we came up with these numbers. We set our ADL system to show us what is expected on a Monthly Crude Oil chart going forward and it draws the likely outcome and volatility (highs & Lows).

Here is a link to the original article....Just Visit Here

This Screen Capture From The Original July 2019 Article Clearly States

If our ADL predictive modeling is correct, we will see rotation between $47 and $64 over the next 3+ months before a breakdown in price hits in November 2019. This will be followed by two fairly narrow price range months (December 2019 and January 2020) where oil prices will tighten near $45 to $50. After that tightening, we believe an extremely volatile price move will happen in February through April 2020 that could see oil prices trade as low as $22 and as high as $51 over a two to three-month span.

The most critical component of this early research is the statement we have timed perfectly with our system was “we believe an extremely volatile price move will happen in February through April 2020” and the following price predictions.

The ADL predictive modeling system provided us with a hint that volatility would skyrocket throughout this time in Crude Oil. And, as we all know, this next Daily Crude Oil chart highlights the incredible collapse from early January 2020 (near $65.00) to levels just below $50 in early February. After that, the high price level was near $54.50 and the current low price level is $27.34. We believe this downward price rotation in Crude Oil completely validates our earlier ADL predictive analysis.


Imagine having this type of forecast for our trading and investing! Be sure to opt-in to our free market trend signals newsletter before closing this page so you don’t miss our next special report!

What's Next With The Price of Crude Oil?

Based on short term Fibonacci price momentum targets we could see fall as low as $17 per barrel, but this price target will change dramatically over the next few days depending on if oil bounces higher from here it is now.


If our research is correct, Crude oil may find a bottom somewhere near $17 to $24, the potential rally back up to somewhere above $37 - $41 ppb before staging another massive selloff. The massive volatility suggested by the ADL system also suggests a broad price range over the next 60+ days.

Thus, we believe crude oil will attempt to form a bottom below $30, then attempt a brief rally to “fill the gap” (or partially fill the gap). After that, supply side economics will take over and crude oil should begin to move back towards the to $30 price level again – just as our ADL predictive modeling system suggested.

As of today, we are getting dozens of emails asking about what we see for the US major markets and global markets with our systems. Everyone wants to know “what’s next?”. Most of that research is delivered to our active subscribers/members and you can gain access to that information simply by visiting my website. You really don’t want to miss these next huge moves.

As a technical analysis and trader since 1997, I have been through a few bull/bear market cycles. I believe I have a good pulse on the market and timing key turning points for short term swing traders.

Visit my ETF Wealth Building Newsletter and if you like what I offer, and ride my coattails as I navigate these financial markets and build wealth while others lose nearly everything they own during the next financial crisis.

Chris Vermeulen
The Technical Traders


Stock & ETF Trading Signals

Sunday, January 19, 2020

Energy Continues Basing Setup - Next Breakout Expected Near January 24th

After watching crude oil fall from the $65 ppb level to the $58 ppb level (-10.7%) over the past few weeks, we still believe the energy sector is setting up for another great trade for skilled investors/traders.

We are all keenly aware that winter is still here and that heating oil demands may continue to push certain energy prices higher. Yet winter is also a time when people don’t travel as much and, overall, energy prices tend to weaken throughout Winter.

Over the past 37 years, the historical monthly breakdown for crude oil is as follows....

December: Generally lower by -$0.33 to -$0.86. Averages to the downside: -3.65 to +3.08
January: Generally lower by -$4.57 to -$6.72. Averages to the downside: -2.68 to +2.27
February: Generally higher by +$8.41 to +13.73. Averages to the upside +3.07 to -2.54
March: Generally higher by +7.33 to +$15.62. Averages to the upside by +2.84 to -2.14

Over the past 25 years, the historical monthly breakdown for natural gas is as follows....

December: Generally lower by -$2.34 to -$5.26. Averages to the downside: -0.81 to +0.69
January: Generally lower by -$5.14 to -$7.97. Averages to the downside: -0.69 to +0.45
February: Generally lower by -$1.48 to -$3.62. Averages to the downside -0.50 to +0.49
March: Generally higher by +0.63 to +$1.88. Averages to the upside by +0.41 to -0.70

Over the past 35 years, the historical monthly breakdown for heating oil is as follows....

December: Generally lower by -$0.16 to -$0.37. Averages to the downside: -0.14 to +0.09
January: Generally lower by -$0.52 to -$0.96. Averages to the downside: -0.09 to +0.10
February: Generally higher by +$0.48 to +$1.06. Averages to the upside +0.11 to -0.08
March: Generally higher by +0.03 to +$0.11. Averages to the upside by +0.09 to -0.10

This data suggests an extended winter in the U.S. may prompt further contraction in certain segments of the energy sector that may prompt an exaggerated downside price move in crude oil and natural gas. heating oil may rise a bit if the cold weather continues well past March/April 2019.

Conversely, if an early spring sets up in the U.S., then crude oil may begin to base a bit as people begin to traveling more, but heating oil and natural gas may decline as cold weather demands abate.

Heating oil has almost mirrored crude oil in price action recently. Our modeling systems are suggesting that crude oil may attempt to move below $40 ppb. This move would be a result of a number of factors – mostly slowing global demand and a shift to electric vehicles. We authored this research post early in January 2020 – please review it.

January 8, 2020: Is The Energy Sector Setting Up Another Great Entry?

We believe any price level below $40 in ERY is setting up for a very strong basing level going forward. We have identified two “pullback zones”. The first is what we call the “Deep Pullback Zone”. The second is what we call the “Deeper Pullback Zone”. Any upside price move from below $40 to recent upside target levels (above $50) would represent a 25%+ price rotation.


Historically, February is a very strong month for ERY. The data going back over the past 12 years suggests February produces substantially higher upside price gains (+1899.30 to -394.28) – translating into a 4.8:1 upside price ratio over 12 years. Both January and March reflect overall price weakness in ERY over the past 12 years. Thus, the real opportunity is the setup of the “February price advance”.

We believe any opportunity to take advantage of this historical technical price pattern is advantageous for skilled traders/investors.


This is a pure technical pattern based on price bar data mining. This is something you may not have ever considered unless you had the tools to search for historical price anomalies and rotation patterns. We have created a suite of tools and price modeling systems we use to help our members find incredible opportunities – this being one of them.

Get ready, February will likely prompt a very nice rally in ERY if historical price triggers confirm future price activity. The price pattern in February suggests a large upside price move is likely in ERY and we believe these low price basing patterns are an excellent opportunity for skilled traders.

Join my Wealth Building Newsletter if you like what you read here and ride my coattails as I navigate these financial markets and build wealth while others lose nearly everything they own.

Chris Vermeulen
The Technical Traders


Stock & ETF Trading Signals

Saturday, December 14, 2019

Seven Year Cycles Can Be Powerful and Gold Just Started One

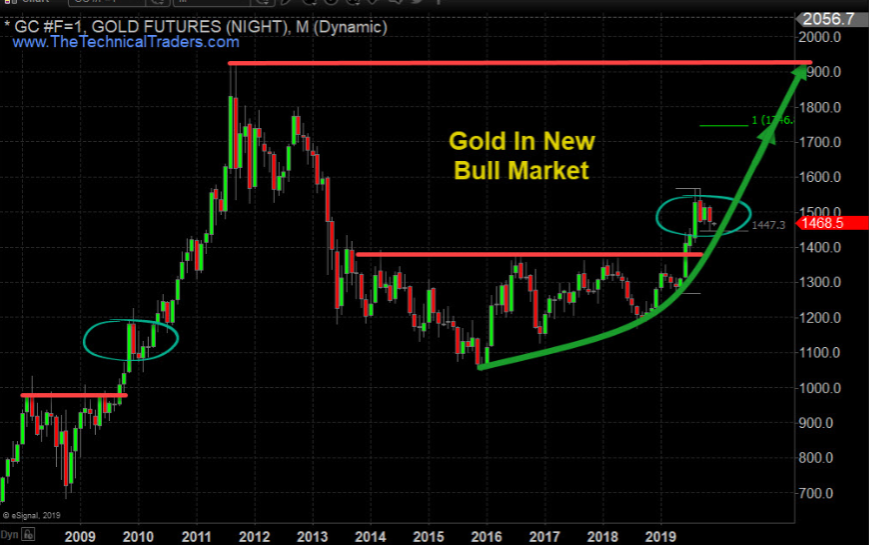
Our research and predictive modeling systems have nailed Gold over the past 15+ months. We expected Gold to rally above $1750 before the end of this year, but the global trade wars and news cycles stalled the rally in Gold over the past 2 months. Now, it appears Gold is poised for another rally pushing much higher.

But wait, if you’re thinking I’m just another one of those traders who is always bullish on gold, just know I have been telling the truth about where gold was headed (lower) for years, but finally, the tide has changed!

Gold broke down from a bull market in 2012/2013 – nearly 7 years ago. Now, Gold has broken resistance near $1375 and is technically in a full fledged Bull Market. The importance of this is the seven year cycle and how the rotation in Gold, between the high near $1923 and the low near $1045 represent an $878 price range. The upside (expansion) rally in Gold may very well move in expanding Fibonacci price structures – just like it did in 2005 through 2012. If this is the case, then we may expect to see an ultimate peak price in Gold well above $3500.

The rally that started in the last 2015 and ended in July 2016 totaled +$331.1 (+31.67%). The next price rally that started in August 2018 and ended in September 2019 totaled +$399.4 (+34.22%). If we take the current rally range (399.4) and divide it by the previous rally range (331.1), we end up with an expansion range of 121%. The two unique rallies that happened just before the 2009 parabolic rally in Gold represented (+315.8: 2006) and (394.8: 2008). The ratio of these two rallies is 125%. Could Gold have already set up for another parabolic rally well beyond the $1923 target level?

Before finding out what is next quickly join our free trend signals email list.

Monthly Price of Gold Chart – Bull and Bear Market Trends


Our research team believes Gold has already entered a technically valid Bullish Market trend. We believe Gold miners will follow higher as Gold begins this next move higher. The reason we have not engaged in Miners, yet, is because we have not received any technically valid signals related to the Gold miners indicating they have also entered a new Bullish Market trend.

Gold is the safe haven for the global market. It is a store of value and offers price appreciation when the global market risks are excessive. Because of this, the sentiment across the global markets appears to be weakening in regards to forward expectations and valuation appreciation within the investment/asset classes. If Gold continues to rally higher, consider it a strong indicator that the foundation of the global market valuation levels is weakening considerably.

U.S. Dollar Will Start to Support Higher Gold Prices


Should the U.S. Dollar retrace lower, Gold will see a price increase based on the renewed weakness of the U.S. Dollar. This would also assist in re-balancing global trade and economic issues with the US Dollar moving moderately lower as weakening global markets contract.

Gold Mining Stocks – Monthly Chart


Miners are set up much like Gold was in early 2018. Resistance has been set up with multiple price tops and any momentum rally above this level would technically qualify as a new Bullish Market trend for miners.

At this point, we believe the bottom in miners has already formed and we are simply waiting for the qualifying technical confirmation of the bullish trend to begin. Jumping into this trade too early could result in unwanted risks as the price could still waffle around within the Stage 1 Base range.

If you want to learn more about market stage analysis I will be covering it a new article shortly. Once you grasp the basic concept you will see these stages on every chart no matter the time frame and know when to focus on trading and when to ignore the charts.

If you like new fresh big trend trades then check out this real estate article I just posted and how the real estate ETF could allow your to profit from home prices but you don’t even need to own or buy a home!

Concluding Thoughts

The recent weakness in the US and global markets has prompted a moderately solid upside move in Gold and Silver over the past few days. We still need to see a Gold move above recent resistance to qualify as a new upside rally though. Miners are set up for a breakout technical move which we must also wait for. We believe these two may move somewhat in unison if the global markets continue to contract throughout the end of 2019 and into 2020.

Stay tuned for more updates and alerts when all these key sectors and asset classes start new trends because that is when you want to get involved for immediate oversized gains. See my stock, index, and commodity trade alerts here.

Chris Vermeulen
The Technical Traders


Stock & ETF Trading Signals

Friday, November 8, 2019

Where is the Top for Natural Gas?

We wrote a very telling research article on October 24th, 2019. We never published it because we had other articles scheduled to be published over the next few weeks in the queue and because our subscribers get our trade alerts before the general public. At this point, we are sharing that past article as well as some current research for Natural Gas that should be very interesting to you.

Pay very close attention to the original October 24th article, below, and our prediction that the $2.75 to $2.85 level would be a likely target for the upside price rally from the basing level below $2.30. Currently, Natural Gas is trading at $2.87 – reaching our initial target level.

If our research is correct, strong demand and limited supply globally may push Natural Gas well above the $3.20 to $3.40 level after a very brief pause happens near $3.00. In fact, Natural Gas may be getting ready to rally past 2018 highs ($4.93) if the situation presents itself for such an incredible price rally. What would it take for a rally like that to happen? Much stronger demand for natural gas because of an early, extreme winter and extended global demand.

Price reacts to supply/demand imbalances. In this case, if the demand far exceeds the supply capacities headed into the end of 2019, we could easily see Natural Gas rally above $4.00 very quickly. Could it rally even higher and take out the $5.00 level? Absolutely it could if the proper dynamics continue related to supply and demand globally.

Current Daily Natural Gas Chart


Remember to read the link from October 5th. We’ve been warning of this move for more than 60+ days and have authored multiple research posts attempting to keep our followers aware of this setup. This trade setup was telegraphed for us many months ago. All you had to do was follow our research and stay aware of the trends as this momentum base setup in October near $2.25.

Natural Gas moved higher by nearly 2% on October 24th as our researchers predicted nearly a month ago. This incredible momentum base below $2.30 seems to be a very strong support level for Natural Gas. We believe this next rally may be bigger than the last rally which reached a high near 2.70. Our Fibonacci price modeling system is suggesting a target price of $2.95 to confirm a new upside price trend. This means the price would have to rally more than +26.5% from current levels to confirm a potentially much bigger upside price move. Can you imagine seeing Natural Gas climb to above $4.50 again – like last year?

Near the end of October 2018, Natural Gas began an upside price move that really excited investors. The first upside price leg began in mid-September, near $2.75 and rallied to a level near $3.35 – a +21.6% upside price move. After a brief 12 to 15 day pause, another price rally began in early November 2018 near $3.23 and continued very aggressively over the next 11+ days to rally up to $4.93 – a +57% rally.

We issued a natural gas trade using UGAZ to members and this week we locked in 38.7% profit on a portion of our position and there is still a lot of upside potential left.

Is the same type of price advance could be setting up for an early November price rally from the $2.30 level to somewhere above $3.50? This would result in a +50% price rally from recent lows without using any leverage which would be just amazing.

October 5, 2019: Natural Gas Reloads for Another Price Rally

Previous Natural Gas Forecast Daily Chart

Our proprietary Fibonacci price modeling system is suggesting the $2.95 price level is critical for any further upside price action to continue above $3.00. The price must cross above the $2.95 level on a strong closing price basis before we could consider any higher price levels to become valid. Our researchers believe that suggests the $2.75 to $2.85 level becomes a very real upside price target for skilled traders to pull some profits and protect any open long positions.


Previous Natural Gas Forecast Weekly Chart

This Weekly Natural Gas chart highlights our Fibonacci price modeling system’s results and the Bullish Trigger Level near $2.95 (The GREEN LINE). Pay very close attention to how quickly Natural Gas moved higher in November 2018. If another move happens like that in 2019, we could be setting up for a big gap higher followed by about 10 to 15+ days of incredible upside price action.


Currently, the price of Natural Gas has crossed the Daily Fibonacci price modeling system’s Bullish Price Trigger level near $2.29. This suggests that we are now in a confirmed bullish trend as long as the price stays above the $2.26 level on a closing price basis. We would expect a continued moderate price rally from these levels to move price away from the momentum base level over time – before any breakout upside price move may begin.

This could become one of the best trades, besides Silver and Gold, headed into the end of 2019. Get ready for some big volatility in Natural Gas as winter weather takes over much of North America.

November will be the month of breakouts and breakdowns and should spark some trades. I feel the safe havens like bonds and metals will be turning a corner and starting to firm up and head higher but they may not start a big rally for several weeks or months.

October was a boring month for most major asset classes completing their consolidation phase. Natural gas was the big mover in October and subscribers and I took full advantage of the bottom and breakout for a 15-22% gain and its till on fire and trading higher by another 3% this week already.

If you like to catch assets starting new trends and trade 1x, 2x and 3x ETF’s the be sure to join my premium trade alert service called the Wealth Building Newsletter.


Chris Vermeulen
The Technical Traders


Stock & ETF Trading Signals

Monday, July 29, 2019

Energy Sets Up Two New Trades - Here They Are

Before we discuss these incredible trade setups in the Energy sector, we have to discuss the continued shifting global economy and how that relates to these setups. Nearly three weeks ago, we posted a research article suggesting Crude Oil would call to levels near $50 over the next 30+ days, then stall for about 45 days before falling further and potentially attempting new lows near $40 ppb. It is important to understand certain aspects of the global economy, economic demand and how it relates to seasonal patterns for Energy.

We believe the move lower is Crude Oil is related to a supply glut that continues to plague the global markets while global economic trade, shipping, and activity continue to weaken. Too much oil supply with weakening global economic activity means Crude Oil will likely waffle lower until this dynamic changes.

Please read our recent research post to know where Crude Oil is likely to head next. Also this crude oil, prediction uses our oil price DNA algorithm to show us the future price range of oil.

Other energy related symbols, like Natural Gas and ERY, are set up for a different type of price move.

The reality of the situation is that once Crude Oil reaches to levels near $50 ppb, it is very likely that a support level will push Crude back higher (as we suggest in our research) which will align with a seasonal pattern for Natural Gas and early Winter demand for heating oil. September, October, and November are typically a ramp up period for winter demand and end of year holiday travel. People tend to take advantage of the last bit of Summer to seek out vacation spots, prepare for winter and push the cold back as long as possible.

Future contracts may move higher, in preparation of this seasonal trend, many months before the season actually starts. This is the reason we believe the energy sector is setting up some incredible opportunities for skilled technical traders.

The Weekly Chart of Natural Gas 

This first Weekly chart of Natural Gas highlights a basing pattern that we’ve been following for months. We believe any move below $2.30 is a strong bottoming/basing setup for skilled traders and our predictive modeling systems suggest we are just weeks (3 to 5+) away from a big upside move in NG.

We believe natural gas will continue to fall and base. Once a bottom has been made the upside potential for NG over the next 60+ days is quite substantial. We believe an in initial upside move after it bottoms will be to levels above $3.15 will take place before October 10 and that potential for an extreme breakout upside move above $4.00 is quite likely before the end of November 2019.

Please read this article to learn more about our research into NG and the opportunities that are setting up now. Also, this post we shared Natural Gas Moves Into Basing Zone.


ERY – Bear Energy Sector Chart

Keeping in mind that the setup within the energy sector is two fold. First, Oil and NG will continue to fall and base/bottom (moving slightly lower over the next few weeks). This is why ERY is such a great setup right now. Any breakdown in energy commodity prices over the next 3-5 weeks will push ERY 15% to 25% higher from current levels – which is exactly what we are expecting to happen.

Then, as Crude Oil and Natural Gas base in their support zones, ERY will peak which is when we want to pull profits from ERY and watch other bullish energy ETFs for long side setups.

From current levels, we believe ERY will target $50 to $52.50 fairly quickly as Crude Oil and NG continue to move lower and setup a momentum base within the basing zone/support range. Remember Crude Oil should move to levels near $50 (a full 10% lower than current price levels) before basing.


Concluding Thoughts

As we’ve been suggesting for months, 2019 and 2020 are setting up to be incredible years for skilled technical traders. These moves in commodities, energy, and metals are providing us with trade after trade of 10%, 20% or more. Almost every month, the markets are setting up 10 to 15+ incredible trading opportunities and all we have to do is time our entries and run these trades as we do any other trade. Not all trade setups are the kind we like and we only enter the ones that we think have the highest opportunity and lowest risk.

Get ready because these incredible setups in Metals and Energy should keep you busy pulling the trigger to create profits over the next 5+ months or longer with my Wealth Building & Global Financial Reset Newsletter.

Join me with a 1 or 2 year subscription to lock in the lowest rate possible and ride my coattails as I navigate these financial market and build wealth while others lose nearly everything they own during the next financial crisis.

Join Now and Get a 1oz Silver Round or Gold Bar Shipped To You Free. Follow our research and visit The Technical Traders to learn how we can help you find and execute better trades.

Chris Vermeulen
The Technical Traders


Stock & ETF Trading Signals

Friday, May 24, 2019

Eye Opening Dollar and Currency Charts

The incredible strength of the U.S. Dollar over the past 12+ months has put downward pricing pressure on Gold and Silver. I believe this downward pricing pressure could be muting any upside price advanced in Gold and Silver by as much as 20% to 30% or more.

The U.S. Dollar has turned into the global “safe haven” for international investors and foreign governments. Over the past 6 to 12 months, or more, the U.S. Dollar has been the only fiat currency to see any strength and upward trend. All the other major global currency levels have fallen – some dramatically lower.

The EUR, GBP, AUD, CAD, and CHF have all fallen sharply over the past 6 to 12 months as the strength of the US Dollar and US Economy continued to surprise many. We’ve been calling this a “capital shift” that started back in 2015~2016 – when the 2016 US Election cycle began and China began to implement capital controls. At the same time, foreign nations such as Brazil and Venezuela began to shift into an economic abyss while the UK dealt with BREXIT negotiations. All of these external factors created an environment where the U.S. Dollar became a global safe haven for global investors – all of which were seeking U.S. equities and U.S. Dollars to hedge weakening foreign currencies and weak foreign stock market performance.


I think that the US Dollar strength, in combination with the continued foreign Gold acquisitions has amounted to a resolved “reversion” in Gold prices that could reflect a 10% to 20% price anomaly. In other words, the strength of the US Dollar has muted the advancing price of Gold by our estimates of 2x to 2.5x the strength of the US Dollar. Over the past 12 months, the US Dollar rallied from 89.42 (April 2018) to 97.92 (May 2019: current price). This reflects a 9.60% increase in the value of the US Dollar.

If my research is correct, the price of Gold should have rallied by about 18% to 26% from the April 2018 levels IF the US Dollar had not appreciated in value as it has. Therefore, the true price of Gold should be somewhere near $1600 (18% above April 2018 levels) to $1700 (26% above April 2018 levels) if we attempted to eliminate the “reversion effect” of the US Dollar strength.

We come to this conclusion by statistically analyzing the US Dollar strength after April 2018 and how Gold reacted to this strength – by falling over 12.5% from near $1350 to a level near $1170. That range of time reflected an 8% price advance in the U.S. Dollar. Thus, a ratio of 1.5 to 1 has clearly been established within that move. More recently, from August 2018 till now, the US Dollar has rallied 1.47% while the price of Gold has rallied 8.87%. The current price of Gold is -5.60% below the April 2018 price level.

If we were to assume that the rally in the U.S. Dollar deflated the price appreciation of Gold by nearly equal ratios, then we take the April 2018 price of Gold ($1350) and add the related price variances of Gold over this span (essentially reverting the price of Gold to April 2018 U.S. Dollar levels : $1350 * 1.27) and we end up with $1714.50. This reflects a greater than 30% price anomaly from the current price of Gold.


Gold Futures 

We need to ask ourselves one simple question, what would it take for Precious Metals and the global stock markets to revert back to these expected price levels? Would it be a move away from the U.S. Dollar? Would it be some shift in foreign currency valuations? Would it be a combination of factors that drive greater fear into the markets and reflect a U.S. Dollar valuation decline? In the second part of this article, I will explore some possibilities and explain why I believe we are just days or weeks away from finding out exactly what will cause this price anomaly to revert along with my proprietary gold price cycle forecast.

I just highlighted the strength of the U.S. Dollar in comparison to other foreign currencies and suggested this U.S. Dollar strength may have created a “price anomaly” setup in Precious Metals – specifically Gold. I believe a very unique setup is happening in the global markets right now and that the price of Gold is substantially undervalued compared to risks that are present throughout the global economies. I believe the strength of the U.S. Dollar has muted the upside potential of Gold by at least 20% to 30% over the past 12+ months and I believe a shift is taking place where Gold is starting to break these pricing constraints.

If the analysis is correct, I believe traders only have about 3~6+ weeks before we’ll find out why and what will cause this price anomaly to revert back to what I believe is “price normalcy”. The strength of the US Dollar, as well as the continued global “capital shift” where foreign investors are piling into the US stock market and US Dollar related investments, have continued to put incredible pricing pressures on Precious Metals. We believe this “shift” may be about to revert back to some levels of normalcy in term of Precious Metals pricing.

I believe a major Pennant/Flag formation is setting up in Gold where this price anomaly event will be resolved. This type of price anomaly reset, or reversion will prompt a massive upside price advance in Gold and Silver that will attempt to restore proper pricing levels to the Precious Metals commodities. I believe we are just weeks away from the completion of this Pennant/Flag apex/breakout event and believe the upside price targets identified align with a series of key events that are likely to unfold over the Summer months of 2019. Take a few minutes to read the recent three-part research post regarding these events and how they relate to the global stock/commodity markets here.


Our predictive modeling systems have been warning that a price advance in Gold and Silver will take place between April/May of 2019 and Aug/Sept or 2019. We are calling this the “initial upside price leg” because we believe this upside price move will be just the beginning of a much larger move higher for Precious Metals. We’ve highlighted some of the biggest concerns we currently have related to the global stock market price appreciation levels and the concerns related to the US Presidential Election cycle in precious articles – Please read them here :


We believe it is imperative to alert all investors/traders of this event and to attempt to allow all investors/traders to plan for what may become one of the biggest global stock market swings in recent history as well as one of the biggest moves in Precious Metals in history.

My proprietary cycle analysis and trade signals are suggesting a mild price recovery in Gold will prompt moderate upside pricing pressure over the next 10-20+ days. This aligns perfectly with our Pennant/Flag formation, see the previous chart. It would be expected that Gold prices would form a moderate price support level near $1270 before moving back up to the upper Pennant price channel, near $1295. Then, price should set up the “Apex Breakout” move – which will likely be a “washout-low” price rotation (somewhere near or below $1270) with a very quick reversal to the upside – breaking $1330 and rallying much higher. This type of rotation is very common and often prompts traders to jump into short positions on the “washout-low” formation before getting clobbered on the reversal/rally. Be prepared.


Lastly, we want to alert everyone to a chart we’ve been following that could become a determining factor for the future of the global stock market levels, the U.S. Dollar and Precious Metals. The one thing we don’t want to see is a massive decline in yield in the 2 Year Treasuries. This would indicate failed growth expectations throughout the globe and, in particular, reflect concerns that the US markets could contract/decline in line with further global market devaluations.

We’ve already been trying to warn investors that the U.S. Presidential Election cycle will likely create a stalling price pattern in the US stock market. We’ve been warning, for the past 18 months, that Gold is setting up a massive bottom/breakout formation. We’ve recently highlighted the global concerns (Europe, China, US, and others) that may combine to create something like a “perfect storm” for currencies and the global equities markets. If that translates into “yield weakness” in the US Treasuries, think about how that would translate into the Precious Metals “reversion” that we are suggesting is only a few weeks away?


We strongly urge investors to pay very close attention to our research and prepare for this event. Yes, the Capital Shift event is still taking place and as long as nothing disrupts this shift, capital will continue to flow into the U.S. Dollar and U.S. Equities. Our concern is that the charts are telling us we are very near to the end of this event cycle and we are alerting all of our followers so they can prepare for this move. It may start out mildly – it may not. We do know that our predictive modeling systems are suggesting that July/August 2019 are on our radar for a major price rotation/event.

UNIQUE OPPORTUNITY

First, we typically see stocks sell off and as the old saying goes, “Sell in May and Go Away!” which is what has been happening.

So what does this mean? It means we should start to see money flow into the safe-haven assets like the Utility sector, bonds, and most importantly precious metals. I anticipated this and our XLU utilities ETF taken with members has already hit our first profit target, and our VIX ETF trade also hit out 15% profit target and we the balance of it is still up 25% as of yesterday.

Second, my birthday was this month, and I think it's time I open the doors for a once a year opportunity for everyone to get a gift that could have some considerable value in the future.

For May I am going to give away and ship out silver rounds to anyone who buys a 1-year, or 2-year subscription to my Wealth Trading Newsletter. You can upgrade to this longer term subscription or if you are new, join one of these two plans listed below, and you will receive:

(Could be worth hundreds of dollars)

2-Year Subscription Gets TWO 1oz Silver Rounds FREE 
(Could be worth a lot in the future)

I only have a limited number of silver rounds I’m giving away ​​​​​​​so 
upgrade or join now before it's too late!


Happy May Everyone!
Chris Vermeulen


Stock & ETF Trading Signals

Tuesday, April 9, 2019

Crude Oil Nearing Resistance - Could a New Top Form Here?

The recent recovery in Crude Oil has, partially, been based on increasing expectations of a global economic recovery taking place and the continued news that the US/China will work out a trade deal. Crude inventories. Just last week U.S. Crude Oil inventories came in at +7.2 million barrels vs. expectations of -425,000 barrels. Additionally, concerns in Syria and Libya are pushing prices a bit higher as well. Whenever there are supply concerns or uncertainty out of this region, prices tend to rise.

The facts remain very dynamic for Oil. The U.S. is continuing to produce more and more oil and is expected to become a “net exporter” of oil this year. Economic issues will, eventually, resolve themselves, yet we don’t know the final outcome of these trade deals or how the economy will react to any milestones that are required within the final settlement. And, again, these continuing issues in Libya, Syria and near this region are likely to cause some increased levels of uncertainty over the next 60+ days.

Our researchers, at The Technical Traders, believe the $65.00 level will act as resistance to this current upswing. We believe the upside price move may continue to levels near $67.50 before weakening and beginning a topping formation. We believe our expectation that precious metals will bottom near April 21~24 is key to understanding the dynamics of this move in oil. As long as FEAR does not enter the market, then Oil will likely react to impulse factors exclusively related to oil. Once Gold breaks out above $1500 per ounce, our belief is that oil will react to fear factors related to some broader economic event driving investors into precious metals.

Therefore, we are urging traders to be cautious of the upside price swing in Oil at the moment. Yes, we believe the upside will continue for at least another 10~15 days (possibly changing direction near April 21~24). Yes, we believe current global dynamics support moderately higher Oil prices. Yet, we feel these factors may change within the next 20~45 days as we believe some increased fear levels are about to hit the global markets.


At this point, we would urge Bullish Oil traders to start to become more cautious of any downside risks and begin to prepare for increased volatility. We don’t have any real clue as to how this move will setup, but we do believe our other research support increased volatility within the Crude Oil markets and the potential for a new downside price swing before any further upside move sets up.

Please take a minute to review this research post from January 31, 2019 > Learning From our SP500, Gold and Oil Research & Profit.

We’ve recently launched a new technology solution for our members that delivers our incredible research and trading solutions. You can also visit The Technical Traders Free Research to learn more about our research team and past article. 20129 is going to continue to be an incredible year for skilled traders – you won’t want to miss these big moves that are setting up.

Chris Vermeulen


Stock & ETF Trading Signals

Friday, January 18, 2019

Crude Oil Will Find Strong Resistance Between $52 - $55

Our Adaptive Fibonacci modeling system is suggesting Crude Oil may have already reached very strong resistance levels just above $50 ppb. It is our opinion that a failed rally above $55 ppb will result in another downward price move where prices could retest the $42 low – or lower.

You can see from this Daily Crude oil chart that price has formed a consolidated price channel between $50 and $53 ppb. This price channel aligns with a November 2018 price consolidation zone. It is our belief that any advance above $55-56 ppb, will result in a new upward price move to $64-65 ppb.


This Weekly crude oil chart highlights the Fibonacci projected price zones that represent the incredibly strong resistance level currently setup in Crude. The Weekly chart shows a zone between $50-56 as a critical resistance zone. One key element of Fibonacci price theory is that price must always attempt to seek out new highs or new lows as it rotates. Thus, if this current upside move fails to establish new highs above this resistance zone, then it must move lower to attempt to establish new lows. This means the $40 price target is a very viable immediate objective.


Global demand for oil, as well as global economic data, could be key to understand the future demand and price for oil. At this point, a new upper fractal top formation will generate new Fibonacci price targets to the downside. If our opinion proves to be correct, we will learn of these new price targets within a few weeks.

Want to learn how we called the move in Oil from $76 to $43?

Visit The Technical Traders Free Research Right Here to read all of our recent research posts.

We help traders find and execute better trade by using our proprietary tools to keep them informed and to alert them to new trade opportunities. Visit The Technical Traders to learn how we can help you make 2019 a fantastic year.

Chris Vermeulen


Stock & ETF Trading Signals


Monday, January 14, 2019

How We Will Play this Potentially Massive Short Squeeze in Natural Gas

Our proprietary Fibonacci predictive modeling system is suggesting Natural Gas is about to break down below the $4.30 level and move aggressively toward the $3.05 - 3.25 level. This could be an incredible move for energy traders and a complete bust for existing longs.

This Weekly Natural Gas chart is showing our Fibonacci Predictive modeling system and highlighting the lower support price targets just above $3.00. We believe price weakness will break the $4.30 level very quickly and drive prices well below the $3.40 level – very likely towards support near $3.25 over the next few weeks.


Our Advanced Adaptive Dynamic Learning predictive price modeling system is showing similar results. It suggests a major price anomaly is setting up in Natural Gas that will prompt a massive downside price move over the next 2 - 3 weeks before an equally incredible price recovery takes place. The total of this predicted price swing is nearly $2.00 ($1.00 down and then $0.85 back to the upside). If this move takes place as our modeling systems are suggesting, this will drive a massive “washout move” pushing the long traders out of their positions on the way down and then pushing a massive short squeeze on the way back up to near $4.00.


This is the type of price swing that makes for incredible success stories if traders can play this move properly. Pay attention to the fact that the lower predicted levels of our ADL system (shown near $3.20) may not be reached in this downward price swing. Our predictive modeling system is suggesting these are the highest probability price outcome based on its internal price and technical analysis. Still, when one takes a good hard look at this chart, it is easy to see the “price anomaly” setup where the current price of Natural Gas is nearly $0.80 above the currently predicted price levels (shown as YELLOW DASHES) and how the ADL Predictive modeling system is suggesting a big downward move is about to unfold.

Want to keep receiving incredible trade setups like this one and learn how our research team and specialized price modeling systems can help you find and execute better trades? Then please visit Technical Traders Ltd. to learn more about our services and tools. We have been helping traders find and execute better educated trading decisions with our specialized tools and research for years. Visit The Technical Traders Free Research to read all of our most recent public research posts and to see how we’ve been calling these market moves over the past few months.

Chris Vermeulen


Stock & ETF Trading Signals


Monday, January 7, 2019

Natural Gas Trades Through Our $3.20 Target – What Next?

Our trading partner Chris Vermeulen and his research team at the Technical Traders have been nailing the market moves with their proprietary price modeling tools. Our December 12, 2018 call that Natural Gas would collapse nearly 30% after reaching a price peak was a very bold call. Who would have thought that predictive price modeling could be so accurate and could identify a move like this – or call for what is expected to happen next?

Back when Natural Gas breached the $4.60 - 4.80 range, our ADL predictive modeling system was suggesting a massive price anomaly was setting up. These types of triggers are becoming more common as volatility in the general markets increases. The ADL system suggested that a massive -30% downside price move would happen before the end of February 2019.

Now, as that trade has completed and our targets have been reached, we are alerting our followers that natural gas should begin to consolidate between $2.80 and $3.30 before attempting to rocket back above $4.00 near April or May 2019. Read our original analysis of Natural Gas to learn why these moves provide an incredible opportunity for traders and visit The Technical Traders Free Research page to read up on our early 2019 market predictions.


Join our other members in making 2019 an incredibly successful year. We believe 2019 will provide exceptional opportunities for skilled traders and we’ll be happy to share our proprietary research and analysis with you as a member of Technical Traders Ltd. You really don’t want to miss these moves and this incredible opportunity. Think about it, one trade like this with a -30% selloff followed by a 24% price rally could make your entire year. Imagine being able to find trades like this every week or month for success. Visit The Technical Traders and get ready to make 2019 a fantastic year of success no matter if we have a bull market or bear market.

Chris Vermeulen


Stock & ETF Trading Signals

Thursday, December 27, 2018

Has This Selloff Reached a Bottom Yet?

Everyone wants to know if this selloff has reached a low or bottom yet and what to expect over the next 30 - 60+ days. Since October, the U.S. stock market has reacted to the U.S. Fed raising rates above 2.0% with dramatic downward price moves. The latest raise by the U.S. Fed resulted in a very clear price decline in the markets illustrating the fact that investors don’t expect the markets to recover based on the current geopolitical and economic climate.

Over 5 years ago, our research team developed a financial modeling system that attempted to model the U.S. Fed Funds Rate optimal levels given certain inputs (US GDP, US Population, U.S. Debt, and others). The effort by our team of researchers was to attempt to identify where and when the U.S. Fed should be adjusting rates and when and where the U.S. Fed would make a mistake. The basic premise of our modeling system is that as long as Fed keeps rates within our model’s optimal output parameters, the U.S. (and presumably global) economy should continue to operate without massive disruption events unless some outside event (think Europe, China or another massive economic collapse) disrupts the ability of the U.S. economy from operating efficiently. We’ve included a screen capture of the current FFR modeling results below.

This model operates on the premise that U.S. debt, population, and GDP will continue to increase at similar levels to 2004-2012. We can see that our model predicted that the U.S. Fed should have begun raising rates in 2013-2014 and continued to push rates above 1.25% before the end of 2015. Then, the U.S. Fed should have raised rates gradually to near 2.0% by 2017-2018 – never breaching the 2.1250% level. Our model expects the U.S. Fed to decrease rates to near 1.4 - 1.5% in early 2019 and for rates to rotate between 1.25%~2.0% between now and 2020. Eventually, after 2021, our model expects the US Fed to begin to normalize rates near 1.5-1.75% for an extended period of time.


Additionally, our Custom Market Cap index has reached a very low level (historically extremely low) and is likely to result in a major price bottom formation or, at least, a pause in this downward price move that may result in some renewed forward optimism going forward. Although we would like to be able to announce that the market has reached a major price bottom and that we are “calling a bottom” in this move, we simply can’t call this as a bottom yet. We have to wait to see if and when the markets confirm a price bottom before we can’t attempt any real call in the markets. You can see from our Custom Market Cap Index that the index level is very near historically low levels (below $4.00 – near the RED line) and that these levels have resulted in major price low points historically. We are expecting the price to pause over the next week or so near these $3.50 levels and attempt to set up a rotational support level before attempting another price swing. As of right now, we believe there is fairly strong opportunity for a price bottom to set up, yet these are still very early indicators of a major price bottom and we can’t actually call a bottom yet. If our Custom Market Cap Index does as it has in the past, then we are very close to a bottom formation in the US markets and traders would be wise to wait for technical confirmation of this bottom before jumping into any aggressive long trades.


Lastly, our Custom Global Market Cap Index has also reached levels near the lower deviation channel range over the past 7+ years, which adds further confidence that a potential price bottom may be near to forming in the US markets. As we can see from the chart below, the recent selloff has pushed our Global Market Cap Index to very low levels – from near $198 to near $144; a -27.55% total price decline. Nearing these low levels, we should expect the global markets to attempt to find some support and to potentially hammer out a bottom, yet we are still cautious that this downward price move could breach existing support levels and push even further in to bear market territory.


There are early warning signs that the market may be attempting to form a market bottom and our research team is scanning every available tool we have at out disposal to attempt to assist all of our members and followers. We alerted you to this move back on September 17, 2018 with our ADL predictive modeling system call for a -5 - 8%+ market correction. Little did we know that the U.S. Fed would blow the bottom out of the markets with their push to raise rates above the 2.0% level.

As the U.S. Fed has already breached our Fed Modeling Systems suggested rate levels, the global markets will be attempting to identify key price support in relation to this new pricing pressure and the expectations that debt/credit issues will become more pronounced as rates push higher. In other words, the global markets are attempting to price in the renewed uncertainty that relates to the U.S. Fed pushing rates beyond optimal levels. We expect the markets are close to finding true support near the levels we’ve shown on our Custom Index charts, yet we still need confirmation before we can call it a bottom.

We will continue to update you with our research and analysis as this move plays out and we hope you were able to follow our analysis regarding the Metals, Oil, Energy and other sectors that called many of these massive price swings. We pride ourselves on our analysis and ability to use our proprietary tools to find and execute successful trades for our members. Our ADL predictive price modeling system is still suggesting an upward price move is in the works for the U.S. markets and we are waiting for our “ultimate low price” level to be reached before we expect an upside leg to drive prices higher again. Based on our current research, we may be nearing the point where the markets attempt to hammer out a price bottom – yet time will tell if this is the correct analysis.

Please take a minute to visit The Technical Traders to learn how we help our members find and execute better trades. Recent swings in the markets have made it much more difficult for average traders to find and execute successful short term trades. Learn how we can help you find greater success and read some of our recent research posts by visiting our Free Research section of the Technical Traders.


Stock & ETF Trading Signals