One of the biggest movers over the past few months has been the recovery of the Oil/Gas/Energy sector after quite a bit of sideways/lower price trending. You can see from this XOP chart, below, a 44% upside price rally has taken place since early November, and XOP has recently rotated moderately downward – setting up another potential trade setup if this rally continues. Traders know, the trend if your friend. Another upside price swing in the XOP, above $72, would suggest this rally mode is continuing.
Recently, we published a research article suggesting a lower U.S. Dollar would prompt major sector rotations in the US and global markets where we highlighted the fact that the Materials, Industrials, Technology, and Discretionary sectors had been the hottest sectors of the past 180 days, but the Energy, Financials, Materials, and Industrials had shown the best strength over the past 90 days....Read More Here.
Showing posts with label Crude Oil. Show all posts
Tuesday, January 26, 2021
Wednesday, July 22, 2020
Energy Sets Up Near Major Resistance - Breakdown Pending
Our research team believes Crude Oil and Energy, in general, has stalled near major resistance and maybe setting up a big downside move as the COVID-19 virus continues to roil regional and global economies.
The recent news that the COVID-19 virus cases have skyrocketed suggests further economic shutdowns may push oil prices below $35 ppb over the next few weeks and months. Our researchers believe Oil has already set up a resistance level near $42 and will begin to move lower as concerns about the economic recovery transition through expectations related to oil demand going forward. We believe the renewed global economic demand for oil will present a very real possibility that oil could collapse below $35 ppb over the next 30 days.
We believe this pending downside move in Crude Oil will set up a great trade opportunity in ERY, the Direxion Bear Energy 2x ETF. At this point in time, we are just waiting for the technical confirmation of this trade trigger. Once we receive confirmation from our price modeling systems, we believe ERY may rally 20% to 30% or more from current levels....Continue Reading Here.
The recent news that the COVID-19 virus cases have skyrocketed suggests further economic shutdowns may push oil prices below $35 ppb over the next few weeks and months. Our researchers believe Oil has already set up a resistance level near $42 and will begin to move lower as concerns about the economic recovery transition through expectations related to oil demand going forward. We believe the renewed global economic demand for oil will present a very real possibility that oil could collapse below $35 ppb over the next 30 days.
We believe this pending downside move in Crude Oil will set up a great trade opportunity in ERY, the Direxion Bear Energy 2x ETF. At this point in time, we are just waiting for the technical confirmation of this trade trigger. Once we receive confirmation from our price modeling systems, we believe ERY may rally 20% to 30% or more from current levels....Continue Reading Here.
Before you continue, be sure to opt-in to our free market trend signals
so you don’t miss our next special report!
Labels:
Chris Vermeulen,
Covid-19,
Crude Oil,
energy,
ERY,
etf,
resistance,
support,
UNG,
USO
Friday, July 10, 2020
Retail Traders & Investors Squeezed to Buy High Risk Assets Again
Yes, we certainly live in interesting times. This, the last segment of our multi-part article on the current Q2 and Q3 2020 US and global economic expectations, as well as current data points, referencing very real ongoing concerns, we urge you to continue using common sense to help protect your assets and families from what we believe will be a very volatile end to 2020. If you missed the first two segments of this research article, please take a moment to review them before continuing.
On May 24th, 2020, we published this research article related to our super cycle research. It is critical that you understand what is really happening in the world as we move through these major 21 to 85+ year super-cycles and apply that knowledge to the data we have presented in the first two segments of this research post. Within that article, we quoted Ray Dalio from a recent article published related to his cycle research.
That rather chilling statement suggests one thing that we all need to be aware of at this time: what the current and future economic cycles will likely present and how the world will navigate through this process of a cycle transition....Continue Reading Here
On May 24th, 2020, we published this research article related to our super cycle research. It is critical that you understand what is really happening in the world as we move through these major 21 to 85+ year super-cycles and apply that knowledge to the data we have presented in the first two segments of this research post. Within that article, we quoted Ray Dalio from a recent article published related to his cycle research.
That rather chilling statement suggests one thing that we all need to be aware of at this time: what the current and future economic cycles will likely present and how the world will navigate through this process of a cycle transition....Continue Reading Here
Monday, April 13, 2020
We Adjusted Our Retirement Account Positions with This Major Signal Issued - Did You Get The Signal?
Our trading partner Chris Vermeulen, who are readers have followed for a while now, is loving what is happening in the markets for the last three weeks. He wants a big bounce here because it is going to set us up with a huge long-term investment position once price confirms this next entry signal.
Last week Chris issued a trade alert to members of his long-term investing newsletter. This allows you to protect your wealth and assets while continuing to take advantage of opportunities generated by the U.S and global markets over the next several months and possibly into next year. This is the first trade alert issued in 2020 of this kind, and he may have another very soon, but it's not too late to take advantage of the first signal.
If you are a trader or investor, with a retirement account of any type, or have assets in the stock market, then you need to take action and sign up to get these important investment trade signals.
We all have trading accounts, and while our trading accounts are important, what is even more important are our long-term investment and retirement accounts. Why? Because they are, in most cases, our largest store of wealth other than our homes.
If they are not protected during a time like this, you could lose another 25-50% or more of your entire net worth. The good news is we can preserve and even grow out long term capital when things get ugly like they are now and Chris shows us how.
Check It Out Here
Sincerely,
Chris Vermeulen
Founder of The Technical Traders
Last week Chris issued a trade alert to members of his long-term investing newsletter. This allows you to protect your wealth and assets while continuing to take advantage of opportunities generated by the U.S and global markets over the next several months and possibly into next year. This is the first trade alert issued in 2020 of this kind, and he may have another very soon, but it's not too late to take advantage of the first signal.
If you are a trader or investor, with a retirement account of any type, or have assets in the stock market, then you need to take action and sign up to get these important investment trade signals.
We all have trading accounts, and while our trading accounts are important, what is even more important are our long-term investment and retirement accounts. Why? Because they are, in most cases, our largest store of wealth other than our homes.
If they are not protected during a time like this, you could lose another 25-50% or more of your entire net worth. The good news is we can preserve and even grow out long term capital when things get ugly like they are now and Chris shows us how.
Check It Out Here
Sincerely,
Chris Vermeulen
Founder of The Technical Traders
Labels:
Chris Vermeulen,
Crude Oil,
Gold,
investment,
investor,
newsletter,
Silver,
The Technical Traders,
wealth
Sunday, March 29, 2020
Three Charts Every Trader and Investor Must See
Understanding the stock market and its potential through the use of technical analysis and historical price events has been proven repeatedly to outperform all forms of fundamental trading styles. The following is a story that walks you through my experience, the shift in my mindset and how I came to the conclusion that the three charts I share in this article are critical to your understanding of to make money in today’s market!
When I first learned to trade, I got all caught up with researching companies and finding the ones with the best earnings and future growth. I did that for several years after studying and following many “professional traders” who said it was the best way to trade and invest long term. We lost our shirts during the 2000 bear market by continuing to trade on fundamentals as stocks fell in value week after week. Even the companies that showed quarterly earnings growth fell in value – none of it seemed to make any sense to me, and it was very frustrating.
Losing money when buying the best companies made no logical sense, making me step back from the markets and ask myself, ‘what am I doing wrong here‘. People today are asking themselves the same question given today’s dizzying markets:
· Telsa shares fell from $971 a share down to $347, whopping 63% drop, in only a few weeks and then rebounded again too xx
· Netflix is down 30%, even though people are stuck at home desperately trying to find things to watch)
· Amazon has fallen 26% in the past couple of weeks despite soaring demand for their delivery services
· GDXJ, the gold miners sector that is typically a safe haven during times of volatility, crashed 57% even though gold is usually a safe haven during times of volatility.
So, what was I doing wrong? I started calling and visiting traders who were making money during the bear market to see what they were doing, and 100% of them were doing the same thing – Trading with Technical Analysis. I wasn’t doing anything wrong, per se. I was simply using the wrong tools and analysis for success!
What is Technical Analysis? In short, it’s the study of price, time, and volatility of any asset using price charts and indicators. Traders use technical analysis to find cycles and patterns in the market and trade on the analysis of preferred indicators as opposed to the fundamentals of a company and/or the economy in general.
When you start studying technical traders, you will notice every trader has a particular time frame, a preferred set of indicators, and trading frequency that fits their unique personality and lifestyle. Their brains can see the charts in ways you and I may not see them to predict future price direction over the next few hours, days, weeks, or months ahead. I quickly learned there are infinite ways to trade using technical analysis.
I was very surprised by how much these pro traders allowed me. While standing over their shoulders, I was looking at their charts to try to divine their high-level strategies and learn how they think, analyze, and trade. It was amazing how different each of them traded the market. Some traded currencies; others traded stocks, indexes, options, futures, etc. Most were day traders, swing traders, or a mix of the two. But none of them gave me their secret sauce. That is why I turned 100% of my focus to technical analysis. I was excited at the prospect of being able to profit from both rising and falling prices and no concern for anything other than price action reduced my research time dramatically. It was and is the biggest AH-HA moment of my life and a turning point for my career as a trader.
The year was 2001, when I made the shift to technical analysis. I unsubscribed from everything fundamental based. I canceled my CNBC, stopped listening to news, and stopped reading other people’s reports altogether. My goal was to create my own technical trading strategy that best suited my personality and lifestyle. I would have to discover the securities I was most comfortable trading, the frequency I would trade, and the type and amount of risk I was prepared to take.
I traded options, covered-calls, currencies, stocks, ETFs, and futures. From day trading to position trading (holding several months), I tried it all, hoping something would click for me to pursue at a much deeper level. Day trading, momentum, and swing trading were my sweet spots. Having three of them was a bonus as I know some traders only ever master one in their lifetime if they are lucky. I grew a liking for trading the major indexes like the DJIA, S&P 500, and Nasdaq… great liquidity with big money always at play.
Along my journey, I realized that if I could predict the overall market trend direction for the day or week, then I could day trade small cap stocks in the same direction as the index, knowing 80+% of the stocks follow the general stock market trend. I could generate much larger gains in a very short period of time. As time went on, I became comfortable predicting, trading, and profiting from the indexes, and my new trading strategy began to emerge.
I was fortunate enough to start learning about the markets and trading in college with a $2,000 E-Trade account, and then retiring (kinda) in 2009 at the age of 28. I built my dream home on the water, bought cars and boats, and spent time traveling with my growing family. I love trading and sharing my analysis with others – it is better than I had ever imagined and why I continue to help thousands of traders around the world every day with these video courses Trading System Mastery, and Trading As Your Business.
I contribute 100% of my trading success and lifestyle to the fact that I embraced technical analysis, where my strategy involves nothing more than price movement, position-sizing, and trade risk management techniques. All these allow me to easily reduce exposure, drawdowns, and losses with proper position sizing and protective strategies. If you want quick and simple, read about my journey and core trading tools in my book Technical Trading Mastery – 7 Steps to Win with Logic. My strategy is represented by human psychology and historical trading, as expressed in the three charts below.
This chart is my favorite as it explains trader and investor psychology at various market stages. It also includes a simplified market cycle in the upper right corner, letting you know where the maximum financial risk is for investors and the highest opportunity for a trade.
The chart may look a little overwhelming, but look at each part and compare it to the market psychology chart above. What happened in 2000 is what I feel is happening this year with the stock market sell-off.
In 2000, all market participants learned of at the same time was that there were no earnings coming from their darling .com stocks. Knowing they were not going to make money for a long time, everyone started selling these terrible stocks, and the market collapsed 40% very quickly.
What is similar between 2000 and 2020? Simple really. COVID-19 virus has halted a huge portion of business activity, travel, purchases, sporting events, etc. Everyone knows earnings are going to be poor, and many companies are going to go bankrupt. It is blatantly clear to everyone this is bad and will be for at least 6-12 months in corporate earnings; therefore, everyone is in a rush to sell their stock shares and are in a panic to unload them before everyone does.
As you can see, this chart below of this year’s market crash is VERY similar to that of 2000 thus far, it’s based on a similar mindset, which is the fear of losing money, which causes everyone to sell their positions.
I am hopeful that we get a 25-30% rally from these lows before the market starts to fall and continue the new bear market, which I believe we are entering. Only the price will confirm the direction and major trend to follow, and since we follow price action and do not pick tops or bottoms, all we have to do is watch, learn, and trade when price favors new low risk, high reward trade setups.
It does not matter which way the market crashes from here, we will either profit from the next leg down, or will miss/avoid it depending on if we get a tradable setup. Either cause is a win, just one makes money, while the worst case scenario just preserves capital in a cash position, you can’t complain either way if you ask me.
In short, is if you lost money during the recent market crash, then you likely have not mastered a technical trading strategy and do not have proper trade management rules in place. All traders must manage risk and trades to be sure you lock in profits and limit losses when prices start pullback or collapse. Without either of these, you will not be able to achieve long term success/gains, and that’s a fact.
While we can all make money during a bull market when stocks are rising, if you cannot retain or grow your account during market downturns, then you may as well be a passive buy and hold investors. You are better at riding the emotional investor rollercoaster without wasting your time and effort as a trader if you are not going to spend the time and money to learn to follow someone to become a successful trader. Without proven trading strategies or someone to follow, you are more likely to underperform a long term passive investor.
I get dozens of emails from people every week trying to trade this wild stock market and use leveraged ETFs, which doing so during these unprecedented market conditions is absolute craziness if you ask me.
These people think that because there are big moves in the market, they should be trading. That big money should be made trading them, which drives me crazy because it could not be further from the truth unless you are a scalp or day trader. To me, in this market condition, it’s about preserving capital, not risking it, in my opinion.
A subscriber to my market video analysis and ETF trading newsletter said it perfectly:
“Always intrigues me how many amateur surfers get to the north shore beaches in Hawaii, take one look at monster waves and conclude it’s way too dangerous. Yet the amateur trader looks at treacherous markets like these and wants to dive right in!!” Richard P.
I have to toot my own horn here a little because subscribers and I had our trading accounts close at a new high watermark for our accounts. We not only exited the equities market as it started to roll over we profited from the sell off in a very controlled way.
I hope you found this informative, and if you would like to get a pre-market video every day before the opening bell, along with my trade alerts, visit my ETF swing trading visit my website at The Technical Traders.
Chris Vermeulen
Founder of The Technical Traders

When I first learned to trade, I got all caught up with researching companies and finding the ones with the best earnings and future growth. I did that for several years after studying and following many “professional traders” who said it was the best way to trade and invest long term. We lost our shirts during the 2000 bear market by continuing to trade on fundamentals as stocks fell in value week after week. Even the companies that showed quarterly earnings growth fell in value – none of it seemed to make any sense to me, and it was very frustrating.
Losing money when buying the best companies made no logical sense, making me step back from the markets and ask myself, ‘what am I doing wrong here‘. People today are asking themselves the same question given today’s dizzying markets:
· Telsa shares fell from $971 a share down to $347, whopping 63% drop, in only a few weeks and then rebounded again too xx
· Netflix is down 30%, even though people are stuck at home desperately trying to find things to watch)
· Amazon has fallen 26% in the past couple of weeks despite soaring demand for their delivery services
· GDXJ, the gold miners sector that is typically a safe haven during times of volatility, crashed 57% even though gold is usually a safe haven during times of volatility.
So, what was I doing wrong? I started calling and visiting traders who were making money during the bear market to see what they were doing, and 100% of them were doing the same thing – Trading with Technical Analysis. I wasn’t doing anything wrong, per se. I was simply using the wrong tools and analysis for success!
What is Technical Analysis? In short, it’s the study of price, time, and volatility of any asset using price charts and indicators. Traders use technical analysis to find cycles and patterns in the market and trade on the analysis of preferred indicators as opposed to the fundamentals of a company and/or the economy in general.
When you start studying technical traders, you will notice every trader has a particular time frame, a preferred set of indicators, and trading frequency that fits their unique personality and lifestyle. Their brains can see the charts in ways you and I may not see them to predict future price direction over the next few hours, days, weeks, or months ahead. I quickly learned there are infinite ways to trade using technical analysis.
I was very surprised by how much these pro traders allowed me. While standing over their shoulders, I was looking at their charts to try to divine their high-level strategies and learn how they think, analyze, and trade. It was amazing how different each of them traded the market. Some traded currencies; others traded stocks, indexes, options, futures, etc. Most were day traders, swing traders, or a mix of the two. But none of them gave me their secret sauce. That is why I turned 100% of my focus to technical analysis. I was excited at the prospect of being able to profit from both rising and falling prices and no concern for anything other than price action reduced my research time dramatically. It was and is the biggest AH-HA moment of my life and a turning point for my career as a trader.
The year was 2001, when I made the shift to technical analysis. I unsubscribed from everything fundamental based. I canceled my CNBC, stopped listening to news, and stopped reading other people’s reports altogether. My goal was to create my own technical trading strategy that best suited my personality and lifestyle. I would have to discover the securities I was most comfortable trading, the frequency I would trade, and the type and amount of risk I was prepared to take.
I traded options, covered-calls, currencies, stocks, ETFs, and futures. From day trading to position trading (holding several months), I tried it all, hoping something would click for me to pursue at a much deeper level. Day trading, momentum, and swing trading were my sweet spots. Having three of them was a bonus as I know some traders only ever master one in their lifetime if they are lucky. I grew a liking for trading the major indexes like the DJIA, S&P 500, and Nasdaq… great liquidity with big money always at play.
Along my journey, I realized that if I could predict the overall market trend direction for the day or week, then I could day trade small cap stocks in the same direction as the index, knowing 80+% of the stocks follow the general stock market trend. I could generate much larger gains in a very short period of time. As time went on, I became comfortable predicting, trading, and profiting from the indexes, and my new trading strategy began to emerge.
I was fortunate enough to start learning about the markets and trading in college with a $2,000 E-Trade account, and then retiring (kinda) in 2009 at the age of 28. I built my dream home on the water, bought cars and boats, and spent time traveling with my growing family. I love trading and sharing my analysis with others – it is better than I had ever imagined and why I continue to help thousands of traders around the world every day with these video courses Trading System Mastery, and Trading As Your Business.
I contribute 100% of my trading success and lifestyle to the fact that I embraced technical analysis, where my strategy involves nothing more than price movement, position-sizing, and trade risk management techniques. All these allow me to easily reduce exposure, drawdowns, and losses with proper position sizing and protective strategies. If you want quick and simple, read about my journey and core trading tools in my book Technical Trading Mastery – 7 Steps to Win with Logic. My strategy is represented by human psychology and historical trading, as expressed in the three charts below.
Chart 1 – Human Psychology is What Drives Price Action
This chart is my favorite as it explains trader and investor psychology at various market stages. It also includes a simplified market cycle in the upper right corner, letting you know where the maximum financial risk is for investors and the highest opportunity for a trade.
Chart 2 – 2000 Stock Market Top & Bear Market That Followed
The chart may look a little overwhelming, but look at each part and compare it to the market psychology chart above. What happened in 2000 is what I feel is happening this year with the stock market sell-off.
In 2000, all market participants learned of at the same time was that there were no earnings coming from their darling .com stocks. Knowing they were not going to make money for a long time, everyone started selling these terrible stocks, and the market collapsed 40% very quickly.
What is similar between 2000 and 2020? Simple really. COVID-19 virus has halted a huge portion of business activity, travel, purchases, sporting events, etc. Everyone knows earnings are going to be poor, and many companies are going to go bankrupt. It is blatantly clear to everyone this is bad and will be for at least 6-12 months in corporate earnings; therefore, everyone is in a rush to sell their stock shares and are in a panic to unload them before everyone does.
Chart 3 – The 2020 Stock Market Top Looks to Be Unfolding
As you can see, this chart below of this year’s market crash is VERY similar to that of 2000 thus far, it’s based on a similar mindset, which is the fear of losing money, which causes everyone to sell their positions.
I am hopeful that we get a 25-30% rally from these lows before the market starts to fall and continue the new bear market, which I believe we are entering. Only the price will confirm the direction and major trend to follow, and since we follow price action and do not pick tops or bottoms, all we have to do is watch, learn, and trade when price favors new low risk, high reward trade setups.
It does not matter which way the market crashes from here, we will either profit from the next leg down, or will miss/avoid it depending on if we get a tradable setup. Either cause is a win, just one makes money, while the worst case scenario just preserves capital in a cash position, you can’t complain either way if you ask me.
Before you continue, be sure to opt-in to our free market trend signals
before closing this page, so you don’t miss our next special report!
Concluding Thoughts
In short, is if you lost money during the recent market crash, then you likely have not mastered a technical trading strategy and do not have proper trade management rules in place. All traders must manage risk and trades to be sure you lock in profits and limit losses when prices start pullback or collapse. Without either of these, you will not be able to achieve long term success/gains, and that’s a fact.
While we can all make money during a bull market when stocks are rising, if you cannot retain or grow your account during market downturns, then you may as well be a passive buy and hold investors. You are better at riding the emotional investor rollercoaster without wasting your time and effort as a trader if you are not going to spend the time and money to learn to follow someone to become a successful trader. Without proven trading strategies or someone to follow, you are more likely to underperform a long term passive investor.
I get dozens of emails from people every week trying to trade this wild stock market and use leveraged ETFs, which doing so during these unprecedented market conditions is absolute craziness if you ask me.
These people think that because there are big moves in the market, they should be trading. That big money should be made trading them, which drives me crazy because it could not be further from the truth unless you are a scalp or day trader. To me, in this market condition, it’s about preserving capital, not risking it, in my opinion.
A subscriber to my market video analysis and ETF trading newsletter said it perfectly:
“Always intrigues me how many amateur surfers get to the north shore beaches in Hawaii, take one look at monster waves and conclude it’s way too dangerous. Yet the amateur trader looks at treacherous markets like these and wants to dive right in!!” Richard P.
I have to toot my own horn here a little because subscribers and I had our trading accounts close at a new high watermark for our accounts. We not only exited the equities market as it started to roll over we profited from the sell off in a very controlled way.
I hope you found this informative, and if you would like to get a pre-market video every day before the opening bell, along with my trade alerts, visit my ETF swing trading visit my website at The Technical Traders.
Chris Vermeulen
Founder of The Technical Traders

Labels:
analysis,
Chris Vermeulen,
CNBC,
Crude Oil,
Gold,
miners,
Natural Gas,
SP500,
stocks,
swing trader,
The Technical Traders
Thursday, March 12, 2020
Revisiting Our July 2019 Crude Oil Predictions & Our 2020 Forecast
When it comes to our Adaptive Dynamic Learning (ADL) predictive modeling system, we get asked questions from our friends and followers about how it could predict a virus event or how it could predict a price event so far out into the future. The truth of the matter is the ADL predictive modeling system doesn’t predict unknown virus, banking or other types of events.
What it does do, quite well we might add, is identify historically accurate price events (almost like unique DNA markers) and attempts to identify future price events that align with recent price bar (DNA) setups. In other words, it maps the markets highest probability outcomes by studying past price activity and using a unique DNA like mapping system. Once this analysis is complete for any chart, we can ask it what is likely to happen in the future.
On July 8, 2019, our researchers did exactly that and posted an article regarding our findings that many people continue to write us about. Some, at first, in total disbelief that Crude Oil could fall to levels below $40 ever again and others that wanted to know how we came up with these numbers. We set our ADL system to show us what is expected on a Monthly Crude Oil chart going forward and it draws the likely outcome and volatility (highs & Lows).
If our ADL predictive modeling is correct, we will see rotation between $47 and $64 over the next 3+ months before a breakdown in price hits in November 2019. This will be followed by two fairly narrow price range months (December 2019 and January 2020) where oil prices will tighten near $45 to $50. After that tightening, we believe an extremely volatile price move will happen in February through April 2020 that could see oil prices trade as low as $22 and as high as $51 over a two to three-month span.
The most critical component of this early research is the statement we have timed perfectly with our system was “we believe an extremely volatile price move will happen in February through April 2020” and the following price predictions.
The ADL predictive modeling system provided us with a hint that volatility would skyrocket throughout this time in Crude Oil. And, as we all know, this next Daily Crude Oil chart highlights the incredible collapse from early January 2020 (near $65.00) to levels just below $50 in early February. After that, the high price level was near $54.50 and the current low price level is $27.34. We believe this downward price rotation in Crude Oil completely validates our earlier ADL predictive analysis.
Imagine having this type of forecast for our trading and investing! Be sure to opt-in to our free market trend signals newsletter before closing this page so you don’t miss our next special report!
Based on short term Fibonacci price momentum targets we could see fall as low as $17 per barrel, but this price target will change dramatically over the next few days depending on if oil bounces higher from here it is now.
If our research is correct, Crude oil may find a bottom somewhere near $17 to $24, the potential rally back up to somewhere above $37 - $41 ppb before staging another massive selloff. The massive volatility suggested by the ADL system also suggests a broad price range over the next 60+ days.
Thus, we believe crude oil will attempt to form a bottom below $30, then attempt a brief rally to “fill the gap” (or partially fill the gap). After that, supply side economics will take over and crude oil should begin to move back towards the to $30 price level again – just as our ADL predictive modeling system suggested.
As of today, we are getting dozens of emails asking about what we see for the US major markets and global markets with our systems. Everyone wants to know “what’s next?”. Most of that research is delivered to our active subscribers/members and you can gain access to that information simply by visiting my website. You really don’t want to miss these next huge moves.
As a technical analysis and trader since 1997, I have been through a few bull/bear market cycles. I believe I have a good pulse on the market and timing key turning points for short term swing traders.
Visit my ETF Wealth Building Newsletter and if you like what I offer, and ride my coattails as I navigate these financial markets and build wealth while others lose nearly everything they own during the next financial crisis.
Chris Vermeulen
The Technical Traders
What it does do, quite well we might add, is identify historically accurate price events (almost like unique DNA markers) and attempts to identify future price events that align with recent price bar (DNA) setups. In other words, it maps the markets highest probability outcomes by studying past price activity and using a unique DNA like mapping system. Once this analysis is complete for any chart, we can ask it what is likely to happen in the future.
On July 8, 2019, our researchers did exactly that and posted an article regarding our findings that many people continue to write us about. Some, at first, in total disbelief that Crude Oil could fall to levels below $40 ever again and others that wanted to know how we came up with these numbers. We set our ADL system to show us what is expected on a Monthly Crude Oil chart going forward and it draws the likely outcome and volatility (highs & Lows).
Here is a link to the original article....Just Visit Here
This Screen Capture From The Original July 2019 Article Clearly States
If our ADL predictive modeling is correct, we will see rotation between $47 and $64 over the next 3+ months before a breakdown in price hits in November 2019. This will be followed by two fairly narrow price range months (December 2019 and January 2020) where oil prices will tighten near $45 to $50. After that tightening, we believe an extremely volatile price move will happen in February through April 2020 that could see oil prices trade as low as $22 and as high as $51 over a two to three-month span.
The most critical component of this early research is the statement we have timed perfectly with our system was “we believe an extremely volatile price move will happen in February through April 2020” and the following price predictions.
The ADL predictive modeling system provided us with a hint that volatility would skyrocket throughout this time in Crude Oil. And, as we all know, this next Daily Crude Oil chart highlights the incredible collapse from early January 2020 (near $65.00) to levels just below $50 in early February. After that, the high price level was near $54.50 and the current low price level is $27.34. We believe this downward price rotation in Crude Oil completely validates our earlier ADL predictive analysis.
Imagine having this type of forecast for our trading and investing! Be sure to opt-in to our free market trend signals newsletter before closing this page so you don’t miss our next special report!
What's Next With The Price of Crude Oil?
If our research is correct, Crude oil may find a bottom somewhere near $17 to $24, the potential rally back up to somewhere above $37 - $41 ppb before staging another massive selloff. The massive volatility suggested by the ADL system also suggests a broad price range over the next 60+ days.
Thus, we believe crude oil will attempt to form a bottom below $30, then attempt a brief rally to “fill the gap” (or partially fill the gap). After that, supply side economics will take over and crude oil should begin to move back towards the to $30 price level again – just as our ADL predictive modeling system suggested.
As of today, we are getting dozens of emails asking about what we see for the US major markets and global markets with our systems. Everyone wants to know “what’s next?”. Most of that research is delivered to our active subscribers/members and you can gain access to that information simply by visiting my website. You really don’t want to miss these next huge moves.
As a technical analysis and trader since 1997, I have been through a few bull/bear market cycles. I believe I have a good pulse on the market and timing key turning points for short term swing traders.
Visit my ETF Wealth Building Newsletter and if you like what I offer, and ride my coattails as I navigate these financial markets and build wealth while others lose nearly everything they own during the next financial crisis.
Chris Vermeulen
The Technical Traders
Labels:
Chris Vermeulen,
commodities,
Crude Oil,
Gold,
money,
Natural Gas,
Silver,
stocks,
The Technical Traders,
traders
Sunday, January 19, 2020
Energy Continues Basing Setup - Next Breakout Expected Near January 24th
After watching crude oil fall from the $65 ppb level to the $58 ppb level (-10.7%) over the past few weeks, we still believe the energy sector is setting up for another great trade for skilled investors/traders.
We are all keenly aware that winter is still here and that heating oil demands may continue to push certain energy prices higher. Yet winter is also a time when people don’t travel as much and, overall, energy prices tend to weaken throughout Winter.
Over the past 37 years, the historical monthly breakdown for crude oil is as follows....
December: Generally lower by -$0.33 to -$0.86. Averages to the downside: -3.65 to +3.08
January: Generally lower by -$4.57 to -$6.72. Averages to the downside: -2.68 to +2.27
February: Generally higher by +$8.41 to +13.73. Averages to the upside +3.07 to -2.54
March: Generally higher by +7.33 to +$15.62. Averages to the upside by +2.84 to -2.14
Over the past 25 years, the historical monthly breakdown for natural gas is as follows....
December: Generally lower by -$2.34 to -$5.26. Averages to the downside: -0.81 to +0.69
January: Generally lower by -$5.14 to -$7.97. Averages to the downside: -0.69 to +0.45
February: Generally lower by -$1.48 to -$3.62. Averages to the downside -0.50 to +0.49
March: Generally higher by +0.63 to +$1.88. Averages to the upside by +0.41 to -0.70
Over the past 35 years, the historical monthly breakdown for heating oil is as follows....
December: Generally lower by -$0.16 to -$0.37. Averages to the downside: -0.14 to +0.09
January: Generally lower by -$0.52 to -$0.96. Averages to the downside: -0.09 to +0.10
February: Generally higher by +$0.48 to +$1.06. Averages to the upside +0.11 to -0.08
March: Generally higher by +0.03 to +$0.11. Averages to the upside by +0.09 to -0.10
This data suggests an extended winter in the U.S. may prompt further contraction in certain segments of the energy sector that may prompt an exaggerated downside price move in crude oil and natural gas. heating oil may rise a bit if the cold weather continues well past March/April 2019.
Conversely, if an early spring sets up in the U.S., then crude oil may begin to base a bit as people begin to traveling more, but heating oil and natural gas may decline as cold weather demands abate.
Heating oil has almost mirrored crude oil in price action recently. Our modeling systems are suggesting that crude oil may attempt to move below $40 ppb. This move would be a result of a number of factors – mostly slowing global demand and a shift to electric vehicles. We authored this research post early in January 2020 – please review it.
January 8, 2020: Is The Energy Sector Setting Up Another Great Entry?
We believe any price level below $40 in ERY is setting up for a very strong basing level going forward. We have identified two “pullback zones”. The first is what we call the “Deep Pullback Zone”. The second is what we call the “Deeper Pullback Zone”. Any upside price move from below $40 to recent upside target levels (above $50) would represent a 25%+ price rotation.
Historically, February is a very strong month for ERY. The data going back over the past 12 years suggests February produces substantially higher upside price gains (+1899.30 to -394.28) – translating into a 4.8:1 upside price ratio over 12 years. Both January and March reflect overall price weakness in ERY over the past 12 years. Thus, the real opportunity is the setup of the “February price advance”.
We believe any opportunity to take advantage of this historical technical price pattern is advantageous for skilled traders/investors.
This is a pure technical pattern based on price bar data mining. This is something you may not have ever considered unless you had the tools to search for historical price anomalies and rotation patterns. We have created a suite of tools and price modeling systems we use to help our members find incredible opportunities – this being one of them.
Get ready, February will likely prompt a very nice rally in ERY if historical price triggers confirm future price activity. The price pattern in February suggests a large upside price move is likely in ERY and we believe these low price basing patterns are an excellent opportunity for skilled traders.
Join my Wealth Building Newsletter if you like what you read here and ride my coattails as I navigate these financial markets and build wealth while others lose nearly everything they own.
Chris Vermeulen
The Technical Traders
We are all keenly aware that winter is still here and that heating oil demands may continue to push certain energy prices higher. Yet winter is also a time when people don’t travel as much and, overall, energy prices tend to weaken throughout Winter.
Over the past 37 years, the historical monthly breakdown for crude oil is as follows....
December: Generally lower by -$0.33 to -$0.86. Averages to the downside: -3.65 to +3.08
January: Generally lower by -$4.57 to -$6.72. Averages to the downside: -2.68 to +2.27
February: Generally higher by +$8.41 to +13.73. Averages to the upside +3.07 to -2.54
March: Generally higher by +7.33 to +$15.62. Averages to the upside by +2.84 to -2.14
Over the past 25 years, the historical monthly breakdown for natural gas is as follows....
December: Generally lower by -$2.34 to -$5.26. Averages to the downside: -0.81 to +0.69
January: Generally lower by -$5.14 to -$7.97. Averages to the downside: -0.69 to +0.45
February: Generally lower by -$1.48 to -$3.62. Averages to the downside -0.50 to +0.49
March: Generally higher by +0.63 to +$1.88. Averages to the upside by +0.41 to -0.70
Over the past 35 years, the historical monthly breakdown for heating oil is as follows....
December: Generally lower by -$0.16 to -$0.37. Averages to the downside: -0.14 to +0.09
January: Generally lower by -$0.52 to -$0.96. Averages to the downside: -0.09 to +0.10
February: Generally higher by +$0.48 to +$1.06. Averages to the upside +0.11 to -0.08
March: Generally higher by +0.03 to +$0.11. Averages to the upside by +0.09 to -0.10
This data suggests an extended winter in the U.S. may prompt further contraction in certain segments of the energy sector that may prompt an exaggerated downside price move in crude oil and natural gas. heating oil may rise a bit if the cold weather continues well past March/April 2019.
Conversely, if an early spring sets up in the U.S., then crude oil may begin to base a bit as people begin to traveling more, but heating oil and natural gas may decline as cold weather demands abate.
Heating oil has almost mirrored crude oil in price action recently. Our modeling systems are suggesting that crude oil may attempt to move below $40 ppb. This move would be a result of a number of factors – mostly slowing global demand and a shift to electric vehicles. We authored this research post early in January 2020 – please review it.
January 8, 2020: Is The Energy Sector Setting Up Another Great Entry?
We believe any price level below $40 in ERY is setting up for a very strong basing level going forward. We have identified two “pullback zones”. The first is what we call the “Deep Pullback Zone”. The second is what we call the “Deeper Pullback Zone”. Any upside price move from below $40 to recent upside target levels (above $50) would represent a 25%+ price rotation.
Historically, February is a very strong month for ERY. The data going back over the past 12 years suggests February produces substantially higher upside price gains (+1899.30 to -394.28) – translating into a 4.8:1 upside price ratio over 12 years. Both January and March reflect overall price weakness in ERY over the past 12 years. Thus, the real opportunity is the setup of the “February price advance”.
We believe any opportunity to take advantage of this historical technical price pattern is advantageous for skilled traders/investors.
This is a pure technical pattern based on price bar data mining. This is something you may not have ever considered unless you had the tools to search for historical price anomalies and rotation patterns. We have created a suite of tools and price modeling systems we use to help our members find incredible opportunities – this being one of them.
Get ready, February will likely prompt a very nice rally in ERY if historical price triggers confirm future price activity. The price pattern in February suggests a large upside price move is likely in ERY and we believe these low price basing patterns are an excellent opportunity for skilled traders.
Join my Wealth Building Newsletter if you like what you read here and ride my coattails as I navigate these financial markets and build wealth while others lose nearly everything they own.
Chris Vermeulen
The Technical Traders

Labels:
commodities,
Crude Oil,
Day Trading,
Heating Oil,
investing,
money,
Natural Gas,
stocks,
The Technical Traders
Friday, January 3, 2020
ADL Gold Prediction Confirms Our Targets
The Gold rally we predicted to happen in late 2018 took place, almost perfectly, based on our ADL predictive modeling systems results. This rally took place in May through September 2019 and pushed Gold up to levels near $1600. The rest of the year, Gold consolidated near $1500 as a strong US Stock Market rally took hold in Q4 of 2019.
Our original prediction was that Gold would rally to levels near $1750 before the end of 2019 based on our Adaptive Dynamic Learning predictive modeling system (ADL). This did not happen in 2019 as out ADL modeling systems suggested, but it appears Gold is setting up for another massive upside rally in 2020.
Taking a look at our ADL predictive modeling systems on Monthly charts for Gold and Silver, we see two very interesting suggestions setting up :
If we consider what happened in 2008/09 with the global credit market crisis, both Gold and Silver contracted lower near the start of this crisis (in late 2008). Eventually, Gold began to move higher in August/September 2009 (well into the crisis event). Silver didn’t really start to accelerate higher will August 2010 – a full 12 months after the Gold rally started.
Our ADL system is suggesting that the Silver rally will lag behind the gold rally by about 10 to 14 months given the ADL predictions for price activity in 2020. Thus, Gold may continue to rally much higher fairly early in 2020, yet we won’t see much upside movement in Silver till after July 2020.
This first Monthly Gold ADL chart highlights the ADL predictive modeling systems suggestion related to future price targets. We can see the upside move in Gold should begin with an upside target near $1600-1625 over the next 60+ days. After that, the rally should accelerate higher in April/May 2020 with another move higher towards $1700-1725. By August/September 2020, Gold should attempt a rally to levels above $1800-1850 and then begin to consolidate above $1800 for a few months.
This Silver Monthly ADL chart suggests that Metals will react very similar in 2020 to what happened in 2008-09. While Gold began to rally in August 2009, Silver did not begin to accelerate higher till August/September 2010. This delay in the understanding that Silver presents valid protection against risk may take place in this current upside rally in Gold. If the ADL predictions are accurate, then Silver will continue to provide buying opportunities for many months near $17.50-$18.00 before a major upside price advance begin.
By July 2020, Our ADL predictive modeling system is suggesting Silver will advance to levels above $18.25, then begin a major price advance to levels above $19-20 fairly quickly. Please keep in mind the scope of these predictions related to the global markets and the U.S. Presidential elections. We read into this that a lot of chaos/turmoil may be taking place in the US/World after June/July 2020.
This last chart is a Weekly Gold chart highlighting our Fibonacci Price Amplitude Arcs and the major resistance level that has just been broken in Gold. The heavy GREEN arc and the BLACKLINE that we’ve drawn on this chart represent massive resistance originating from the lows near August 2018 in Gold. We believe this resistance level, once broken, will prompt a major upside price move in Gold to levels closer to or above $1700. If this price advance in Gold aligns well with our ADL predictions, then we believe fear will continue to drive future a future price advance in Gold and that fear may be related to continued Global stock market concerns and the U.S. elections.
2020 may be a very good year for precious metals traders who are able to identify solid entry trades for these moves. If our ADL predictions are accurate, Gold should rally over 25% before the end of 2020. Silver may rally as much as 15% before the end of 2020. The timing of these moves suggests Gold traders will have opportunities for bigger price advanced early in 2020 and will begin a larger upside price move after February/March 2020. Silver will begin an upside price move after basing near the March/April 2020.
2020 is going to be a fantastic year for skilled technical traders. Join us and our valued members in finding great trades and incredible opportunities in the markets by joining The Technical Traders.
Chris Vermeulen
The Technical Traders Ltd.
Our original prediction was that Gold would rally to levels near $1750 before the end of 2019 based on our Adaptive Dynamic Learning predictive modeling system (ADL). This did not happen in 2019 as out ADL modeling systems suggested, but it appears Gold is setting up for another massive upside rally in 2020.
Taking a look at our ADL predictive modeling systems on Monthly charts for Gold and Silver, we see two very interesting suggestions setting up :
- First, Gold may attempt a rally to a level above $1700 before March/April 2020 and potentially extend this rally to well above $1850 by August/September 2020.
- Second, Silver appears to lag behind this Gold rally by about 7 to 8 months. Silver does not appear to want to start a rally until well after July or August 2020.
If we consider what happened in 2008/09 with the global credit market crisis, both Gold and Silver contracted lower near the start of this crisis (in late 2008). Eventually, Gold began to move higher in August/September 2009 (well into the crisis event). Silver didn’t really start to accelerate higher will August 2010 – a full 12 months after the Gold rally started.
Our ADL system is suggesting that the Silver rally will lag behind the gold rally by about 10 to 14 months given the ADL predictions for price activity in 2020. Thus, Gold may continue to rally much higher fairly early in 2020, yet we won’t see much upside movement in Silver till after July 2020.
Monthly Gold ADL Chart
This first Monthly Gold ADL chart highlights the ADL predictive modeling systems suggestion related to future price targets. We can see the upside move in Gold should begin with an upside target near $1600-1625 over the next 60+ days. After that, the rally should accelerate higher in April/May 2020 with another move higher towards $1700-1725. By August/September 2020, Gold should attempt a rally to levels above $1800-1850 and then begin to consolidate above $1800 for a few months.
Silver Monthly ADL Chart
This Silver Monthly ADL chart suggests that Metals will react very similar in 2020 to what happened in 2008-09. While Gold began to rally in August 2009, Silver did not begin to accelerate higher till August/September 2010. This delay in the understanding that Silver presents valid protection against risk may take place in this current upside rally in Gold. If the ADL predictions are accurate, then Silver will continue to provide buying opportunities for many months near $17.50-$18.00 before a major upside price advance begin.
By July 2020, Our ADL predictive modeling system is suggesting Silver will advance to levels above $18.25, then begin a major price advance to levels above $19-20 fairly quickly. Please keep in mind the scope of these predictions related to the global markets and the U.S. Presidential elections. We read into this that a lot of chaos/turmoil may be taking place in the US/World after June/July 2020.
Weekly Gold Chart
This last chart is a Weekly Gold chart highlighting our Fibonacci Price Amplitude Arcs and the major resistance level that has just been broken in Gold. The heavy GREEN arc and the BLACKLINE that we’ve drawn on this chart represent massive resistance originating from the lows near August 2018 in Gold. We believe this resistance level, once broken, will prompt a major upside price move in Gold to levels closer to or above $1700. If this price advance in Gold aligns well with our ADL predictions, then we believe fear will continue to drive future a future price advance in Gold and that fear may be related to continued Global stock market concerns and the U.S. elections.
2020 may be a very good year for precious metals traders who are able to identify solid entry trades for these moves. If our ADL predictions are accurate, Gold should rally over 25% before the end of 2020. Silver may rally as much as 15% before the end of 2020. The timing of these moves suggests Gold traders will have opportunities for bigger price advanced early in 2020 and will begin a larger upside price move after February/March 2020. Silver will begin an upside price move after basing near the March/April 2020.
2020 is going to be a fantastic year for skilled technical traders. Join us and our valued members in finding great trades and incredible opportunities in the markets by joining The Technical Traders.
Chris Vermeulen
The Technical Traders Ltd.
Labels:
charts,
Chris Vermeulen,
crisis,
Crude Oil,
Gold,
precious metals,
rally,
Silver,
The Technical Traders,
Volatility
Monday, December 30, 2019
American Shale Oil In High Demand
The narrative a while back was that the world would face a shortage of heavy crude because sanctions on Iran and Venezuela had reduced production and exports. Some also implied that shale oil would fill up U.S. storage because American refiners were designed to process the heavy, high sulfur crudes from Venezuela, Saudi Arabia, and the like.
But the light, sweet crude is in high demand for export, and that appetite is likely to continue to grow with the implementation of IMO 2020 around the corner, going into effect January 1st. Freight rates from the U.S. Gulf to Europe have surged to record highs.
Equinor ASA and Unipec, the trading arm of China's top refiner Sinopec, have provisionally chartered Aframax tankers for $60,700 per day, an increase of almost 30 percent in a week, a new record high, according to shipbroker Poten & Partners. Aframax tankers are the “workhorse” of the U.S.-Europe oil trade, which has risen more than 60 percent in 2019 compared to 2018.
The EPIC pipeline began service in August. It has the capacity to deliver 400,000 b/d from the Permian Basin to terminals on the Gulf Coast. The new Cactus II pipeline system also started shipping crude oil in August. It has the capacity to deliver 670,000 b/d of crude oil from the Permian.
And the Gray Oak pipeline began service in November and will be capable of delivering 900,000 b/d at capacity. This new takeaway capacity will effectively reduce the production breakeven costs of substantial Permian crude oil because the pipeline charges are significantly lower than trucking costs.
This should provide stimulus to shale oil production growth, which had slowed due to takeaway pipeline capacity constraints.
Exports Rising
U.S. crude oil exports averaged 3.412 million barrels per day for the weeks ending December 13, 2019. Crude oil exports were 33 percent higher than the same weeks last year. But in the year-to-date, exports are over 50 percent higher.
Exports of crude oil and petroleum products have surged to almost 9 million barrels per day. This makes the United States the largest petroleum exporting country in the world.
Net oil imports have recently dropped below zero, making the U.S. a net oil exporter for the first time in modern history. As a result, the U.S. economy is no longer vulnerable overall to a spike in oil prices, though such a development would hurt consumers while helping domestic oil producers.
The U.S. balance of payments and trade would not be adversely impacted. This is a positive tailwind for the value of the U.S. dollar.
It also has political and defense spending implications. For example, following the attacks on Saudi Arabia in September, President Trump did not put the U.S. military at risk to defend KSA. He also did not counter-attack Iran on behalf of Saudi Arabia. The Crown Prince of Saudi Arabia reportedly began talks with Iran to defuse the situation, something the Kingdom did not have to try when the U.S. felt obligated to protect its oil supply for economic reasons.
Conclusions
The U.S. shale revolution is being re-booted by the opening up of new pipes in the second half of 2019. Given strong foreign demand and lower effective breakeven costs, a new surge may be in the works. Market observers who saw growth slowing may be in for a wake-up call over the coming six months when the new economic conditions take hold.
Check back to see my next post!
Best,
Robert Boslego
INO.com Contributor - Energies

But the light, sweet crude is in high demand for export, and that appetite is likely to continue to grow with the implementation of IMO 2020 around the corner, going into effect January 1st. Freight rates from the U.S. Gulf to Europe have surged to record highs.
Equinor ASA and Unipec, the trading arm of China's top refiner Sinopec, have provisionally chartered Aframax tankers for $60,700 per day, an increase of almost 30 percent in a week, a new record high, according to shipbroker Poten & Partners. Aframax tankers are the “workhorse” of the U.S.-Europe oil trade, which has risen more than 60 percent in 2019 compared to 2018.
The EPIC pipeline began service in August. It has the capacity to deliver 400,000 b/d from the Permian Basin to terminals on the Gulf Coast. The new Cactus II pipeline system also started shipping crude oil in August. It has the capacity to deliver 670,000 b/d of crude oil from the Permian.
And the Gray Oak pipeline began service in November and will be capable of delivering 900,000 b/d at capacity. This new takeaway capacity will effectively reduce the production breakeven costs of substantial Permian crude oil because the pipeline charges are significantly lower than trucking costs.
This should provide stimulus to shale oil production growth, which had slowed due to takeaway pipeline capacity constraints.
Exports Rising
U.S. crude oil exports averaged 3.412 million barrels per day for the weeks ending December 13, 2019. Crude oil exports were 33 percent higher than the same weeks last year. But in the year-to-date, exports are over 50 percent higher.
Exports of crude oil and petroleum products have surged to almost 9 million barrels per day. This makes the United States the largest petroleum exporting country in the world.
Net oil imports have recently dropped below zero, making the U.S. a net oil exporter for the first time in modern history. As a result, the U.S. economy is no longer vulnerable overall to a spike in oil prices, though such a development would hurt consumers while helping domestic oil producers.
The U.S. balance of payments and trade would not be adversely impacted. This is a positive tailwind for the value of the U.S. dollar.
It also has political and defense spending implications. For example, following the attacks on Saudi Arabia in September, President Trump did not put the U.S. military at risk to defend KSA. He also did not counter-attack Iran on behalf of Saudi Arabia. The Crown Prince of Saudi Arabia reportedly began talks with Iran to defuse the situation, something the Kingdom did not have to try when the U.S. felt obligated to protect its oil supply for economic reasons.
Conclusions
The U.S. shale revolution is being re-booted by the opening up of new pipes in the second half of 2019. Given strong foreign demand and lower effective breakeven costs, a new surge may be in the works. Market observers who saw growth slowing may be in for a wake-up call over the coming six months when the new economic conditions take hold.
Check back to see my next post!
Best,
Robert Boslego
INO.com Contributor - Energies

Labels:
Aframax,
barrels,
china,
Crude Oil,
Equinor ASA,
INO .Com,
Permian,
Pipeline,
production,
Saudi Arabia,
Venezuela
Saturday, December 14, 2019
Seven Year Cycles Can Be Powerful and Gold Just Started One
Our research and predictive modeling systems have nailed Gold over the past 15+ months. We expected Gold to rally above $1750 before the end of this year, but the global trade wars and news cycles stalled the rally in Gold over the past 2 months. Now, it appears Gold is poised for another rally pushing much higher.
But wait, if you’re thinking I’m just another one of those traders who is always bullish on gold, just know I have been telling the truth about where gold was headed (lower) for years, but finally, the tide has changed!
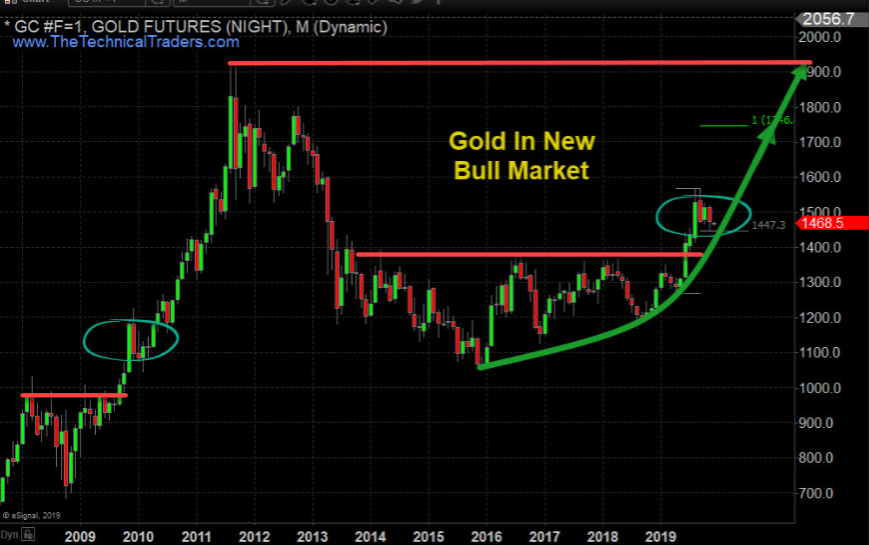
Gold broke down from a bull market in 2012/2013 – nearly 7 years ago. Now, Gold has broken resistance near $1375 and is technically in a full fledged Bull Market. The importance of this is the seven year cycle and how the rotation in Gold, between the high near $1923 and the low near $1045 represent an $878 price range. The upside (expansion) rally in Gold may very well move in expanding Fibonacci price structures – just like it did in 2005 through 2012. If this is the case, then we may expect to see an ultimate peak price in Gold well above $3500.
The rally that started in the last 2015 and ended in July 2016 totaled +$331.1 (+31.67%). The next price rally that started in August 2018 and ended in September 2019 totaled +$399.4 (+34.22%). If we take the current rally range (399.4) and divide it by the previous rally range (331.1), we end up with an expansion range of 121%. The two unique rallies that happened just before the 2009 parabolic rally in Gold represented (+315.8: 2006) and (394.8: 2008). The ratio of these two rallies is 125%. Could Gold have already set up for another parabolic rally well beyond the $1923 target level?
Before finding out what is next quickly join our free trend signals email list.
Our research team believes Gold has already entered a technically valid Bullish Market trend. We believe Gold miners will follow higher as Gold begins this next move higher. The reason we have not engaged in Miners, yet, is because we have not received any technically valid signals related to the Gold miners indicating they have also entered a new Bullish Market trend.
Gold is the safe haven for the global market. It is a store of value and offers price appreciation when the global market risks are excessive. Because of this, the sentiment across the global markets appears to be weakening in regards to forward expectations and valuation appreciation within the investment/asset classes. If Gold continues to rally higher, consider it a strong indicator that the foundation of the global market valuation levels is weakening considerably.
Should the U.S. Dollar retrace lower, Gold will see a price increase based on the renewed weakness of the U.S. Dollar. This would also assist in re-balancing global trade and economic issues with the US Dollar moving moderately lower as weakening global markets contract.
Miners are set up much like Gold was in early 2018. Resistance has been set up with multiple price tops and any momentum rally above this level would technically qualify as a new Bullish Market trend for miners.
At this point, we believe the bottom in miners has already formed and we are simply waiting for the qualifying technical confirmation of the bullish trend to begin. Jumping into this trade too early could result in unwanted risks as the price could still waffle around within the Stage 1 Base range.
If you want to learn more about market stage analysis I will be covering it a new article shortly. Once you grasp the basic concept you will see these stages on every chart no matter the time frame and know when to focus on trading and when to ignore the charts.
If you like new fresh big trend trades then check out this real estate article I just posted and how the real estate ETF could allow your to profit from home prices but you don’t even need to own or buy a home!
The recent weakness in the US and global markets has prompted a moderately solid upside move in Gold and Silver over the past few days. We still need to see a Gold move above recent resistance to qualify as a new upside rally though. Miners are set up for a breakout technical move which we must also wait for. We believe these two may move somewhat in unison if the global markets continue to contract throughout the end of 2019 and into 2020.
Stay tuned for more updates and alerts when all these key sectors and asset classes start new trends because that is when you want to get involved for immediate oversized gains. See my stock, index, and commodity trade alerts here.
Chris Vermeulen
The Technical Traders
But wait, if you’re thinking I’m just another one of those traders who is always bullish on gold, just know I have been telling the truth about where gold was headed (lower) for years, but finally, the tide has changed!
Gold broke down from a bull market in 2012/2013 – nearly 7 years ago. Now, Gold has broken resistance near $1375 and is technically in a full fledged Bull Market. The importance of this is the seven year cycle and how the rotation in Gold, between the high near $1923 and the low near $1045 represent an $878 price range. The upside (expansion) rally in Gold may very well move in expanding Fibonacci price structures – just like it did in 2005 through 2012. If this is the case, then we may expect to see an ultimate peak price in Gold well above $3500.
The rally that started in the last 2015 and ended in July 2016 totaled +$331.1 (+31.67%). The next price rally that started in August 2018 and ended in September 2019 totaled +$399.4 (+34.22%). If we take the current rally range (399.4) and divide it by the previous rally range (331.1), we end up with an expansion range of 121%. The two unique rallies that happened just before the 2009 parabolic rally in Gold represented (+315.8: 2006) and (394.8: 2008). The ratio of these two rallies is 125%. Could Gold have already set up for another parabolic rally well beyond the $1923 target level?
Before finding out what is next quickly join our free trend signals email list.
Monthly Price of Gold Chart – Bull and Bear Market Trends
Our research team believes Gold has already entered a technically valid Bullish Market trend. We believe Gold miners will follow higher as Gold begins this next move higher. The reason we have not engaged in Miners, yet, is because we have not received any technically valid signals related to the Gold miners indicating they have also entered a new Bullish Market trend.
Gold is the safe haven for the global market. It is a store of value and offers price appreciation when the global market risks are excessive. Because of this, the sentiment across the global markets appears to be weakening in regards to forward expectations and valuation appreciation within the investment/asset classes. If Gold continues to rally higher, consider it a strong indicator that the foundation of the global market valuation levels is weakening considerably.
U.S. Dollar Will Start to Support Higher Gold Prices
Should the U.S. Dollar retrace lower, Gold will see a price increase based on the renewed weakness of the U.S. Dollar. This would also assist in re-balancing global trade and economic issues with the US Dollar moving moderately lower as weakening global markets contract.
Gold Mining Stocks – Monthly Chart
Miners are set up much like Gold was in early 2018. Resistance has been set up with multiple price tops and any momentum rally above this level would technically qualify as a new Bullish Market trend for miners.
At this point, we believe the bottom in miners has already formed and we are simply waiting for the qualifying technical confirmation of the bullish trend to begin. Jumping into this trade too early could result in unwanted risks as the price could still waffle around within the Stage 1 Base range.
If you want to learn more about market stage analysis I will be covering it a new article shortly. Once you grasp the basic concept you will see these stages on every chart no matter the time frame and know when to focus on trading and when to ignore the charts.
If you like new fresh big trend trades then check out this real estate article I just posted and how the real estate ETF could allow your to profit from home prices but you don’t even need to own or buy a home!
Concluding Thoughts
The recent weakness in the US and global markets has prompted a moderately solid upside move in Gold and Silver over the past few days. We still need to see a Gold move above recent resistance to qualify as a new upside rally though. Miners are set up for a breakout technical move which we must also wait for. We believe these two may move somewhat in unison if the global markets continue to contract throughout the end of 2019 and into 2020.
Stay tuned for more updates and alerts when all these key sectors and asset classes start new trends because that is when you want to get involved for immediate oversized gains. See my stock, index, and commodity trade alerts here.
Chris Vermeulen
The Technical Traders
Monday, November 18, 2019
When Crude Oil Collapses Below $40 What Happens - Part III
This, the final section of this multi-part research article, will continue our exploration of the consequences that may result from our ADL predictive modeling system’s suggestion that Oil may continue to fall to levels below $40 over the next few months.
In Part I and Part II, we’ve highlighted what we believe to be very compelling evidence that any continue oil price decline from current levels may be setting up the global markets for a massively volatile price reversion – similar to what happened in 1929.
Prior to the stock market collapse in 1929 and the start of the Great Depression, commodity prices collapsed in 1921 and again in 1930. This commodity price collapse was the result of over-supply and a dramatic change in investor mentality. The shift away from tangible items and real successful investing/manufacturing and towards speculation in the housing markets and stock market.
Today, we want to focus on some of the core elements of our current global economic structure to attempt to present any more compelling evidence of a commodity collapse event that may happen after the past 7+ years of a massive credit market expansion event. Allow us to briefly cover the events of the past 20 years.
You can get my daily market analysis articles and trade ideas by opting into my free market trend signals newsletter.
1999: the DOT COM bubble burst after a mild recession in 1993-94 and a stock market rally from 1996 to 1999
September 11, 2001: Terrorist Attack on US soil. Shocked the world and global stock markets. Sent the world’s economy into severe contraction. US Fed lowered interest rates from 6.25% to 1.0% from 2001 to 2003.
2004-06: US Fed begins raising rates from 1.0% and gradually increased rates to 5.25% in August 2006: +525%. Pushing the US credit market, and housing market, over the edge and starting the 2008 Credit Crisis.
2007-2008: US Fed lowered interest rates to near ZERO over a very short 16-month span of time as the US Credit Crisis event unfolded.
2009-15: US Fed continued to keep interest rates near zero throughout this time-frame and continued to pump capital in the global capital markets with multiple QE and debt buying events. Other global central banks followed the US lead providing additional capital throughout the global markets. This massive expansion of credit/debt over a 7+ year span of time allowed foreign nations to “binge” on cheap US and Euro credit/debt while an Emerging Market and Foreign Market recovery were taking place.
2016-2019: US Fed raised interest rates from 0.08% to 2.42% over this span of time. Pushing US Fed rates up by the highest percentage levels EVER: +3025%
This continued global cycle of “boom and bust” has wreaked havoc on global consumers and business enterprises. Over the past 20+ years, various cycles of economic appreciation and depreciation have left some people considerably better suited to deal with these cycles while others have been completely destroyed by these events. Now, it appears we are entering another period of “early warning” as global manufacturing activity, growth and economic output appears to be waning. Are we entering another period like the 1929 to 1940 period of the US where a global economic contraction resulted in a deeper economic recession/depression and took 15+ years to recover from?
The US Fed has recently started acquiring assets again – at a far greater rate than at any time since 2012. It is very likely that the US Fed is “front-running” a crisis event that is already starting to unravel again – possibly aligned with institutional banking entities and global credit/debt risks.
(Source: https://wolfstreet.com)
Chinese factory orders have continued to fall recently and the news is starting to trickle out of China that the US trade tariffs have done far greater damage than currently expected. This suggests that manufacturing, exports, and GDP for China have entered a massive decline. What happens next is that commodity prices collapse because of the lack of demand from manufacturers and consumers. (Source: https://www.yahoo.com/finance/) Chinese new loan origination rates have fallen to a 22 month “new low” – which suggests corporate and consumer borrowers are simply not willing to take on any new debt/credit at the moment. This happens when a population decides they want to “disconnect” from any economic risks and shift towards a “protectionist” process. (Source: https://finance.yahoo.com)
Recent news suggests that Chinese demand for European consumer and luxury goods has also contracted dramatically. Germany will release GDP estimates on November 14th. It is our opinion that the Chinese have already shifted into a more protectionist consumer stance and that would mean that demand for non-essential items (call them high-risk purchases) are very low at this time. If this is the case, the lack of true demand origination out of China/Asia could push much of Europe into a recession. (Source: https://www.yahoo.com/)
The last thing China would want right now is to blow the potential for any type of US/China trade deal – even if it means giving up more than they may have considered many months ago. More tariffs or any type of tit-for-tat retaliatory trade war would not be in the best interest of either party at this stage of the game. Who flinches first? The US, or China, or the rest of the world?
So, the question, again, becomes...“will a commodity collapse lead the global stock market into a prolonged period of price decline and/or a global recession over the next 10+ years?”
If so, can we expect commodities to collapse as they did after the 1929 stock market peak?
You may remember this chart from the earlier sections of this multi-part article. It highlights what happened leading up to the 1929 stock market crash and how early warning signs of manufacturing and agriculture weakness continued to plague the markets while speculation in housing and the stock market pushed certain asset values much higher near the end of the “Roaring 20s”.
Are we setting up for the same type of event right now where global trade, manufacturing, and agriculture are weakening after the 2008 Credit Crisis and we are meandering towards a repetition of the events that led to the “Great Depression”? Will commodities prices collapse to 2002 or 2003 levels for most items? Will Oil collapse to levels below $30 ppb over the next 6 to 12+ months? And what will happen to Gold and Silver throughout this time?
Can we navigate through these troubling events without risking some type of new collapse event or reversion event? Are the central banks prepared for this? Are traders/investors prepared for this? Just how close are we to the start of this type of event?
The answers lie in what we do now and how the commodities react over the next 12+ months. The one major difference between now and 1929 is that the world is far more inter-connected economically and there are more people throughout the world that have moved into the “economic class”. Thus, it is our opinion that any event that is likely to happen will be followed by a moderately strong recovery event – no matter how severe the outcome. The world is in a different place right now compared to 1929. Overall, only time will tell if our research and ADL predictive modeling system is accurate with respect to future oil prices.
We believe it is critical for all traders to understand what lies ahead and the risks involved in “playing dumb” about the current market environment. We recently authored an article titled “Welcome to the Zombie-land for investors” and highly suggest you read it. Our researchers will share this one component that should help to ease some of the stress you may be feeling right now – the most capable, secure, mature and best funded (reserves) economies on the planet will likely lead any recovery process should an event as this happen. Therefore, look for strengths in the most mature and capable economies on the planet if some new crisis event begins.
Even if a trade deal between the US and China were to happen today and eliminate all trade tariffs, would this change anything or would this simply pour fuel onto the “capital shift” fire that is already taking place with speculation reaching frothy levels?
If you want to earn 34%-50% a year return on your trading account with very few ETF trades then join us at the Wealth Building Newsletter today!
The Technical Traders
In Part I and Part II, we’ve highlighted what we believe to be very compelling evidence that any continue oil price decline from current levels may be setting up the global markets for a massively volatile price reversion – similar to what happened in 1929.
Prior to the stock market collapse in 1929 and the start of the Great Depression, commodity prices collapsed in 1921 and again in 1930. This commodity price collapse was the result of over-supply and a dramatic change in investor mentality. The shift away from tangible items and real successful investing/manufacturing and towards speculation in the housing markets and stock market.
Today, we want to focus on some of the core elements of our current global economic structure to attempt to present any more compelling evidence of a commodity collapse event that may happen after the past 7+ years of a massive credit market expansion event. Allow us to briefly cover the events of the past 20 years.
You can get my daily market analysis articles and trade ideas by opting into my free market trend signals newsletter.
1999: the DOT COM bubble burst after a mild recession in 1993-94 and a stock market rally from 1996 to 1999
September 11, 2001: Terrorist Attack on US soil. Shocked the world and global stock markets. Sent the world’s economy into severe contraction. US Fed lowered interest rates from 6.25% to 1.0% from 2001 to 2003.
2004-06: US Fed begins raising rates from 1.0% and gradually increased rates to 5.25% in August 2006: +525%. Pushing the US credit market, and housing market, over the edge and starting the 2008 Credit Crisis.
2007-2008: US Fed lowered interest rates to near ZERO over a very short 16-month span of time as the US Credit Crisis event unfolded.
2009-15: US Fed continued to keep interest rates near zero throughout this time-frame and continued to pump capital in the global capital markets with multiple QE and debt buying events. Other global central banks followed the US lead providing additional capital throughout the global markets. This massive expansion of credit/debt over a 7+ year span of time allowed foreign nations to “binge” on cheap US and Euro credit/debt while an Emerging Market and Foreign Market recovery were taking place.
2016-2019: US Fed raised interest rates from 0.08% to 2.42% over this span of time. Pushing US Fed rates up by the highest percentage levels EVER: +3025%
This continued global cycle of “boom and bust” has wreaked havoc on global consumers and business enterprises. Over the past 20+ years, various cycles of economic appreciation and depreciation have left some people considerably better suited to deal with these cycles while others have been completely destroyed by these events. Now, it appears we are entering another period of “early warning” as global manufacturing activity, growth and economic output appears to be waning. Are we entering another period like the 1929 to 1940 period of the US where a global economic contraction resulted in a deeper economic recession/depression and took 15+ years to recover from?
The US Fed has recently started acquiring assets again – at a far greater rate than at any time since 2012. It is very likely that the US Fed is “front-running” a crisis event that is already starting to unravel again – possibly aligned with institutional banking entities and global credit/debt risks.
(Source: https://wolfstreet.com)
Chinese factory orders have continued to fall recently and the news is starting to trickle out of China that the US trade tariffs have done far greater damage than currently expected. This suggests that manufacturing, exports, and GDP for China have entered a massive decline. What happens next is that commodity prices collapse because of the lack of demand from manufacturers and consumers. (Source: https://www.yahoo.com/finance/) Chinese new loan origination rates have fallen to a 22 month “new low” – which suggests corporate and consumer borrowers are simply not willing to take on any new debt/credit at the moment. This happens when a population decides they want to “disconnect” from any economic risks and shift towards a “protectionist” process. (Source: https://finance.yahoo.com)
Recent news suggests that Chinese demand for European consumer and luxury goods has also contracted dramatically. Germany will release GDP estimates on November 14th. It is our opinion that the Chinese have already shifted into a more protectionist consumer stance and that would mean that demand for non-essential items (call them high-risk purchases) are very low at this time. If this is the case, the lack of true demand origination out of China/Asia could push much of Europe into a recession. (Source: https://www.yahoo.com/)
The last thing China would want right now is to blow the potential for any type of US/China trade deal – even if it means giving up more than they may have considered many months ago. More tariffs or any type of tit-for-tat retaliatory trade war would not be in the best interest of either party at this stage of the game. Who flinches first? The US, or China, or the rest of the world?
So, the question, again, becomes...“will a commodity collapse lead the global stock market into a prolonged period of price decline and/or a global recession over the next 10+ years?”
If so, can we expect commodities to collapse as they did after the 1929 stock market peak?
You may remember this chart from the earlier sections of this multi-part article. It highlights what happened leading up to the 1929 stock market crash and how early warning signs of manufacturing and agriculture weakness continued to plague the markets while speculation in housing and the stock market pushed certain asset values much higher near the end of the “Roaring 20s”.
Are we setting up for the same type of event right now where global trade, manufacturing, and agriculture are weakening after the 2008 Credit Crisis and we are meandering towards a repetition of the events that led to the “Great Depression”? Will commodities prices collapse to 2002 or 2003 levels for most items? Will Oil collapse to levels below $30 ppb over the next 6 to 12+ months? And what will happen to Gold and Silver throughout this time?
Can we navigate through these troubling events without risking some type of new collapse event or reversion event? Are the central banks prepared for this? Are traders/investors prepared for this? Just how close are we to the start of this type of event?
The answers lie in what we do now and how the commodities react over the next 12+ months. The one major difference between now and 1929 is that the world is far more inter-connected economically and there are more people throughout the world that have moved into the “economic class”. Thus, it is our opinion that any event that is likely to happen will be followed by a moderately strong recovery event – no matter how severe the outcome. The world is in a different place right now compared to 1929. Overall, only time will tell if our research and ADL predictive modeling system is accurate with respect to future oil prices.
We believe it is critical for all traders to understand what lies ahead and the risks involved in “playing dumb” about the current market environment. We recently authored an article titled “Welcome to the Zombie-land for investors” and highly suggest you read it. Our researchers will share this one component that should help to ease some of the stress you may be feeling right now – the most capable, secure, mature and best funded (reserves) economies on the planet will likely lead any recovery process should an event as this happen. Therefore, look for strengths in the most mature and capable economies on the planet if some new crisis event begins.
Even if a trade deal between the US and China were to happen today and eliminate all trade tariffs, would this change anything or would this simply pour fuel onto the “capital shift” fire that is already taking place with speculation reaching frothy levels?
If you want to earn 34%-50% a year return on your trading account with very few ETF trades then join us at the Wealth Building Newsletter today!
The Technical Traders
Labels:
china,
Chris Vermeulen,
Crude Oil,
Gas,
great depression,
investor,
profit,
stocks,
tariffs,
The Technical Traders,
trade deal
Friday, November 8, 2019
Where is the Top for Natural Gas?
We wrote a very telling research article on October 24th, 2019. We never published it because we had other articles scheduled to be published over the next few weeks in the queue and because our subscribers get our trade alerts before the general public. At this point, we are sharing that past article as well as some current research for Natural Gas that should be very interesting to you.
Pay very close attention to the original October 24th article, below, and our prediction that the $2.75 to $2.85 level would be a likely target for the upside price rally from the basing level below $2.30. Currently, Natural Gas is trading at $2.87 – reaching our initial target level.
If our research is correct, strong demand and limited supply globally may push Natural Gas well above the $3.20 to $3.40 level after a very brief pause happens near $3.00. In fact, Natural Gas may be getting ready to rally past 2018 highs ($4.93) if the situation presents itself for such an incredible price rally. What would it take for a rally like that to happen? Much stronger demand for natural gas because of an early, extreme winter and extended global demand.
Price reacts to supply/demand imbalances. In this case, if the demand far exceeds the supply capacities headed into the end of 2019, we could easily see Natural Gas rally above $4.00 very quickly. Could it rally even higher and take out the $5.00 level? Absolutely it could if the proper dynamics continue related to supply and demand globally.
Remember to read the link from October 5th. We’ve been warning of this move for more than 60+ days and have authored multiple research posts attempting to keep our followers aware of this setup. This trade setup was telegraphed for us many months ago. All you had to do was follow our research and stay aware of the trends as this momentum base setup in October near $2.25.
Natural Gas moved higher by nearly 2% on October 24th as our researchers predicted nearly a month ago. This incredible momentum base below $2.30 seems to be a very strong support level for Natural Gas. We believe this next rally may be bigger than the last rally which reached a high near 2.70. Our Fibonacci price modeling system is suggesting a target price of $2.95 to confirm a new upside price trend. This means the price would have to rally more than +26.5% from current levels to confirm a potentially much bigger upside price move. Can you imagine seeing Natural Gas climb to above $4.50 again – like last year?
Near the end of October 2018, Natural Gas began an upside price move that really excited investors. The first upside price leg began in mid-September, near $2.75 and rallied to a level near $3.35 – a +21.6% upside price move. After a brief 12 to 15 day pause, another price rally began in early November 2018 near $3.23 and continued very aggressively over the next 11+ days to rally up to $4.93 – a +57% rally.
We issued a natural gas trade using UGAZ to members and this week we locked in 38.7% profit on a portion of our position and there is still a lot of upside potential left.
Is the same type of price advance could be setting up for an early November price rally from the $2.30 level to somewhere above $3.50? This would result in a +50% price rally from recent lows without using any leverage which would be just amazing.
October 5, 2019: Natural Gas Reloads for Another Price Rally
Our proprietary Fibonacci price modeling system is suggesting the $2.95 price level is critical for any further upside price action to continue above $3.00. The price must cross above the $2.95 level on a strong closing price basis before we could consider any higher price levels to become valid. Our researchers believe that suggests the $2.75 to $2.85 level becomes a very real upside price target for skilled traders to pull some profits and protect any open long positions.
This Weekly Natural Gas chart highlights our Fibonacci price modeling system’s results and the Bullish Trigger Level near $2.95 (The GREEN LINE). Pay very close attention to how quickly Natural Gas moved higher in November 2018. If another move happens like that in 2019, we could be setting up for a big gap higher followed by about 10 to 15+ days of incredible upside price action.
Currently, the price of Natural Gas has crossed the Daily Fibonacci price modeling system’s Bullish Price Trigger level near $2.29. This suggests that we are now in a confirmed bullish trend as long as the price stays above the $2.26 level on a closing price basis. We would expect a continued moderate price rally from these levels to move price away from the momentum base level over time – before any breakout upside price move may begin.
This could become one of the best trades, besides Silver and Gold, headed into the end of 2019. Get ready for some big volatility in Natural Gas as winter weather takes over much of North America.
November will be the month of breakouts and breakdowns and should spark some trades. I feel the safe havens like bonds and metals will be turning a corner and starting to firm up and head higher but they may not start a big rally for several weeks or months.
October was a boring month for most major asset classes completing their consolidation phase. Natural gas was the big mover in October and subscribers and I took full advantage of the bottom and breakout for a 15-22% gain and its till on fire and trading higher by another 3% this week already.
If you like to catch assets starting new trends and trade 1x, 2x and 3x ETF’s the be sure to join my premium trade alert service called the Wealth Building Newsletter.
Chris Vermeulen
The Technical Traders
Pay very close attention to the original October 24th article, below, and our prediction that the $2.75 to $2.85 level would be a likely target for the upside price rally from the basing level below $2.30. Currently, Natural Gas is trading at $2.87 – reaching our initial target level.
If our research is correct, strong demand and limited supply globally may push Natural Gas well above the $3.20 to $3.40 level after a very brief pause happens near $3.00. In fact, Natural Gas may be getting ready to rally past 2018 highs ($4.93) if the situation presents itself for such an incredible price rally. What would it take for a rally like that to happen? Much stronger demand for natural gas because of an early, extreme winter and extended global demand.
Price reacts to supply/demand imbalances. In this case, if the demand far exceeds the supply capacities headed into the end of 2019, we could easily see Natural Gas rally above $4.00 very quickly. Could it rally even higher and take out the $5.00 level? Absolutely it could if the proper dynamics continue related to supply and demand globally.
Current Daily Natural Gas Chart
Remember to read the link from October 5th. We’ve been warning of this move for more than 60+ days and have authored multiple research posts attempting to keep our followers aware of this setup. This trade setup was telegraphed for us many months ago. All you had to do was follow our research and stay aware of the trends as this momentum base setup in October near $2.25.
Natural Gas moved higher by nearly 2% on October 24th as our researchers predicted nearly a month ago. This incredible momentum base below $2.30 seems to be a very strong support level for Natural Gas. We believe this next rally may be bigger than the last rally which reached a high near 2.70. Our Fibonacci price modeling system is suggesting a target price of $2.95 to confirm a new upside price trend. This means the price would have to rally more than +26.5% from current levels to confirm a potentially much bigger upside price move. Can you imagine seeing Natural Gas climb to above $4.50 again – like last year?
Near the end of October 2018, Natural Gas began an upside price move that really excited investors. The first upside price leg began in mid-September, near $2.75 and rallied to a level near $3.35 – a +21.6% upside price move. After a brief 12 to 15 day pause, another price rally began in early November 2018 near $3.23 and continued very aggressively over the next 11+ days to rally up to $4.93 – a +57% rally.
We issued a natural gas trade using UGAZ to members and this week we locked in 38.7% profit on a portion of our position and there is still a lot of upside potential left.
Is the same type of price advance could be setting up for an early November price rally from the $2.30 level to somewhere above $3.50? This would result in a +50% price rally from recent lows without using any leverage which would be just amazing.
October 5, 2019: Natural Gas Reloads for Another Price Rally
Previous Natural Gas Forecast Daily Chart
Our proprietary Fibonacci price modeling system is suggesting the $2.95 price level is critical for any further upside price action to continue above $3.00. The price must cross above the $2.95 level on a strong closing price basis before we could consider any higher price levels to become valid. Our researchers believe that suggests the $2.75 to $2.85 level becomes a very real upside price target for skilled traders to pull some profits and protect any open long positions.
Previous Natural Gas Forecast Weekly Chart
This Weekly Natural Gas chart highlights our Fibonacci price modeling system’s results and the Bullish Trigger Level near $2.95 (The GREEN LINE). Pay very close attention to how quickly Natural Gas moved higher in November 2018. If another move happens like that in 2019, we could be setting up for a big gap higher followed by about 10 to 15+ days of incredible upside price action.
Currently, the price of Natural Gas has crossed the Daily Fibonacci price modeling system’s Bullish Price Trigger level near $2.29. This suggests that we are now in a confirmed bullish trend as long as the price stays above the $2.26 level on a closing price basis. We would expect a continued moderate price rally from these levels to move price away from the momentum base level over time – before any breakout upside price move may begin.
This could become one of the best trades, besides Silver and Gold, headed into the end of 2019. Get ready for some big volatility in Natural Gas as winter weather takes over much of North America.
November will be the month of breakouts and breakdowns and should spark some trades. I feel the safe havens like bonds and metals will be turning a corner and starting to firm up and head higher but they may not start a big rally for several weeks or months.
October was a boring month for most major asset classes completing their consolidation phase. Natural gas was the big mover in October and subscribers and I took full advantage of the bottom and breakout for a 15-22% gain and its till on fire and trading higher by another 3% this week already.
If you like to catch assets starting new trends and trade 1x, 2x and 3x ETF’s the be sure to join my premium trade alert service called the Wealth Building Newsletter.
Chris Vermeulen
The Technical Traders
Labels:
Chris Vermeulen,
Crude Oil,
downside,
ETF's,
FCG,
investing,
Natural Gas,
stocks,
The Technical Traders,
UGAZ,
UNG,
upside
Sunday, September 8, 2019
Can Crude Oil Stay Above $50 to Support Producers Expectations
Recent news suggests that oil producers are attempting to increase production levels after failing to attempt to push prices higher by cutting production levels. Globally, oil producers want to see oil prices rise above $65 ppb in an effort to support profit and production cost expectations. The real issue for the nation/states that rely on oil production/sales is that the global economy may not cooperate with their expectations over the next 24+ months.
On August 6th, 2019, we posted this article suggesting that Natural Gas and Crude Oil were setting up diverging trades.
August 6th, 2019: Natural Gas and Crude Oil – Diverging Setups for Technical Traders
At that time, we wrote that we expected Crude oil to break lower from the $62 ppb level and target $55, then $49 based on our original Crude Oil research from May 21, 2019.
Additionally, on July 29, 2019, we authored and posted this article suggesting that Crude Oil would begin a downside move from $55 to levels near $50 :
All of this research was related to our Adaptive Dynamic Learning (ADL) research post from July 10, 2019: Predictive Modeling Suggest Oil Headed Much Lower by Early 2020
This incredible predictive modeling research suggested that Oil would move dramatically lower towards the $50 level, then stall near $50 to $55+ through September and October. Ultimately breaking lower in late October/November to levels near or below $40.
Our researchers believe Crude Oil could become very volatile as price nears the apex of the Pennant/Flag formation that is setting up. This Daily chart highlights the attempted “scouting party” price rotation above the price resistance channel. The news over the past holiday weekend suggests the global economy may not see any real bump in activity over the next 12+ months and we believe this aligns with our longer-term research that Oil should target the sub $40 price level before the end of 2019 and potentially fall to levels below $30 in early 2020.
We believe the key to all of this price rotation is the $50.50 level and what price does over the next 30 to 60+ days. There is a potential that price may attempt a brief upside move over this span of time, but the true intent of price is to move lower based on our ADL price modeling system. Therefore, we believe the downside potential is the most opportunistic for traders. The next price target based on our Fibonacci bearish price trigger level is the $45 price range.
This move could take place quickly, over the next 2 to 3 weeks on a breakdown move, or over many months. Watch the $50.50 level as that is the key. If the price falls to any level below $50.50, then we could be moving towards the $45 level or even the $40 on a big move related to global economic expectations. Otherwise, expect the price to move towards the $50.50 level over the next few weeks as this support level is key to all future moves.
As we wait for the next leg to start to move prices lower, pay attention to any upside price activity as that may present a very clear entry point for skilled technical traders.
We believe our super-cycle research and other proprietary modeling systems are suggesting that price weakness will dominate the markets for the next few months. Ride my coattails as I navigate these financial market and build wealth while others lose nearly everything they own during the next financial crisis and recession.
In short, you should be starting to get a feel of where commodities and asset class is headed for the next 8+ months. The next step is knowing when and what to buy and sell as these turning points take place, and this is the hard part. If you want someone to guide you through the next 12-24 months complete with detailed market analysis and trade alerts (entry, targets and exit price levels) join my ETF Trading Newsletter.
Chris Vermeulen
The Technical Traders
On August 6th, 2019, we posted this article suggesting that Natural Gas and Crude Oil were setting up diverging trades.
August 6th, 2019: Natural Gas and Crude Oil – Diverging Setups for Technical Traders
At that time, we wrote that we expected Crude oil to break lower from the $62 ppb level and target $55, then $49 based on our original Crude Oil research from May 21, 2019.
Additionally, on July 29, 2019, we authored and posted this article suggesting that Crude Oil would begin a downside move from $55 to levels near $50 :
All of this research was related to our Adaptive Dynamic Learning (ADL) research post from July 10, 2019: Predictive Modeling Suggest Oil Headed Much Lower by Early 2020
This incredible predictive modeling research suggested that Oil would move dramatically lower towards the $50 level, then stall near $50 to $55+ through September and October. Ultimately breaking lower in late October/November to levels near or below $40.
Crude Oil Daily Chart Analysis
Our researchers believe Crude Oil could become very volatile as price nears the apex of the Pennant/Flag formation that is setting up. This Daily chart highlights the attempted “scouting party” price rotation above the price resistance channel. The news over the past holiday weekend suggests the global economy may not see any real bump in activity over the next 12+ months and we believe this aligns with our longer-term research that Oil should target the sub $40 price level before the end of 2019 and potentially fall to levels below $30 in early 2020.
Crude Oil Weekly Chart Analysis
We believe the key to all of this price rotation is the $50.50 level and what price does over the next 30 to 60+ days. There is a potential that price may attempt a brief upside move over this span of time, but the true intent of price is to move lower based on our ADL price modeling system. Therefore, we believe the downside potential is the most opportunistic for traders. The next price target based on our Fibonacci bearish price trigger level is the $45 price range.
Concluding Thoughts
This move could take place quickly, over the next 2 to 3 weeks on a breakdown move, or over many months. Watch the $50.50 level as that is the key. If the price falls to any level below $50.50, then we could be moving towards the $45 level or even the $40 on a big move related to global economic expectations. Otherwise, expect the price to move towards the $50.50 level over the next few weeks as this support level is key to all future moves.
As we wait for the next leg to start to move prices lower, pay attention to any upside price activity as that may present a very clear entry point for skilled technical traders.
We believe our super-cycle research and other proprietary modeling systems are suggesting that price weakness will dominate the markets for the next few months. Ride my coattails as I navigate these financial market and build wealth while others lose nearly everything they own during the next financial crisis and recession.
In short, you should be starting to get a feel of where commodities and asset class is headed for the next 8+ months. The next step is knowing when and what to buy and sell as these turning points take place, and this is the hard part. If you want someone to guide you through the next 12-24 months complete with detailed market analysis and trade alerts (entry, targets and exit price levels) join my ETF Trading Newsletter.
Free Gold or Silver with Subscription!
Chris Vermeulen
The Technical Traders
Labels:
Chris Vermeulen,
Crude Oil,
ETFs,
Fibonacci,
Gold,
Silver,
stocks,
The Technical Traders
Monday, July 29, 2019
Energy Sets Up Two New Trades - Here They Are
Before we discuss these incredible trade setups in the Energy sector, we have to discuss the continued shifting global economy and how that relates to these setups. Nearly three weeks ago, we posted a research article suggesting Crude Oil would call to levels near $50 over the next 30+ days, then stall for about 45 days before falling further and potentially attempting new lows near $40 ppb. It is important to understand certain aspects of the global economy, economic demand and how it relates to seasonal patterns for Energy.
We believe the move lower is Crude Oil is related to a supply glut that continues to plague the global markets while global economic trade, shipping, and activity continue to weaken. Too much oil supply with weakening global economic activity means Crude Oil will likely waffle lower until this dynamic changes.
Please read our recent research post to know where Crude Oil is likely to head next. Also this crude oil, prediction uses our oil price DNA algorithm to show us the future price range of oil.
Other energy related symbols, like Natural Gas and ERY, are set up for a different type of price move.
The reality of the situation is that once Crude Oil reaches to levels near $50 ppb, it is very likely that a support level will push Crude back higher (as we suggest in our research) which will align with a seasonal pattern for Natural Gas and early Winter demand for heating oil. September, October, and November are typically a ramp up period for winter demand and end of year holiday travel. People tend to take advantage of the last bit of Summer to seek out vacation spots, prepare for winter and push the cold back as long as possible.
Future contracts may move higher, in preparation of this seasonal trend, many months before the season actually starts. This is the reason we believe the energy sector is setting up some incredible opportunities for skilled technical traders.
This first Weekly chart of Natural Gas highlights a basing pattern that we’ve been following for months. We believe any move below $2.30 is a strong bottoming/basing setup for skilled traders and our predictive modeling systems suggest we are just weeks (3 to 5+) away from a big upside move in NG.
We believe natural gas will continue to fall and base. Once a bottom has been made the upside potential for NG over the next 60+ days is quite substantial. We believe an in initial upside move after it bottoms will be to levels above $3.15 will take place before October 10 and that potential for an extreme breakout upside move above $4.00 is quite likely before the end of November 2019.
Please read this article to learn more about our research into NG and the opportunities that are setting up now. Also, this post we shared Natural Gas Moves Into Basing Zone.
Keeping in mind that the setup within the energy sector is two fold. First, Oil and NG will continue to fall and base/bottom (moving slightly lower over the next few weeks). This is why ERY is such a great setup right now. Any breakdown in energy commodity prices over the next 3-5 weeks will push ERY 15% to 25% higher from current levels – which is exactly what we are expecting to happen.
Then, as Crude Oil and Natural Gas base in their support zones, ERY will peak which is when we want to pull profits from ERY and watch other bullish energy ETFs for long side setups.
From current levels, we believe ERY will target $50 to $52.50 fairly quickly as Crude Oil and NG continue to move lower and setup a momentum base within the basing zone/support range. Remember Crude Oil should move to levels near $50 (a full 10% lower than current price levels) before basing.
As we’ve been suggesting for months, 2019 and 2020 are setting up to be incredible years for skilled technical traders. These moves in commodities, energy, and metals are providing us with trade after trade of 10%, 20% or more. Almost every month, the markets are setting up 10 to 15+ incredible trading opportunities and all we have to do is time our entries and run these trades as we do any other trade. Not all trade setups are the kind we like and we only enter the ones that we think have the highest opportunity and lowest risk.
Get ready because these incredible setups in Metals and Energy should keep you busy pulling the trigger to create profits over the next 5+ months or longer with my Wealth Building & Global Financial Reset Newsletter.
Join me with a 1 or 2 year subscription to lock in the lowest rate possible and ride my coattails as I navigate these financial market and build wealth while others lose nearly everything they own during the next financial crisis.
Join Now and Get a 1oz Silver Round or Gold Bar Shipped To You Free. Follow our research and visit The Technical Traders to learn how we can help you find and execute better trades.
Chris Vermeulen
The Technical Traders
We believe the move lower is Crude Oil is related to a supply glut that continues to plague the global markets while global economic trade, shipping, and activity continue to weaken. Too much oil supply with weakening global economic activity means Crude Oil will likely waffle lower until this dynamic changes.
Please read our recent research post to know where Crude Oil is likely to head next. Also this crude oil, prediction uses our oil price DNA algorithm to show us the future price range of oil.
Other energy related symbols, like Natural Gas and ERY, are set up for a different type of price move.
The reality of the situation is that once Crude Oil reaches to levels near $50 ppb, it is very likely that a support level will push Crude back higher (as we suggest in our research) which will align with a seasonal pattern for Natural Gas and early Winter demand for heating oil. September, October, and November are typically a ramp up period for winter demand and end of year holiday travel. People tend to take advantage of the last bit of Summer to seek out vacation spots, prepare for winter and push the cold back as long as possible.
Future contracts may move higher, in preparation of this seasonal trend, many months before the season actually starts. This is the reason we believe the energy sector is setting up some incredible opportunities for skilled technical traders.
The Weekly Chart of Natural Gas
This first Weekly chart of Natural Gas highlights a basing pattern that we’ve been following for months. We believe any move below $2.30 is a strong bottoming/basing setup for skilled traders and our predictive modeling systems suggest we are just weeks (3 to 5+) away from a big upside move in NG.
We believe natural gas will continue to fall and base. Once a bottom has been made the upside potential for NG over the next 60+ days is quite substantial. We believe an in initial upside move after it bottoms will be to levels above $3.15 will take place before October 10 and that potential for an extreme breakout upside move above $4.00 is quite likely before the end of November 2019.
Please read this article to learn more about our research into NG and the opportunities that are setting up now. Also, this post we shared Natural Gas Moves Into Basing Zone.
ERY – Bear Energy Sector Chart
Keeping in mind that the setup within the energy sector is two fold. First, Oil and NG will continue to fall and base/bottom (moving slightly lower over the next few weeks). This is why ERY is such a great setup right now. Any breakdown in energy commodity prices over the next 3-5 weeks will push ERY 15% to 25% higher from current levels – which is exactly what we are expecting to happen.
Then, as Crude Oil and Natural Gas base in their support zones, ERY will peak which is when we want to pull profits from ERY and watch other bullish energy ETFs for long side setups.
From current levels, we believe ERY will target $50 to $52.50 fairly quickly as Crude Oil and NG continue to move lower and setup a momentum base within the basing zone/support range. Remember Crude Oil should move to levels near $50 (a full 10% lower than current price levels) before basing.
Concluding Thoughts
As we’ve been suggesting for months, 2019 and 2020 are setting up to be incredible years for skilled technical traders. These moves in commodities, energy, and metals are providing us with trade after trade of 10%, 20% or more. Almost every month, the markets are setting up 10 to 15+ incredible trading opportunities and all we have to do is time our entries and run these trades as we do any other trade. Not all trade setups are the kind we like and we only enter the ones that we think have the highest opportunity and lowest risk.
Get ready because these incredible setups in Metals and Energy should keep you busy pulling the trigger to create profits over the next 5+ months or longer with my Wealth Building & Global Financial Reset Newsletter.
Join me with a 1 or 2 year subscription to lock in the lowest rate possible and ride my coattails as I navigate these financial market and build wealth while others lose nearly everything they own during the next financial crisis.
Join Now and Get a 1oz Silver Round or Gold Bar Shipped To You Free. Follow our research and visit The Technical Traders to learn how we can help you find and execute better trades.
Chris Vermeulen
The Technical Traders
Subscribe to:
Posts (Atom)


