Showing posts with label SP500. Show all posts

Monday, October 11, 2021

Where The SP500 Is Headed Next Week

Everyone wishes they knew where the stock market was going to go next. What sector is going to rally? When is the subsequent market sell off? When and where to put your money to work are the questions strive to figure out. Nothing is perfect. You cannot predict the future, but if you follow something close enough, you can get a good feeling of where it’s headed next, based on what it has recently been doing.

There are two moving averages here, the 50 day and the 20 day moving average. When the price is above these moving averages in general, and they’re sloping upwards, this means the market is most likely going to continue to trend higher.

When the price is sloping down, the price is below the moving average, and the 20 day moving average is below the 50 day, just what the market is doing this week; this tells us that there’s actually a mixed market signal. The market is struggling and in a new. As the saying goes, “the trend is your friend,” so it’s always best to trade with the market trend for the chart time frame you are following....Continue Reading Here


Stock & ETF Trading Signals

Wednesday, March 17, 2021

Are The U.S. Markets Sending a Warning Sign?

After an incredible rally phase that initiated just one day before the US elections in November 2020, we’ve seen certain sectors rally extensively. Are the markets starting to warn us that this rally phase may be stalling? We noticed very early that some of the strongest sectors appear to be moderately weaker on the first day of trading this week. Is it because of Triple-Witching this week (Friday, March 19, 2021)? Or is it because the Treasury Yields continue to move slowly higher? What’s really happening right now and should traders/investors be cautious?

The following XLF Weekly chart shows how the Financial sector rallied above the upper YELLOW price channel, which was set from the 2018 and pre COVID-19 2020 highs. Early 2021 was very good for the financial sector overall, we saw a 40%+ rally in this over just 6 months on expectations that the US economy would transition into a growth phase as the new COVID vaccines are introduced.

We are also concerned about an early TWEEZERS TOP pattern that has set up early this week. If price continues to move lower as we progress through futures contract expiration week, FOMC, and other data this week, then we may see some strong resistance setting up near $35.25. Have the markets gotten ahead of themselves recently? Could we be setting up for a moderately deeper pullback in price soon?....Read More Here.

Tuesday, January 26, 2021

Technology & Energy Sectors Are Hot – Are You Missing Out?

One of the biggest movers over the past few months has been the recovery of the Oil/Gas/Energy sector after quite a bit of sideways/lower price trending. You can see from this XOP chart, below, a 44% upside price rally has taken place since early November, and XOP has recently rotated moderately downward – setting up another potential trade setup if this rally continues. Traders know, the trend if your friend. Another upside price swing in the XOP, above $72, would suggest this rally mode is continuing.

Recently, we published a research article suggesting a lower U.S. Dollar would prompt major sector rotations in the US and global markets where we highlighted the fact that the Materials, Industrials, Technology, and Discretionary sectors had been the hottest sectors of the past 180 days, but the Energy, Financials, Materials, and Industrials had shown the best strength over the past 90 days....Read More Here.


Wednesday, January 20, 2021

U.S. Dollar Decline Creates New Sector Opportunities to Trade

The weakness in the U.S. Dollar, which initiated after the Covid-19 peak in March 2020, has entered an extended downward price trend which is nearing a key support level near 88.33. One key consequence of a weakness in the U.S. Dollar is that other foreign currencies become comparatively stronger.

This transitional currency valuation phase creates an environment where localized foreign investments may become much more opportunistic than the U.S. stock market/sectors. Simply put, foreign investors will suddenly start to realize they are losing alpha in U.S. Dollar based investments compared to stronger, foreign currency based investments over time and move their capital.

Find out what this means for the US stock markets in my latest research report....Read More Here.


Saturday, October 3, 2020

Massive Dark Cloud Cover Pattern Above Critical Support - Will It Hold?

Research Highlights.... 
  • A Dark Cloud Cover pattern is a Japanese Candlestick Pattern that is typically associated with major top setups.
  • Critical Support on the SPY highlighted by multiple technical analysis strategies suggests 335~335.25 is acting as a major support level.
  • If price stays below the $339.95 level, then we interpret the trend as being Bearish. If price moves above the $343.55 level, it is Bullish.
Critical Support on the SPY (SPDR S&P500 ETF) highlighted by multiple technical analysis strategies suggests 335 - 335.25 is acting as a major support level. The rally in the markets that started late Sunday and carried forward into early trading on Monday, September 28, 2020, suggests the market is attempting to rally above this support level to establish a potential momentum base. 

My advanced price modeling systems and Fibonacci Price Amplitude Arcs (originating from the 2009 bottom) have clearly identified this area as a critical resistance/support zone....Continue Reading Here. 


Stock & ETF Trading Signals

Monday, July 20, 2020

U.S. Stock Market Stalls Near a Double Peak

The U.S. stock market stalled early this week as earnings started to hit. A number of news and other items are pending with earnings just starting to roll in. There have been some big numbers posted from JP Morgan and Goldman Sachs. Yet, the markets have reacted rather muted to these blowout revenues.

We believe this is a technical “Double Top” set up in the making. The NASDAQ has been much weaker than the S&P and the Dow Industrials. We believe the US stock market is reacting to the reality of earnings and forward guidance after the recent rally in price levels over the past 9+ weeks. If we are correct and this Double-Top pushes price levels lower, then this technical resistance level may become the price ceiling headed into Q3 and Q4 2020.

Let's start with the E-MINI S&P 500 Weekly Chart....Continue Reading Here


Friday, July 3, 2020

Wild Volatility Continues as U.S. Markets Attempt to Establish New Trend

We’ve continued to attempt to warn investors of the risks ahead for the U.S. and global markets by generating these research posts and by providing very clear data supporting our conclusions. Throughout the entire months of May and June, we’ve seen various economic data points report very mixed results – and in some cases, surprise numbers as a result of the deep economic collapse related to the COVID-19 virus event. This research post should help to clear things up going forward for most traders/investors.

As technical traders, we attempt to digest these economic data factors into technical and price analysis while determining where and what to trade. We attempt to identify the “Best Asset Now” (BAN) for trading based on our proprietary technical analysis and predictive modeling tools. We also attempt to stay away from excessive risks in the markets. The reason we adopt this strategy is to help protect assets and to attempt to assist our clients and followers in avoiding sometimes foolish trading decisions that can destroy your account and future.....Read More Here


Stock & ETF Trading Signals

Tuesday, May 5, 2020

I Truly Think This is the Best $149 You Will Ever Spend

If you have been following me for a while, then you know my analysis and trades are the real deal. You also would know that I made over $1.9 million from the financial markets during the 2008 crash and recover into 2010. I have been semi-retired since the age of 27. I continue to follow, predict, and trade the markets because its the ultimate business and my passion.

A bear market and its recovery can make your rich in a very short period. I believe this is about to happen again, so why not follow my super simple SP500 ETF investing strategy? Trade with your investment account and become a stock market success with me!

I'm offering my investing signals for the next few years to those who want to know their investment capital is in the asset. Let face it, there is a time to be 100% long stocks, to own an inverse fund, and when to sit in cash. Your financial advisor would NEVER recommend a cash position, why because he is not allowed, he and his firm will not make money. Instead, they will keep you long stocks, with some bonds, and you will have to ride out the bear market rollercoaster again.

During the March Market crash, the BEST position was cash for short term trades. EVERY asset fell in value (stocks, bonds, gold, commodities) two months ago. Only one asset rallied, guess what it was? The USD dollar (CASH), moving to USD cash, gained a whopping 11% while most indexes and sectors fell 35-80+%. All you had to do was close all positions in your portfolio, and you would have looked like a hero, and that's what I did with my account and members of my swing trading newsletter.

Follow me to success. Trade my most simple single ETF strategy and know when to own stocks, when to own an inverse ETF, or be in cash. For only $149 you can have the keys to the kingdom during a time when we are going to experience more historical price swings. This is as good as it gets, in my opinion.

Even if we don't enter a new bear market this year, my investing signals will still nail the bull market and make you a ton of money. This is the most affordable insurance plan for your retirement account, so you don't lose it - Period!


Sincerely,
Chris Vermeulen
Founder of The Technical Traders 


Stock & ETF Trading Signals

Sunday, March 29, 2020

Three Charts Every Trader and Investor Must See

Understanding the stock market and its potential through the use of technical analysis and historical price events has been proven repeatedly to outperform all forms of fundamental trading styles. The following is a story that walks you through my experience, the shift in my mindset and how I came to the conclusion that the three charts I share in this article are critical to your understanding of to make money in today’s market!

When I first learned to trade, I got all caught up with researching companies and finding the ones with the best earnings and future growth. I did that for several years after studying and following many “professional traders” who said it was the best way to trade and invest long term. We lost our shirts during the 2000 bear market by continuing to trade on fundamentals as stocks fell in value week after week. Even the companies that showed quarterly earnings growth fell in value – none of it seemed to make any sense to me, and it was very frustrating.

Losing money when buying the best companies made no logical sense, making me step back from the markets and ask myself, ‘what am I doing wrong here‘. People today are asking themselves the same question given today’s dizzying markets:

· Telsa shares fell from $971 a share down to $347, whopping 63% drop, in only a few weeks and then rebounded again too xx

· Netflix is down 30%, even though people are stuck at home desperately trying to find things to watch)

· Amazon has fallen 26% in the past couple of weeks despite soaring demand for their delivery services

· GDXJ, the gold miners sector that is typically a safe haven during times of volatility, crashed 57% even though gold is usually a safe haven during times of volatility.

So, what was I doing wrong? I started calling and visiting traders who were making money during the bear market to see what they were doing, and 100% of them were doing the same thing – Trading with Technical Analysis. I wasn’t doing anything wrong, per se. I was simply using the wrong tools and analysis for success!

What is Technical Analysis? In short, it’s the study of price, time, and volatility of any asset using price charts and indicators. Traders use technical analysis to find cycles and patterns in the market and trade on the analysis of preferred indicators as opposed to the fundamentals of a company and/or the economy in general.

When you start studying technical traders, you will notice every trader has a particular time frame, a preferred set of indicators, and trading frequency that fits their unique personality and lifestyle. Their brains can see the charts in ways you and I may not see them to predict future price direction over the next few hours, days, weeks, or months ahead. I quickly learned there are infinite ways to trade using technical analysis.

I was very surprised by how much these pro traders allowed me. While standing over their shoulders, I was looking at their charts to try to divine their high-level strategies and learn how they think, analyze, and trade. It was amazing how different each of them traded the market. Some traded currencies; others traded stocks, indexes, options, futures, etc. Most were day traders, swing traders, or a mix of the two. But none of them gave me their secret sauce. That is why I turned 100% of my focus to technical analysis. I was excited at the prospect of being able to profit from both rising and falling prices and no concern for anything other than price action reduced my research time dramatically. It was and is the biggest AH-HA moment of my life and a turning point for my career as a trader.

The year was 2001, when I made the shift to technical analysis. I unsubscribed from everything fundamental based. I canceled my CNBC, stopped listening to news, and stopped reading other people’s reports altogether. My goal was to create my own technical trading strategy that best suited my personality and lifestyle. I would have to discover the securities I was most comfortable trading, the frequency I would trade, and the type and amount of risk I was prepared to take.

I traded options, covered-calls, currencies, stocks, ETFs, and futures. From day trading to position trading (holding several months), I tried it all, hoping something would click for me to pursue at a much deeper level. Day trading, momentum, and swing trading were my sweet spots. Having three of them was a bonus as I know some traders only ever master one in their lifetime if they are lucky. I grew a liking for trading the major indexes like the DJIA, S&P 500, and Nasdaq… great liquidity with big money always at play.

Along my journey, I realized that if I could predict the overall market trend direction for the day or week, then I could day trade small cap stocks in the same direction as the index, knowing 80+% of the stocks follow the general stock market trend. I could generate much larger gains in a very short period of time. As time went on, I became comfortable predicting, trading, and profiting from the indexes, and my new trading strategy began to emerge.

I was fortunate enough to start learning about the markets and trading in college with a $2,000 E-Trade account, and then retiring (kinda) in 2009 at the age of 28. I built my dream home on the water, bought cars and boats, and spent time traveling with my growing family. I love trading and sharing my analysis with others – it is better than I had ever imagined and why I continue to help thousands of traders around the world every day with these video courses Trading System Mastery, and Trading As Your Business.

I contribute 100% of my trading success and lifestyle to the fact that I embraced technical analysis, where my strategy involves nothing more than price movement, position-sizing, and trade risk management techniques. All these allow me to easily reduce exposure, drawdowns, and losses with proper position sizing and protective strategies. If you want quick and simple, read about my journey and core trading tools in my book Technical Trading Mastery – 7 Steps to Win with Logic. My strategy is represented by human psychology and historical trading, as expressed in the three charts below.

Chart 1 – Human Psychology is What Drives Price Action

This chart is my favorite as it explains trader and investor psychology at various market stages. It also includes a simplified market cycle in the upper right corner, letting you know where the maximum financial risk is for investors and the highest opportunity for a trade.


Chart 2 – 2000 Stock Market Top & Bear Market That Followed

The chart may look a little overwhelming, but look at each part and compare it to the market psychology chart above. What happened in 2000 is what I feel is happening this year with the stock market sell-off.

In 2000, all market participants learned of at the same time was that there were no earnings coming from their darling .com stocks. Knowing they were not going to make money for a long time, everyone started selling these terrible stocks, and the market collapsed 40% very quickly.

What is similar between 2000 and 2020? Simple really. COVID-19 virus has halted a huge portion of business activity, travel, purchases, sporting events, etc. Everyone knows earnings are going to be poor, and many companies are going to go bankrupt. It is blatantly clear to everyone this is bad and will be for at least 6-12 months in corporate earnings; therefore, everyone is in a rush to sell their stock shares and are in a panic to unload them before everyone does.


Chart 3 – The 2020 Stock Market Top Looks to Be Unfolding

As you can see, this chart below of this year’s market crash is VERY similar to that of 2000 thus far, it’s based on a similar mindset, which is the fear of losing money, which causes everyone to sell their positions.

I am hopeful that we get a 25-30% rally from these lows before the market starts to fall and continue the new bear market, which I believe we are entering. Only the price will confirm the direction and major trend to follow, and since we follow price action and do not pick tops or bottoms, all we have to do is watch, learn, and trade when price favors new low risk, high reward trade setups.

It does not matter which way the market crashes from here, we will either profit from the next leg down, or will miss/avoid it depending on if we get a tradable setup. Either cause is a win, just one makes money, while the worst case scenario just preserves capital in a cash position, you can’t complain either way if you ask me.


Before you continue, be sure to opt-in to our free market trend signals before closing this page, so you don’t miss our next special report!

Concluding Thoughts

In short, is if you lost money during the recent market crash, then you likely have not mastered a technical trading strategy and do not have proper trade management rules in place. All traders must manage risk and trades to be sure you lock in profits and limit losses when prices start pullback or collapse. Without either of these, you will not be able to achieve long term success/gains, and that’s a fact.

While we can all make money during a bull market when stocks are rising, if you cannot retain or grow your account during market downturns, then you may as well be a passive buy and hold investors. You are better at riding the emotional investor rollercoaster without wasting your time and effort as a trader if you are not going to spend the time and money to learn to follow someone to become a successful trader. Without proven trading strategies or someone to follow, you are more likely to underperform a long term passive investor.

I get dozens of emails from people every week trying to trade this wild stock market and use leveraged ETFs, which doing so during these unprecedented market conditions is absolute craziness if you ask me.

These people think that because there are big moves in the market, they should be trading. That big money should be made trading them, which drives me crazy because it could not be further from the truth unless you are a scalp or day trader. To me, in this market condition, it’s about preserving capital, not risking it, in my opinion.

A subscriber to my market video analysis and ETF trading newsletter said it perfectly:

“Always intrigues me how many amateur surfers get to the north shore beaches in Hawaii, take one look at monster waves and conclude it’s way too dangerous. Yet the amateur trader looks at treacherous markets like these and wants to dive right in!!” Richard P.

I have to toot my own horn here a little because subscribers and I had our trading accounts close at a new high watermark for our accounts. We not only exited the equities market as it started to roll over we profited from the sell off in a very controlled way.

I hope you found this informative, and if you would like to get a pre-market video every day before the opening bell, along with my trade alerts, visit my ETF swing trading visit my website at The Technical Traders.

Chris Vermeulen
Founder of The Technical Traders 



Stock & ETF Trading Signals

Friday, February 14, 2020

2020 - A Close Look at What to Expect

Quite a bit has changed in the global markets and future expectations over the past 4+ weeks. Q4 2019 ended with a bang. U.S./China Trade Deal, U.S. signing the USMCA Continental Free Trade Agreement, BREXIT and now the Wuhan Virus. On top of all of that, we’ve learned that Germany and Japan have entered a technical recession. As Q4-2019 earnings continue to push the U.S. stock market higher – what should traders expect going forward in 2020?

Volatility, Sector Rotation, and Continued U.S. Stock Market Strength.

Our researchers have been pouring over our charts and predictive modeling tools to attempt to identify any signs of weakness or major price rotation. There are early warning signs that the US Stock Market may be setting up for a moderate downside price rotation within the first 6 months of 2020, but we believe the continued Capital Shift that has been taking place over the past 24+ months will continue to drive foreign investment into the U.S. and North American stock markets for quite a while in 2020 and 2021.

The interesting component to all of this, which should keep investor’s attention and really get them excited, is the chance that some type of foreign market disruption may take place in 2020 and 2021. There are a number of things that could potentially disrupt foreign market expectations.

First on the list is this virus event in China (that seems to be spreading rapidly). Second would be the news that Japan and Germany have entered a recession. Further down the list is the very real possibility that many Asian and foreign nations could see a dramatic decrease in GDP and economic activity throughout much of 2020 and 2021.

It is far too early to make any real predictions, but traders need to be aware of the longer term consequences of global markets entering a contraction phase related to a confluence of events that prompts central bank intervention while consumers, financial sectors and manufacturing and industrial sectors are pummeled. Imagine what the global markets would look like if 25% to 55% of Asia, Europe, and Africa see a dramatic decrease in economic output, GDP and financial sector activities (on top of the potential for massive loan defaults). It may spark another Credit Crisis Event – this time throughout the Emerging and Foreign markets.

A massive surge in U.S. stock market valuation has taken place since the start of 2020. It is very likely that foreign capital poured into the U.S. stock market expecting continued price advancement and very strong earnings from Q4 2019. This valuation appreciation really started to take place in early 2019 and continued throughout the past 14+ months. We believe this valuation appreciation is foreign capital dumping into the U.S. markets to chasing the strong U.S. economic expectations.

We believe this surge into the U.S. stock markets will continue until something changes future expectations. The U.S. Presidential election cycle would usually be enough to cause some sideways trading in the U.S. stock market – maybe not this time.

The fact that Japan and Germany, as well as China very soon, have entered an economic recession would usually be enough to cause some sideways price rotation in the U.S. stock market – maybe not this time. The potential widespread economic contraction related to the Wuhan virus would normally be enough to cause some contraction or sideways trading in the U.S. stock market – maybe not this time.

There is still a risk that price could revert to middle or lower price channel levels at any time in the future. We’ve highlighted these levels on the charts below. Yet, we have to caution traders that the foreign markets may be setting up for one of the largest capital shift events in recent history. If any of these contagion events roil the foreign markets while the U.S. economic activity and data continue to perform well, then we could be setting up for a massive shift away from risky foreign markets/emerging markets and watch global capital pour into Safe-Havens (metals/miners) and pour into the U.S. stock market (U.S., Canada, Mexico).

We’ve authored numerous articles about how the foreign markets gorged themselves on debt after 2009 while easy money policies allowed them to borrow U.S. dollars very cheaply. We’ve highlighted how this debt is now hanging over these corporations, manufacturers and investors heads as a liability. The recent REPO market activity suggests liquidity risks already exist in the global markets. If these liquidity issues extend further, we could see a much broader market rotation within the U.S. and foreign markets.

Dow Jones Industrial Average – Quarterly Chart

Currently, the U.S. stock market appears to be near the upper range of a defined price channel. Near these levels, it is not uncommon to see some downside price rotation to set up a new price advance within the price channels. This INDU chart highlights the extended price channel trend, originating from 2008, and the more recent price channel (yellow) originating from 2015. Any breakdown of these channels could prompt a much broader downside price move.


SP500 – Quarterly Chart

This SPY chart highlights the extended upside price trend in the US stock markets. The SPY has recently breached the upper price channel level. It may be setting up a new faster price channel, yet we believe this rally in early Q1 2020 is more of a reaction to the very strong 2019 US economic data and the continued capital shift pouring capital into the U.S. markets. A correction from these levels to near $275 would not be out of the question.


Transportation Sector – Quarterly Chart

This Transportation Index (TRAN) chart presents a very clear price channel and shows a moderate weakness recently in this sector. The fact that the TRAN has consolidated into a middle range of the price channel while the other US stock market indexes continue to push higher suggests the valuation advance in the U.S. stock market is mostly “capital chasing strength of the U.S. economy” than a true economic expansion event.


2020 will likely continue to see more volatility, more price rotation, more US stock market strength and further risks of a reversion event. We believe forward guidance for Q1 and Q2 will be revised lower as a result of these new global economic conditions originating from Asia, Europe, and Japan.

If the virus event spreads into Africa and the Middle East (think Belt-Road), then we could see a much broader correction event. In the meantime, prepare for weaker future earnings related to the shut down of industry and consumer sectors throughout much of Asia.

If this “shut down” type of quarantining process extends throughout other areas of the world, then we need to start to expect a much broader economic contraction event. Minor events can be absorbed by the broader markets. Major events where global economies contract for many months or quarters can present a very dangerous event for investors.

Overall, we may see another 20 to 40+ days of “sliding higher” in the U.S. stock market before we see any real risks become present for investors. This means you should start preparing for any potential unknowns right now. Plan accordingly as this event will likely result in a sudden and potentially violent change in price trend.

Join my Swing Trading ETF Wealth Building Newsletter if you like what you read here and ride my coattails as I navigate these financial markets and build wealth while others lose nearly everything they own.

Chris Vermeulen
The Technical Traders


Stock & ETF Trading Signals

Friday, November 29, 2019

100% Measured Moves May Signal a Top

One type of Fibonacci price structure we use to attempt to measure price trends and identify potential tops/bottoms is the “100% Measured Move” structure. This is a price structure where a previous price move is almost perfectly replicated in a subsequent price trend after a brief period of retracement or price correction. These types of patterns happen all the time in various forms across multitudes of symbols to create very solid trading signals for those that are capable of identifying trends and opportunities using this technique. If you want my daily analysis and trade ideas, be sure to get my updates by joining my free trend signals email list.

The first thing we look for is a strong price trend or the initially confirmed reversal of a price trend. We find that these trending price ranges and initial “impulse trends” tend to prompt 100% measured moves fairly accurately. The explosive middle trend is where one can’t assume any type of Fibonacci 100% measured move will happen. Those explosive moves in a trend that tend to happen in the middle of a price trend are what we call the “expansion wave” of a trend and will typically be 160% or more the size of the initial impulse trend.

These trade setups we call the “100% measured moves” are naturally occurring price rotations that skilled traders can use to identify strong trade potential setups. They are more common in rotating markets where a moderate trend bias is in place (for example in the current YM or ES chart).

First, let’s take a look at this YM Weekly Chart to highlight the most recent 100% Measured Move. The original upside price move between June 2019 and July 2019 resulted in a 2787 point price rally that replicated between August 2019 and November 2019 – after a brief price retracement. Currently, price is rotating near the peak of this 100% measured price move near 27,875 while attempting to set up a new price trend.


In this ES Weekly example chart, we see a 100% Measured Move that originated in June 2019 and ended in July 2019 – just like on the YM chart. Although the completion of the 100% measured move didn’t originate until the low that formed before price rallied to take out the previous high near 3029.50. Remember, the other facets of Fibonacci price theory are also still at play in the markets while these 100% Measured Moves are taking place. Thus, rotation between a previous price peak and valley (without establishing any new price highs or new price low) are considered “price rotation” – not trending. The 100% Measured Move that did take place recently did complete a full 100% advancement and is now stalling near the 3040 level peak.


If you are not familiar with some of my forecasting and trading strategies for trading the S&P 500, or my gold trading signals be sure to click those links to see some pretty interesting charts like these.

SP500 Index Trend Identification and Trade Signal System


Cycle and Price Prediction System


Concluding Thoughts

Once these 100% measured moves complete, price usually attempts to stall or wash out a bit before attempting to establish a new price trend. At this point, given the examples we’ve illustrated, we believe the US market will enter a period of rotation and moderate volatility as these 100% measured moves have completed the upside price advance for now. Some level of price rotation after these 100% measured moves have completed will potentially allow for another attempt at a future 100% price advance after setting up a new price leg.

These techniques don’t always work, we recently got stopped out on a TVIX (vix/volatility trade for a loss) but we just close out our thirst natural gas trade for a quick 7% profit. The previous UGAZ trade netted 20%, and the one before that was 7.95%.

I can tell you that huge moves are about to start unfolding not only in metals, but stocks, and currencies. Some of these supercycles are going to last years. Brad Matheny goes into great detail with his simple to understand charts and guide about this. His financial market research is one of a kind and a real eye-opener. PDF guide: 2020 Cycles – The Greatest Opportunity Of Your Lifetime

As a technical analysis and trader since 1997, I have been through a few bull/bear market cycles. I believe I have a good pulse on the market and timing key turning points for both short term swing trading and long term investment capital. The opportunities are massive/life changing if handled properly.

I urge you to visit my Wealth Building Newsletter and if you like what I offer, join me with the 1 or 2 year subscription to lock in the lowest rate possible with our BLACK FRIDAY offer, PLUS get a FREE BAR OF GOLD and ride my coattails as I navigate these financial markets and build wealth while others lose nearly everything they own during the next set of crisis’.

Chris Vermeulen
The Technical Traders


Stock & ETF Trading Signals

Monday, October 21, 2019

Revisiting Black Monday 1987

Back in the day, for those of you that are old enough to remember and have experienced one of the most incredible trader psychology driven stock market decline in recent history. The difference between “Black Monday” and most of the other recent stock market declines is that October 19, 1987, was driven by a true psychological panic, what we consider true price exploration, after an incredible price rally.

It is different than the DOT COM (2001) decline and vastly different than the Credit Market Crisis (2008-09) because both of those events were related to true fundamental and technical evaluations. In both of those instances, prices have been rising for quite some time, but the underlying fundamentals of the economics of the markets collapsed and the markets collapsed with future expectations. Before we get too deep, be sure to opt-in to our free market trend signals newsletter.

Our researchers believe the setup prior to the Black Monday collapse is strangely similar to the current setup across the global markets. In 1982, Ronald Reagan was elected into his second term as the US President. Since his election in 1980, the US stock market has risen over 300% by August 1987.

Reagan, much like President Trump, was elected after a long period of U.S. economic malaise and ushered in an economic boom cycle that really began to accelerate near August 1983 – near the end of his first term. The expansion from the lows of 1982, near 102.20, to the highs of 1987, near 337.90, in the S&P 500 prompted an incredible rally in the US markets for all global investors.


This is very similar to what has happened since 2015/16 in the markets and particularly after the November 2016 elections when the S&P500 bottomed near 1807.5 and has recently set hew highs near 3026.20 – a 67.4% price rally in just over 3 years.

One can simply make the assumption that global investors poured capital in the US markets in 1983 to 1986 as the US markets entered a rally mode just like we suspect global investors have poured capital into the US markets after the 2016 US elections and have continued to seek value, safety, and returns in the US markets since. These incredible price rallies setup a very real potential for “true price exploration” when investors suddenly realize valuations may be out of control.

So, what actually happened on October 19th, 1987 that was different than the last few market collapse events and why is it so similar to what is happening today?

On October 19, 1987, a different set of circumstances took place. This was almost a perfect storm of sorts for the markets. The US markets had risen nearly 44% by August 1987 from the previous yearly close – a huge rally had taken place. Computer trading, which some people suspected may have been a reason for the price decline on October 19, was largely in its infancy.

Floor traders were running the show in New York and Chicago. The London markets closed early the Friday, October 16, because of a weather event that was taking place. The “setup” of these events may have played a roll in the liquidity issues that became evident on Black Monday and pushed the US markets down 22.61% by the end of trading.

The US markets had set up a top near 2,722 in early August 1987 after rising nearly 44% from the 1986 end of year closing price level of 1,895. The SPX rotated lower from this peak to set up a sideways price channel near 315 throughout the end of August and through most of September. On October 5, 1987, the SPX started a downward price move that attempted to test the lower support channel near 312. On October 12, one week later, the SPX broke below this support channel and closed at 298.10 (below the psychological 300 level). The very next weekend was October 17 & 18 – the weekend before Black Monday.


Sunday night, October 18, in the US, the Asian markets opened for trading and a price sell-off began taking place in Hong Kong. Because the London markets has closed early on the 16th due to the storm, by the time they opened the UK markets began tanking almost immediately. Early in the day on Monday, October 19, the FTSE100 had collapsed over 136 points.

Our researchers believe the declines in the US markets in early October 1987 set up a breakdown event that, once support was broken, prompted a collapse event where liquidity issues accelerated the price decline volatility – much like the “flash crash”. Global investors were unprepared for the scale and scope of the price decline event and panicked at the speed of the price collapse.

In fact, at the height of the 1987 crash, systemic problems (mostly solvency and brokerage house operations) continued to threaten a much larger financial market collapse. Within days of Black Monday, it became evident that margin accounts and solvency issues related to operating capital, large scale risks and continued fear that the markets may continue to collapse presented a very real problem for the US and for the world. Have we re-entered another Black Monday type of setup across the global markets?


As new economic data continues to suggest the global markets are economically contracting and stagnating, the US Federal Reserve has started buying assets again while the foreign central banks continue to push negative interest rates while attempting to spark any signs of real economic growth. The US stock market has continued to push higher – almost attempting new all-time highs again just recently. The US stock market is up nearly 68% over the past 3.5 years since Trump was elected and as of Friday, October 18, 2019, the US stock markets fell nearly 0.75% on economic fears.

In Part II of this article, we’ll explore the potential of another Black Monday type of setup that may be playing out before our very eyes right now in the US stock market.

As a technical analysis and trader since 1997, I have been through a few bull/bear market cycles. I believe I have a good pulse on the market and timing key turning points for both short term swing trading and long-term investment capital. The opportunities are massive/life changing if handled properly.

I urge you visit my ETF Wealth Building Newsletter and if you like what I offer, join me with the 1-year subscription to lock in the lowest rate possible and ride my coattails as I navigate these financial market and build wealth while others lose nearly everything they own during the next financial crisis.


Chris Vermeulen
The Technical Traders


Stock & ETF Trading Signals

Monday, August 26, 2019

Precious Metals ADL Predictions Getting Ready for a Big Move

This weekend we thought we would share some really important data and charts with all of you precious metals bugs/traders (like us). You probably remember our October 5th, 2018 call in Gold that has set off an incredible series of events for all of us.

We made a prediction that day that Gold would rotate higher from the $1200 level targeting the $1300 level, then stall and move lower to set up a “momentum base” near April 21st to 24th before accelerating much higher after June/July 2019. Our original research chart is shown below. But first, be sure to opt-in to our free market forecast newsletter

This incredible research targeted the $1600+ level by September/November 2019. We are only about $70 away from that level right now and we have new ADL research to share with all of our followers.


If you are a fan of our research or you can understand the value of the ADL predictive modeling system and what we have highlighted for our followers – you already know that any future ADL predictions for precious metals should be of particular interest to all of you. What are metals going to do over the next few months and how can you prepare for this move, let us help you try to prepare for this next move.

Check out these exciting charts full of opportunities that we will be sharing.

This Gold Monthly chat highlighting the ADL predictive modeling system results shows why gold traders need to be patient and wait for the next setup. That setup exists over the next 30 days as the ADL predictive modeling system is suggesting that Gold will attempt a downside price rotation to levels near $1490 before attempting another rally back above $1600. This is the next proper price rotation setup that traders need to look for. The second setup occurs in Jan/Feb 2020 where the price is expected to rotate from above $1600 to levels near $1540 before launching into another big rally to levels above $1870.

The Adaptive Dynamic Learning (ADL) predictive modeling system is one of the most incredible price modeling tools we use in our research. We’ve just shown you what our research tools believe Gold will do over the next 14+ months. We believe we are helping more traders and investors by proving our incredible research tools work better than any other technology solutions available in the market right now and are proving it by posting these types of charts many months before price can attempt to prove or disprove our research.


Now, one of the biggest moves is going to be in Silver and we’ve all been waiting for the incredible reversion of the Gold/Silver ratio. It is at that point when Silver begins to rally faster than Gold is rallying that we will see a true reversion in the Gold/Silver ratio. That event will result in an incredible rally in silver that could push the price of silver above $35 to $40 per ounce – or higher.

Our ADL predictive modeling system running on a Quarterly Silver chart highlights the opportunity that still exists for metals traders. Silver will continue to rally as Gold rolls higher. Silver will continue to rally to levels just below $20 over the next 8+months. The big breakout to the upside starts to take place Q3 2020. That move will push Silver prices to levels above $20 where a brief rotation will take place. By Q1 2021, the price of silver will be rallying extensively and the cat will be out of the bag in terms of what or why the metals are skyrocketing.


These moves in precious metals are going to be one of the most incredible opportunities for investors. There will be other swings in market sectors and major global market indexes as well. This is the time for all traders/investors to take advantage of the resources that are available to learn to take advantage of these setups. Our research team continues to deliver some of the most incredible research and predictive modeling results anyone has ever seen. If you can not see the value of being able to see 14 to 24 months into the future.

We urge you to consider finding resources and a team of researchers that can assist you over the next 12+ months as the moves in the global markets are going to be incredibly large and varied. Now is the time to take advantage of these opportunities and to find the right partners to assist you in finding the right trades.


Crucial Warning Signs About Gold, Silver, Miners and SP500

In early June I posted a detailed video explaining in showing the bottoming formation and gold and where to spot the breakout level, I also talked about crude oil reaching it upside target after a double bottom, and I called short term top in the SP 500 index. This was one of my premarket videos for members it gives you a good taste of what you can expect each and every morning before the Opening Bell. Watch Video Here.

I then posted a detailed report talking about where the next bull and bear markets are and how to identify them. This report focused mainly on the SP 500 index and the gold miners index. My charts compared the 2008 market top and bear market along with the 2019 market prices today. See Comparison Charts Here.

On June 26th I posted that silver was likely to pause for a week or two before it took another run up on June 26. This played out perfectly as well and silver is now head up to our first key price target of $17. See Silver Price Cycle and Analysis.

More recently on July 16th, I warned that the next financial crisis (bear market) was scary close, possibly just a couple weeks away. The charts I posted will make you really start to worry. See Scary Bear Market Setup Charts.

Concluding Thoughts

In short, you should be starting to get a feel of where commodities and asset class is headed for the next 8+ months. The next step is knowing when and what to buy and sell as these turning points take place, and this is the hard part. If you want someone to guide you through the next 12 - 24 months complete with detailed market analysis and trade alerts (entry, targets and exit price levels) join my ETF Trading Newsletter.

Be prepared for these incredible price swings before they happen and learn how you can identify and trade these fantastic trading opportunities in 2019, 2020, and beyond with our Wealth Building & Global Financial Reset Newsletter. You won’t want to miss this big move, folks. As you can see from our research, everything has been setting up for this move for many months.

Join me with a 1 or 2 year subscription to lock in the lowest rate possible and ride my coattails as I navigate these financial market and build wealth while others lose nearly everything they own during the next financial crisis.

As a technical analysis and trader since 1997, I have been through a few bull/bear market cycles. I believe I have a good pulse on the market and timing key turning points for both short term swing trading and long term investment capital. The opportunities starting to present themselves will be life changing if handled properly.

Free Gold or Silver with Membership!


Kill two birds with one stone and subscribe for two years to get your FREE PRECIOUS METAL and get enough trades to profit through the next metals bull market and financial crisis!

Chris Vermeulen
The Technical Traders


Stock & ETF Trading Signals

Wednesday, May 1, 2019

How Close are the Markets from Topping?

Now that most of the U.S. Major Indexes have breached new all time price highs, which we called over 5+ months ago, and many traders are starting to become concerned about how and where the markets may find resistance or begin to top, we are going to try to paint a very clear picture of the upside potential for the markets and why we believe volatility and price rotation may become a very big concern over the next few months. Our objective is to try to help you stay informed of pending market rotation and to alert you that we may be nearing a period within the US markets where increased volatility is very likely.

Longer term, many years into the future, our predictive modeling systems are suggesting this upside price swing is far from over. Our models suggest that price rotation will become a major factor over the next 12 to 15+ months – headed into the U.S. Presidential election cycle of November 2020. Our models are suggesting that the second half of this year could present an incredible opportunity for skilled investors as price volatility/rotation provide bigger price swings. Additionally, our models suggest that early 2020 will provide even more opportunity for skilled traders who are able to understand the true price structure of the markets. Get ready, thing are about to get really interesting and if you are not following our research or a member of our services, you might want to think about joining soon.

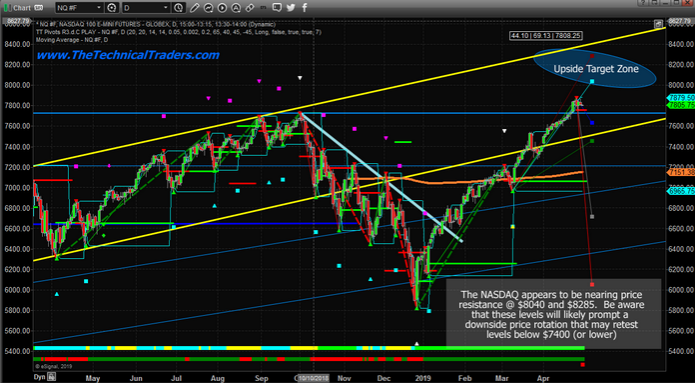
We are focusing this research post on the NQ, ES and YM futures charts (Daily). We will include a longer term YM chart near the end to highlight longer-term expectations. Let’s start with the NQ Daily chart.

The NQ Daily chart, below, highlights our ongoing research, shows the 2018 deep price rotational low and the incredible rally to new all time highs recently. The most important aspect of this chart is the “Upside Target Zone” near the $8040 level and the fact that any rally to near these levels would represent an extended upside price rally near the upper range of the YELLOW price channel lines. We believe any immediate price rotation may end near the $7500 level (between the two Fibonacci Target levels near $7400 & $7600) and could represent a pretty big increase in price volatility.


This ES Daily chart highlights the different in capabilities between the NQ and the ES. While the NQ is already pushing into fairly stronger new price highs, the ES is struggling to get above the Sept/Oct 2018 highs and this is because very strong resistance is found between $2,872 and $2,928. It is very likely that the price volatility will increase near these highs as price becomes more active in an attempt to break through this resistance. It is also very likely that a downside price rotation may happen where price attempts to retest the $2,835 level (or lower) before finally pushing into a bigger upside price trend. The Upside Target Zone highs are just below $3,000. Therefore, we believe any move above $2,960 could represent an exhaustion top type of price formation.


This YM chart is set up very similarly to the ES chart. Historical price highs are acting as a very strong price ceiling. While the NQ is already pushing into fairly stronger new price highs, the YM continues to struggle to get above the Sept/Oct 2018 highs and this is because very strong resistance is found between 25,750 and 27,000. Please take notice of the very narrow resistance channel (BOX) on this chart that highlights where we believe true price support/resistance is located. We believe it is likely that a downside price rotation may happen where price attempts to retest the $26,000 level (or lower) before finally pushing into a bigger upside price trend.


As you can tell from our recent posts and this research, we believe price volatility is about to skyrocket higher as price rotates downward. Our predictive modeling systems are suggesting that we are nearing the end of this current upside move where a downward price move will establish a new price base and allow price to, eventually, push much higher – well above current all-time high levels.

We’ve issued research posts regarding Presidential election cycles and how, generally, stock market prices decline 6 to 24 months before any US Presidential election. We believe this pattern will continue this year and we are warning our followers to be prepared at this stage of the game. No, it will not be a massive market crash like 2008-09. It will be a downside price rotation that will present incredible opportunities for skilled traders. If you want more of our specialized insight and analysis, then please visit The Technical Traders to learn how we help our members find success.

Lastly, we’ve included this Weekly YM chart to show you just how volatile the markets are right now. Pay very close attention to the Fibonacci Target Levels that are being drawn on this chart. The downside target levels range from $16,000 to $21,060. The upside target levels range from $30,000 to $32,435. Top to bottom, The Fibonacci price modeling system is suggesting a total volatility range of over $16,000 for the YM Weekly chart and this usually suggests we are about to enter a period of bigger price rotation and much higher price volatility.


Right now, we suggest that you review some of our most recent posts to see how we’ve been calling these market moves, visit The Technical Traders Free Research. It is important for all of our followers to understand the risks of being complacent right now. The markets are about to enter a period of about 24+ months where incredible opportunities will become evident for skilled traders. If you know what is going to happen, you can find opportunities everywhere. If not, you are going to be on the wrong side of some very big moves.

Chris Vermeulen


Stock & ETF Trading Signals

Monday, February 4, 2019

Two Winning Trade Setups - GDXJ and ROKU

We are not always correct in our calls about the market. Professional researchers and analysts must understand that attempting to accurately predict the future outcome of any commodity, stock, index or ETF is impossible to be 100% accurate. Yet, we are pleased that our proprietary price modeling and analysis tools continue to provide us with very clear triggers and alert us to price moves before they happen.

Today, we are sharing two recent trades we executed with our members that resulted in some decent profits. The first example is our GDXJ trade. We had been in a Long position since before the beginning of 2019 expecting Gold and Miners to rally. Our price modeling systems suggested that after price reached $1300, we may experience a brief price pause over the next 45 days or so. Thus, we pulled the profits in this trade recently to lock in 10.5% profit and to allow us to re-enter when our modeling systems suggest the price pullback has ended.


The second example is our ROKU trade. We recently pulled 8.1% profit on a partial profit target execution for our members after a nice upside momentum move. This type of trade falls into our MRM (Momentum Reversal Method) trade trigger category and is supported by a momentum resurgence price move that can typically prompt prices to move +8~30% over fairly quick periods of time (under 20 days).


For almost all traders, we’ve found that understanding general market conditions, finding suitable trading triggers/setups and staying aware of the market dynamics at play in the global markets is very hard to accomplish. This is why we offer our members a very quick and easy way for them to accomplish all of these essential components for success with their membership to Technical Traders Ltd. Wealth Trading Newsletter.

  •  Our Daily Market Video, which is typically under 10 minutes in length, covers all of the major markets, most commodities, the US Dollar, Bitcoin and many other elements of the markets.


  • Combine this video content with our detailed market research posts, which you can read by visiting The Technical Traders Free Research, allows our members to not only learn from our video content but also to begin to understand and formulate their own conclusions based on our content.


  • Lastly, we add our trading trigger/alerts feature to alert our members to superior trading setups that we find while running our proprietary trading models. We don’t post 40 trades a day hoping our members will find one or two they can make profits from. We are highly selective in our posts and attempt to only post the best opportunities for success.

Over the past couple of months, we have been developing a new members area application. It will allow you to have live access to our morning spike and gap trades and traders chatroom, our SP500 index momentum, and swing trades, plus our special MRM (Momentum Reversal Method) stock picks on small/mid-cap stocks which also all trade options so if you want to you can trade options on your own around our stock trades.

Last week we made huge progress and this week’s goals are to implement the instant and automated SMS and email alerts sent to you every time there is a new trade, stop, target hit, or we close a position. This will give you more time to see and execute the trades as needed. Keep in mind most swing trades can be entered 1-3 days after the trade alert at the same price or better price simply because we are not that perfect at timing the markets every move.

If you take a minute to review these example REAL TRADES (above) and review the information at The Technical Traders, we believe you will understand the value and resources we offer our members. Isn’t it time you found the right team of professionals to help you make 2019 an incredibly successful year?

Chris Vermeulen