Showing posts with label resistance. Show all posts

Sunday, February 7, 2021

Mid-Caps & Transportation Show Upside Targets For Next Rally

An important technical conclusion stemming from the recent volatility spike is that prices must continue to push higher, above previous highs, in order to confirm the continued upside price expectations. 

The recent volatility spike and downside rotation in the US major stock market were big enough to reset many trending systems and prompt new upside price targets. In this research article, I will share our targets on the Mid-Caps and the Transportation ETFs to show you want we expect from the potential rally.

IWM Breakout Above $218.35 Suggest Rally is Just Starting

The IWM, the Ishares Russell 2000 ETF, Daily chart highlights the recent rotation in price and shows a Fibonacci price extension range from the late December 2020 lows to the recent late January 2021 highs. I use these Fibonacci price extensions as a means of measuring potential upside or downside price targets, which seem to be fairly accurate. Watching what happens near the 61.8% level on the chart will guide us in determining if the 100% target level will be reached quickly or after a bit of consolidation....Read More Here.


Wednesday, July 22, 2020

Energy Sets Up Near Major Resistance - Breakdown Pending

Our research team believes Crude Oil and Energy, in general, has stalled near major resistance and maybe setting up a big downside move as the COVID-19 virus continues to roil regional and global economies.

The recent news that the COVID-19 virus cases have skyrocketed suggests further economic shutdowns may push oil prices below $35 ppb over the next few weeks and months. Our researchers believe Oil has already set up a resistance level near $42 and will begin to move lower as concerns about the economic recovery transition through expectations related to oil demand going forward. We believe the renewed global economic demand for oil will present a very real possibility that oil could collapse below $35 ppb over the next 30 days.

We believe this pending downside move in Crude Oil will set up a great trade opportunity in ERY, the Direxion Bear Energy 2x ETF. At this point in time, we are just waiting for the technical confirmation of this trade trigger. Once we receive confirmation from our price modeling systems, we believe ERY may rally 20% to 30% or more from current levels....Continue Reading Here.


Before you continue, be sure to opt-in to our free market trend signals 
so you don’t miss our next special report!


Stock & ETF Trading Signals

Friday, June 5, 2020

Gold & Silver “Washout” - Get Ready for a Big Move Higher

Gold and Silver moved lower early on June 2nd and 3rd. Our research team believes this is a “Washout Low” price rotation following a technical pattern that will prompt a much higher rally in precious metals. This type of washout price rotation is fairly common before very big moves after Pennant/Flag formations or just after reaching major price trigger levels.

With Gold, a sideways Pennant/Flag formation has been setting up near our GREEN Fibonacci Price Amplitude Resistance Arc. We believe the downward price rotation recently is a perfect setup for skilled technical traders to take advantage of lower entry price levels. The GREEN Fibonacci Price Amplitude Arc will very likely be breached over the next 5 to 10 trading days and the price of Gold should rally well above $1850 in the process. We believe this Washout Rotation is a process of running through the Long Stops just below recent price activity that will end with a defined upside price rally over the next 2 to 5+ weeks.

Before we continue, be sure to opt-in to our free market trend signals 
 before closing this page, so you don’t miss our next special report!


Silver has set up a completely different type of price pattern – a true Double-Top pattern. The downward price rotation recently in Silver is indicative of a weaker reaction to this massive resistance pattern and Double-Top. The likelihood that Silver will find support above $17 and mount a further upside price rally over the next 2 to 5+ weeks is still very strong. After the deep downward price collapse in Silver took place, just like what happened in 2009 and 2010, the upside potential for Silver is still massive – likely targeting $65 per ounce of higher.


This current Gold to Silver Ratio Monthly chart highlights the recent collapse in the ratio level as Silver rallied from near $12 towards current levels near $18. A similar spike in the Gold to Silver Ratio took place in 2008-09 – just before the broader market collapse in the US and Global markets took place. This happens as the initial reaction to risk in the global markets pushes Gold prices a bit higher while Silver, the often overlooked store of value, typically declines in value.

Once the price of Silver starts to rally, pushing the Gold to Silver ratio below 60 typically, both Gold and Silver start to align in price and begin to rally together. The current level of the Gold to Silver ratio is 94.9. This suggests that both Gold and Silver have quite a way to go in terms of reaching the “alignment phase”. Our researchers believe Gold will rally above $2100 to $2400 and Silver will rally above $40 to $50 before the two metals align and begin to rally together in almost equal strength.


Concluding Thoughts

Pay attention to what happens to precious metals over the next 10 to 15+ days. If our research is correct, both Gold and Silver will rally higher by about 7.5% to 14% – setting up new price highs for both metals. When the washout pattern completes, usually a fairly aggressive price trend begins where new price highs are established fairly quickly. Get ready, this should be a really nice upside price swing in precious metals over the next 6+ months or longer.

The next few years are going to be full of incredible opportunities for skilled traders and investors. Huge price swings, incredible revaluation events, and, eventually, an incredible upside rally will start again.

I’ve been trading since 1997 and I’ve lived through numerous market events. The one thing I teach my members is that risk is always a big part of trading and that’s why I structure all of my research and trading signals around “finding profits while reducing overall risks”. Sure, there are fast profits to be made in these wild market swings, but those types of trades are extremely risky for most people – and I don’t know of anyone that wants to risk 50 or 60% of their assets on a few wild trades.

I’m offering you the chance to learn to profit, as I do with my own money, from market trends that I hand-pick for my own trading. These are not wild, crazy trades – these are simple, effective, and slower types of trades that consistently build wealth. I issue about 4 to 8+ trades a month for my members and adjust trade allocation based on my proprietary allocation algo – the objective is to gain profits while managing overall risks.

You don’t have to spend days or weeks trying to learn my system. You don’t have to try to learn to make these decisions on your own or follow the markets 24/7 – I do that for you. All you have to do is follow my research and trading signals and start benefiting from my research and trades. My new mobile app makes it simple – download the app, sign in and everything is delivered to your phone, tablet, or desktop.

I offer membership services for active traders, long term investors, and wealth/asset managers. Each of these services is driven by my own experience and my proprietary trading systems and modeling systems. I have a small team of dedicated researchers and developers that do nothing but research and find trading signals for my members. Our objective is to help you protect and grow your wealth.

Please take a moment to visit The Technical Traders to learn more. I can’t say it any better than this… I want to help you create success while helping you protect and preserve your wealth – it’s that simple.

Chris Vermeulen
Chief Market Strategist
Founder of the Technical Traders 


Saturday, December 14, 2019

Seven Year Cycles Can Be Powerful and Gold Just Started One

Our research and predictive modeling systems have nailed Gold over the past 15+ months. We expected Gold to rally above $1750 before the end of this year, but the global trade wars and news cycles stalled the rally in Gold over the past 2 months. Now, it appears Gold is poised for another rally pushing much higher.

But wait, if you’re thinking I’m just another one of those traders who is always bullish on gold, just know I have been telling the truth about where gold was headed (lower) for years, but finally, the tide has changed!

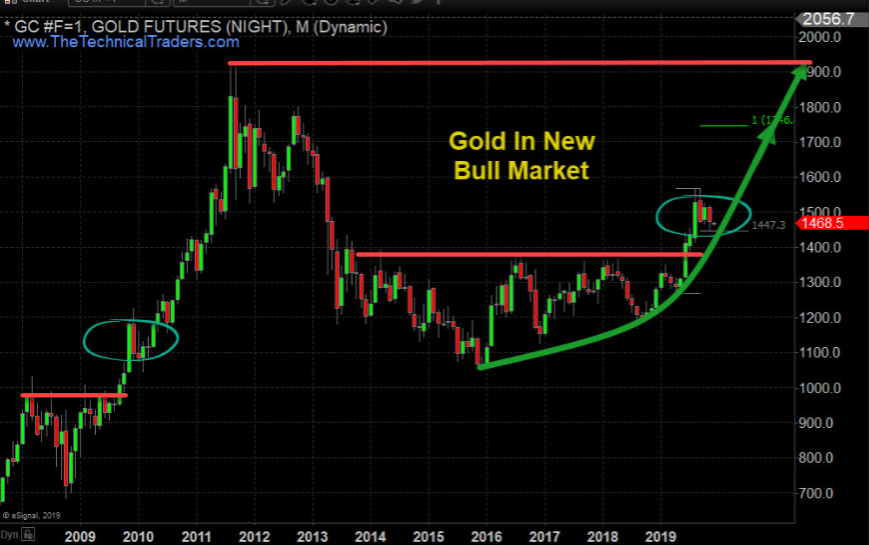
Gold broke down from a bull market in 2012/2013 – nearly 7 years ago. Now, Gold has broken resistance near $1375 and is technically in a full fledged Bull Market. The importance of this is the seven year cycle and how the rotation in Gold, between the high near $1923 and the low near $1045 represent an $878 price range. The upside (expansion) rally in Gold may very well move in expanding Fibonacci price structures – just like it did in 2005 through 2012. If this is the case, then we may expect to see an ultimate peak price in Gold well above $3500.

The rally that started in the last 2015 and ended in July 2016 totaled +$331.1 (+31.67%). The next price rally that started in August 2018 and ended in September 2019 totaled +$399.4 (+34.22%). If we take the current rally range (399.4) and divide it by the previous rally range (331.1), we end up with an expansion range of 121%. The two unique rallies that happened just before the 2009 parabolic rally in Gold represented (+315.8: 2006) and (394.8: 2008). The ratio of these two rallies is 125%. Could Gold have already set up for another parabolic rally well beyond the $1923 target level?

Before finding out what is next quickly join our free trend signals email list.

Monthly Price of Gold Chart – Bull and Bear Market Trends


Our research team believes Gold has already entered a technically valid Bullish Market trend. We believe Gold miners will follow higher as Gold begins this next move higher. The reason we have not engaged in Miners, yet, is because we have not received any technically valid signals related to the Gold miners indicating they have also entered a new Bullish Market trend.

Gold is the safe haven for the global market. It is a store of value and offers price appreciation when the global market risks are excessive. Because of this, the sentiment across the global markets appears to be weakening in regards to forward expectations and valuation appreciation within the investment/asset classes. If Gold continues to rally higher, consider it a strong indicator that the foundation of the global market valuation levels is weakening considerably.

U.S. Dollar Will Start to Support Higher Gold Prices


Should the U.S. Dollar retrace lower, Gold will see a price increase based on the renewed weakness of the U.S. Dollar. This would also assist in re-balancing global trade and economic issues with the US Dollar moving moderately lower as weakening global markets contract.

Gold Mining Stocks – Monthly Chart


Miners are set up much like Gold was in early 2018. Resistance has been set up with multiple price tops and any momentum rally above this level would technically qualify as a new Bullish Market trend for miners.

At this point, we believe the bottom in miners has already formed and we are simply waiting for the qualifying technical confirmation of the bullish trend to begin. Jumping into this trade too early could result in unwanted risks as the price could still waffle around within the Stage 1 Base range.

If you want to learn more about market stage analysis I will be covering it a new article shortly. Once you grasp the basic concept you will see these stages on every chart no matter the time frame and know when to focus on trading and when to ignore the charts.

If you like new fresh big trend trades then check out this real estate article I just posted and how the real estate ETF could allow your to profit from home prices but you don’t even need to own or buy a home!

Concluding Thoughts

The recent weakness in the US and global markets has prompted a moderately solid upside move in Gold and Silver over the past few days. We still need to see a Gold move above recent resistance to qualify as a new upside rally though. Miners are set up for a breakout technical move which we must also wait for. We believe these two may move somewhat in unison if the global markets continue to contract throughout the end of 2019 and into 2020.

Stay tuned for more updates and alerts when all these key sectors and asset classes start new trends because that is when you want to get involved for immediate oversized gains. See my stock, index, and commodity trade alerts here.

Chris Vermeulen
The Technical Traders


Stock & ETF Trading Signals

Monday, July 15, 2019

Could Gold Launch into a Parabolic Upside Rally?

We believe Gold is setting up for an incredible upside breakout move after reaching our predicted target near $1450. For those of you that have been following our research and Gold calls, we’ve nailed this move and our October 2018 predictive modeling call has continued to mirror (almost exactly) the price movement in Gold over the past 10+ months. See the chart below.


Our Adaptive Dynamic Learning (ADL) predictive modeling system suggested that Gold would rally from the $1200 level to above $1300, then stall. It suggested that in April or May of 2019, Gold would settle back below $1300 and set up a “momentum base” before attempting an upside breakout move after forming the base. Our research team identified April 21~24 as the likely “price low” for the “momentum base” using our advanced price cycle and other research tools.

You can see from the chart, above, that our upside price targets from our original research are above $1550~1600. What if we told you we now believe the upside price targets could actually be above $1700 and more like $1750 to $1800 on a parabolic upside price rally initiating after price breaks critical resistance levels?

Take a look at this simple Gold/Silver/USDollar index chart. The purpose of this chart is to relate the price of Gold to the price of Silver in US Dollar price levels. It highlights that Silver is still very undervalued in comparison to Gold and that any attempt to restore a price balance between Silver and Gold would likely result in either two outcomes : A. the price of Gold falls, or B. the price of Silver rallies faster than Gold rallies whereas this ratio will attempt to balance out (as we see back in 2013/2014).

Our Price Amplitude Arcs are a means of measuring price cycles, price waves and allow us to seek out critical price inflection points. As you can see, where multiple arcs align and are breached by price, we typically see some type of increased price volatility and trending. Currently, two separate arcs are setting up to be breached and we believe this is important because of how it aligns with our October 2018 research post.

What would cause Gold to rally above $1600 at this time? Why would this become a period where renewed interest in precious metals could drive such a big move? We believe a number of global economic factors will become more evident over the next 30 to 60+ days and that these critical Price Amplitude Arcs are suggesting price is set up to rally from these levels. We believe the move higher will include both Gold and Silver and that Silver may rally stronger than Gold which would cause this Gold/Silver ratio chart price level to move higher – towards our objective line (MAGENTA).


We believe a key date for all traders/investors to be aware of is August 19, 2019 (+/- 5 days). We believe this will be the date range that the market will break out of existing ranges and when fear and greed will likely solidify in the precious metals markets. We have about 35 days to go before this date and we believe Gold will continue to trade below the “Breakout Resistance” until renewed fear and greed become more evident in the global markets.


This means the US Dollar will likely continue to rally, or at least stay above $96, for the next 25+ days and that upside US Dollar price activity will partially mute the upside price potential in precious metals. Overall, the upside price momentum in metals will push metals prices higher while the US Dollar continues to strengthen moderately. Once the U.S. Dollar breaks lower, metals will skyrocket higher (breaking past the Breakout Resistance level) and begin the upside parabolic move.


Any opportunity you find where Gold is trading below $1400 is an excellent opportunity to prepare for this move. Silver continues to trade below $15.50 and continues to be an incredible opportunity for traders who understand the ratio levels of precious metals. Don’t miss this move. It is just a matter of time (30+ days) now.

Be prepared for these incredible price swings before they happen and learn how you can identify and trade these fantastic trading opportunities in 2019, 2020, and beyond with our Wealth Building & Global Financial Reset Newsletter. You won’t want to miss this big move, folks. As you can see from our research, everything has been setting up for this move for many months – most traders/investors have simply not been looking for it.

Join me with a 1 or 2-year subscription to lock in the lowest rate possible and ride my coattails as I navigate these financial market and build wealth while others lose nearly everything they own during the next financial crisis. Join Now and Get a 1oz Silver Round or Gold Bar Shipped To You Free.

I can tell you that huge moves are about to start unfolding not only in currencies, metals, or stocks but globally and some of these supercycles are going to last years. A gentleman by the name of Brad Matheny goes into great detail with his simple to understand charts and guide about this. His financial market research is one of a kind and a real eye opener. 2020 Cycles – The Greatest Opportunity Of Your Lifetime

As a technical analysis and trader since 1997, I have been through a few bull/bear market cycles. I believe I have a good pulse on the market and timing key turning points for both short-term swing trading and long-term investment capital. The opportunities are massive/life-changing if handled properly.

BILLION GIVEAWAY – REAL GOLD OR SILVER WITH MEMBERSHIPS


So kill two birds with one stone and subscribe for two years to get your
FREE GOLD BAR and enough trades to profit through the next metals
bull market and financial crisis!


Chris Vermeulen – The Technical Traders


Stock & ETF Trading Signals

Monday, November 19, 2018

Will Crude Oil Find Support Near $60 Dollars

Our research team warned of this move in crude oil back on October 7, 2018. At that time, we warned that oil may follow a historical price pattern, moving dramatically lower and that lows near $65 may become the ultimate bottom for that move. Here we are with a price below that level and many are asking “where will it go from here?”.

We believe the support near $65, although clearly broken, may eventually become resistance for a future upside price move. Our proprietary Fibonacci price modeling system is suggesting a new target near $52.00 - $53.00 and we believe this downside move in crude oil is far from over at this point.


The current global climate for oil is that suppliers are pumping more and more oil into the market at a time when, historically, prices should continue to decline. One of our research tools includes the ability to identify overall bias models for each week, month or quarter. Historically, crude oil is dramatically weaker in the month of November and relatively flat for the month of December.

Analysis for the month of November = 11
    *  Total Monthly Sum : -44.52000000000001 across 36 bars

Analysis for the month of December = 12
    *  Total Monthly Sum : -0.699999999999922 across 36 bars

We believe the price of oil will continue to drift lower to target the $52.00 - $53.00 Fibonacci support level before attempting to find any real price support. This equates to an addition -6 to -8% price decline for skilled traders. We will alert you with a new research post as this downward price move continues or new research becomes available.

We have been calling these types of market moves all year and recently called the top in the U.S. equity markets nearly 40 days before it happened. Want to know what we think is going to happen for the rest of 2018 and into early 2019? Visit the Technical Traders Free Research to read all of our public research posts. Isn’t it time you invested in a team of researchers and tools to assist you in finding greater trading success?

Chris Vermeulen


Stock & ETF Trading Signals

Tuesday, September 6, 2016

Tuesday's Webinar...Low Risk Setups For Trading Precise Turning Points in Any Market

Join John Carter of Simpler Options for a special online training on Tuesday evening September 6th, 2016 at 7 pm central and discover low risk option strategies for catching "bold and beautiful" reversal trades. John will also show us how to hunt for tops and bottoms using low risk setups for trading precise turning points in any market and so much more.

Get Your Seat Here

Most traders have no idea how to capture the massive profit potential from trading major reversals. These days’ markets often turn on a dime and those who wait for ‘conservative’ setups either miss out or suffer steep losses.

Here's what you can expect to learn during this live webinar session....

  *  A simple 3-step process to identify major market turning points in any market

  *  How to find low risk, high probability trades in today's volatile market conditions

  *  Why it’s finally possible to catch tops and bottoms in real time on almost any chart

  *  Why these ‘Bold and Beautiful’ reversal trades can be safer than ‘comfortable’ trades

  *  How to avoid getting suckered into the costly traps that most traders fall into

  *  How to adapt your trades automatically for choppy conditions AND big trends

  *  How to know when a support or resistance level is likely to hold or not


       Get your reserved spot Right Here


       See you Tuesday evening,
       The Stock Market Club


Get John's latest FREE eBook "Understanding Options"....Just Click Here!


Tuesday, April 22, 2014

New Video: This Weeks Nasdaq Shorting Opportunity

It looks as though the Nasdaq is about ready for another leg lower. Chris Vermeulen shows us what key resistance levels to look at for a possible short trade on the Nasdaq this week.

Get These Trade Alerts Every Week with Chris Vermeulen's ETF Trading Newsletter


Sign up for one of our Free Trading Webinars....Just Click Here!


Wednesday, January 8, 2014

This Thursday, John Carters "Voodoo Lines" Webinar

Free webinar on Thursday, January 9th at 8:00 p.m. eastern time. John Carter of Simpler Options is back with another one of his wildly popular free trading webinars.

In this Free Webinar you will learn:

    *   How to Identify Key Support and Resistance Levels
    *   What are Voo Doo Lines?
    *   Why Should You Care about Voo Doo Lines?
    *   What are the Voo Doo Lines Telling us now?
    *   John's Favorite Trading Strategies Using the Voo Doo and much more

Simply click here and we'll register you for this event

See you on the webinar!


Friday, November 15, 2013

ExxonMobil - The Surprising Big Chart Picture

While our trading partner Adam Hewsion was reviewing his energy portfolio this week, he stopped and looked at the chart for Exxon Mobile (NYSE:XOM). He immediately noticed major resistance coming in at the $95 level. Can Exxon break through this major resistance level and take off to the upside?

He measured from the resistance at $95 all the way down to the low in July of 2010, the difference is around $35. If he then added $35 to the breakout point, it takes us to his target zone of $130 per share for Exxon. Now remember, the market must move over the $95 level for this to happen.

Just Click Here to take a look at Adam's chart work and details for a potential ExxonMobil trade.


Subscribe to all of Adam's Blog Post


Tuesday, July 16, 2013

Free Webinar: An evening with Carolyn "The Fibonacci Queen" Boroden Wednesday, July 17th at 8:00PM est

Time is running out to get your seat for Wednesdays webinar with Carolyn "The Fibonacci Queen" Boroden and John Carter of Simpler Options. So sign up now!

For years Carolyn Boroden has been using and teaching fund managers Fibonacci based market geometry and symmetry that provides the edge needed to succeed in choosing your entry and exits points for your biggest trades. And you can easily use these methods whether you are trading stocks, currencies, ETFs or commodities.

In this Free webinar Carolyn and John will show us......

*     How to identify Fibonacci support & resistance zones

*    The simple way to manage your risk/reward using Fibonacci ratios

*    The brain dead easy ways to set up your support & resistance zones

*     How you can identify what markets to trade and when

*    The secret to identifying high probability targets in stocks and ETFs .... and much more

Simply click here and fill out your email address, click submit and you will be automatically registered for the webinar.

Get your seat now for "How to Use Fibonacci Analysis in Your Trading"

See you on Wednesday,
The Stock Market Club

Saturday, July 13, 2013

Free Webinar: How to Use Fibonacci Analysis in Your Trading Wednesday, July 17th at 8:00PM est

For years Carolyn Boroden has been using Fibonacci based market geometry and symmetry that provides the edge needed to succeed in choosing your entry and exits points for your biggest trades. And you can easily use these methods whether you are trading stocks, currencies, ETFs or commodities.

In this Free webinar Carolyn "The Fibonacci Queen" Boroden and "Simpler Options" John Carter will show us......

*     How to identify Fibonacci support & resistance zones

*    The simple way to manage your risk/reward using Fibonacci ratios

*    The brain dead easy ways to set up your support & resistance zones

*     How you can identify what markets to trade and when

*    The secret to identifying high probability targets in stocks and ETFs .... and much more

Simply click here and fill out your email address, click submit and you will be automatically registered for the webinar.

Watch "How to Use Fibonacci Analysis in Your Trading"

See you on Tuesday,
Ray @ The Stock Market Club

Monday, June 17, 2013

SP 500 Extends Rally Off Thursdays Low

The September S&P 500 closed higher on Monday as it extends the rally off last Thursday's low. The mid range close sets the stage for a steady opening when Tuesday's night session begins trading.

Stochastics and the RSI are diverging but have turned neutral to bullish signaling that sideways to higher prices are possible near term. Closes above the 20 day moving average crossing at 1633.22 would confirm that a short term low has been posted. If September renews the decline off May's high, the 38% retracement level of the November-May rally crossing at 1545.59 is the next downside target.

First resistance is the 20 day moving average crossing at 1633.22. Second resistance is May's high crossing at 1678.00. First support is the 25% retracement level of the November-May rally crossing at 1591.35. Second support is the 38% retracement level of the November-May rally crossing at 1545.59.

Make sure to check out "Options Income Access" it's now LIVE!

Tuesday, May 14, 2013

How to Spot & Time Stock Market Tops

Since the middle of April everyone and including their grandmother seems to have been building a short position in the equities market and we know picking tops or bottoms fighting the major underlying trend is risky business but most individuals cannot resist.

The rush one gets trying to pick a major top or bottom is flat out exciting and that is what makes it so darn addicting and irresistible. If you have ever nailed a market top or bottom then you know just how much money can be made. That one big win naturally draws you back to keep doing it much like how a casino works. The chemicals released in the brain during these extremely exciting times are strong enough that even the most focused traders fall victim to breaking rules and trying these type of bets/trades.

So if are going to try to pick a top you better be sure the charts and odds are leaning in your favor as much as possible before starting to build a position.

Below are a few charts with my analysis and thoughts overlaid showing you some of the things I look at when thinking about a counter trend trade like picking a top within a bull market.

Utility Stocks vs SP500 Index Daily Performance Chart:

The SPY and XLU performance chart below clearly shows how the majority of traders move out of the slow moving defensive stocks (utilities – XLU) and starts to put their money into more risky stocks. This helps boost the broad market. I see the same thing in bonds and gold this month which is a sign that a market top is nearing.

That being said when a market tops it is generally a process which takes time. Most traders think tops area one day event but most of the times it takes weeks to unfold as the upward momentum slows and the big smart money players slowly hand off their long positions to the greedy emotion drove traders.

Look at the chart below and notice the first red box during September and October. As you can see it took nearly 6 weeks for that top to form before actually falling off. That same thing could easily happen again this time, though I do feel it will be more violent this time around.

SPYXLU

SPY ETF Trading Chart Shows Instability and Resistance:

Using simple trend line analysis we see the equities market is trading at resistance and sideways or lower prices are more likely in the next week or two.

SPYResistance

Stocks Trading Above 150 Day Moving Average Chart:

This chart because it’s based on a very long term moving average (150sma) is a slow mover and does not work well for timing traded. But with that said it does clearly warn you when stocks are getting a little overpriced and sellers could start at any time.

General rule is not to invest money on the long side when this chart is above the 75% level. Rather wait for a pullback below it.

BarC150

Stocks Trading Above 20 Day Moving Average Chart:

This chart is based on the 20 day moving average which moves quickly. Because it reacts quicker to recent price action it can be a great help in timing an entry point for a market top or bottom. It does not pin point the day/top it does give you a one or two week window of when price should start to correct.

BarC20

How to Spot and Time Stock Market Tops Conclusion:

As we all know or will soon find out, trading is one of the toughest businesses or and one of the most expensive hobbies that one will try to master. Hence the 95-99% failure rate of individuals who try to understand how the market functions, position management, how to control their own emotions and to create/follow a winning strategy.

With over 8000 public traded stocks, exchange traded funds, options, bonds, commodities, futures, forex, currencies etc… to pick from its easy to get overwhelmed and just start doing more or less random trades without a proven, documented rule based strategy. This type of trading results in frustration, loss of money and the eventual closure of a trading account. During this process most individuals will also lose friends, family and in many cased self-confidence.

So the next time you think about betting against the trend to pick a top or a bottom you better make darn sure you have waited well beyond the first day you feel like the market is topping out. Stocks trading over the 150 and 20 day moving averages should be in the upper reversal zones and money should be flowing out of bonds and other safe haven/defensive stocks to fuel the last rally/surge higher in the broad market.

Also I would like to note that I do follow the index futures and volume very closely on both the intraday and daily charts. This is where the big money does a lot of trading. Knowing when futures contracts are being sold or bought with heavy volume is very important data in helping time tops and bottoms more accurately. And the more experience you have in trading also plays a large part in your success in trading tops and bottoms.

Download our FREE eBook on Controlling Your Trades, Money & Emotions


And join our FREE Newsletter Today!

Wednesday, May 8, 2013

How to Trade Gold, Silver & Precious Metal Miners....It's not that Difficult!

How to trade Gold and other precious metals related investments is not that complex. But you must be willing to wait for price to provide low risk entry points before getting involved. Precious metals are like any other investment in respect to trading and investing in them. There are times when you should be long, times to be in cash and times to be short (benefit from falling prices).

Since 2011 when gold and silver started another major bull market correction the best position has been to move to cash or sell/write options against your positions to protect your investment until the next trend resumes.

If you take a look at the chart below of gold you will notice that in 2008 we had a similar breakdown in price which purged the market of investors who where long gold. And if you compare the last two breakdowns they look very much the same. If price holds true then much higher prices are likely to unfold at the end of 2013.

The key here is for the price to move and hold above the major resistance line. If it can do that then we are looking at a possible breakout to $2600 – $3500 gold. With that being said gold and silver may just be starting a bear market. Depending what the price of gold does when my resistance level is touched, my outlook may change from bullish to bearish.

Also with last weeks economic numbers getting better in the USA I do have concerns that gold may be starting a bear market but we will not know for several more months yet.

LongTermWeeklyGold

How to Trade Gold Daily Technical Chart:

Major technical damage has been done to the chart of gold. This can be seen as bullish or bearish price action but until price and volume pattern unfolds which puts the odds on the bullish or bearish side I remain neutral.

LongTermGold

How to Trade Silver Daily Technical Chart:

Silver is in the same position as gold. The question is if this is a shakeout or breakdown......

LongTermSilver

How to Trade Gold Mining Stocks Monthly Chart:

Gold mining stocks broke down a couple months ago and continue to sell off. If precious metals continue to move lower then mining stocks will continue their journey down. The chart below made in February and it has in most part played out as expected. While I do not try to pick bottoms (catch falling knives) I do like to watch for them so I am prepared for a new position when the time and chart become bullish.

LongTermMiners


How to Trade Gold, Silver and Mining Stocks Conclusion:

In short, precious metals continue to be in a down trend. While they look to be trying to bottom it is important to remember that the largest moves take place in the last 10% of a trend. So we may be close to a bottom but there could be sharply lower prices yet.

The time will come when another major buy or short signal forms and when it does we will be getting involved. The exciting part is that it could be just around the corner.

If you want to keep current and take advantage of the next major move be sure to join our free newsletter here... Join our FREE Newsletter Today!


Check out our current specials for full subscription members.


Thursday, February 28, 2013

Gold, Silver and Miners Remain Junk Grade Investments

Since silver and gold topped in 2011 investors have been struggling with these positions hoping this cyclical bull market for metals continues. The simple truth is no one knows for sure if prices will continue and make new highs and those who say its a for sure thing we all know deep down is full of bull crap.

All investments move in cycles, waves or trends which ever you want to call it. The market has 4 simple yet distinct stages each require a completely different skill set and trading tactics to navigate.

Stage 1 – After a period of decline a stock consolidates at a contracted price range as buyers step into the market and fight for control over the exhausted sellers. Price action is neutral as sellers exit their positions and buyers begin to accumulate the stock.

Stage 2 – Upon gaining control of price movement, buyers overwhelm sellers and a stock enters a period of higher highs and higher lows. A bull market begins and the path of least resistance is higher. Traders should aggressively trade the long side, taking advantage of any pullback or dips in the stock’s price.

Stage 3 – After a prolonged increase in share price the buyers now become exhausted and the sellers again move in. This period of consolidation and distribution produces neutral price action and precedes a decline in the stock’s price.

Stage 4 – When the lows of Stage 3 are breached a stock enters a decline as sellers overwhelm buyers. A pattern of lower highs and lower lows emerges as a stock enters a bear market. A well positioned trader would be aggressively trading the short side and taking advantage of the often quick declines in the stock’s price. More times than not all of stage 2 gains are given back in a short period of time.

Stages

Now that you know the stages and what it looks like its time to review the gold, silver and miners charts.

Gold Chart – Weekly

Gold has been in a bull market for several years but is starting to show its age in terms of the size of the price patterns, volume levels and extreme bullish sentiment. Back in 2011 a week before price topped we exited precious metals because the short term charts and volume levels were warning of a sharp drop. Since then I have not done many trades in either gold or silver because I do not like shorting in bull markets. Waiting for a bullish setup/price pattern before getting involved is my focus.

Gold has pulled back with a bullish 5 wave correction the last 5 months and at key support. While the long term charts are pointing to higher gold prices you must be aware that if gold and silver start to breakdown things will likely get ugly quickly. To be honest I do not care which way it goes, I just want it to either rally from support here and make new highs or breakdown and crash. Both will be very profitable if traded properly.

Gold

Silver Chart – Weekly

Silver has a very similar chart to that of its big sister (yellow gold). This shiny metal has the energy of a 3 year old making it a very volatile investment. I have touched on the topic of gold and silver being so called safe havens and if you have been reading my work for a while you know that any investment that can move 18-45% in value within 1 month is NOT a safe haven.

While it has done well in the past decade and boosted a lot of retirement accounts the day will come with these things collapse and most people holding them will give back most if not all the gains they had simply because people get attached to large positions and most do not know when to just exit a position.

Silver

Gold Miners Chart – Monthly

This chart gives me cold sweats because I know how many people own gold mining stocks and I know how fast these things can move. If the price closed below the green support line the bottom could fall out and be very painful for those who get paralyzed by denial and do nothing but watch their accounts lose value week after week.

Miners

Precious Metals Investing Conclusion:

In short, this report is to show you the very basics of how investments move in stages. It is also to show a warning that precious metals are technically very close to a major breakdown which the big money players are watching closely. This thinly traded sector can move extremely fast when everyone rushes for the door.

Do not get me wrong, I am not saying a crash is about to happen, actually it’s the opposite. All I am doing is planning the idea in your subconscious so that if prices continue to move lower you will remember that these price levels and take action with your investments. Remember, you can always buy the investment back at any time again if the outlook changes in a week, month or year.

Just click here to get My FREE Weekly Gold, Silver and Mining Reports and Trade with the Stages

Chris Vermeulen

Monday, July 30, 2012

The Federal Reserve, Gold, Crude Oil and the Dollar’s Demise

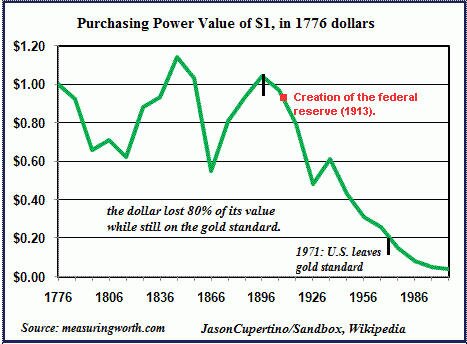
The Federal Reserve through its various monetary mechanisms has a major impact on the value of the U.S. Dollar and over time has destroyed the purchasing power of the fiat base currency used in the United States.
Interestingly enough, the following quote comes directly from the Federal Reserve’s website regarding one of its primary mandates, “In setting monetary policy, the Committee seeks to mitigate deviations of inflation from its longer-run goal and deviations of employment from the Committee’s assessment of its maximum level.”
The chart below illustrates the horrific job the Federal Reserve has done of protecting the purchasing power of the U.S. Dollar since its creation.
Dollar Creation By The Federal Reserve
In light of the longer-term malaise seen above, the Dollar Index futures have recently rallied sharply higher as Europe continues to flail in a slow and agonizing decline which will ultimately lead to a complete fiscal disaster.
Sovereign debt concerns continue to mount regardless of what the European technocrats spew publicly and the U.S. Dollar has been the primary beneficiary of these seemingly growing concerns.
This brings me to the purpose of this article. Most of the articles I write are focused on option based trades, but I decided it was time to put forth a more comprehensive scenario that could unfold over the next few years as a result of excessive monetary stimulus through various quantitative easing mechanisms developed by the Federal Reserve Bank.  “A mild change” to say the least . . .
As discussed above, the U.S. Dollar Index futures have moved higher throughout most of 2012. Any significant increase in the U.S. Dollar is a growing concern among central bankers as it correlates toward deflation. Deflation is the Fed’s biggest enemy, besides themselves of course.
Next week the Federal Reserve will release statements relating to the economic condition of the United States. Furthermore, the Fed also will discuss if it will initiate another dose of monetary crack for a capital market place that is addicted to cheap money and zero interest rates. At this point, the so-called marketplace is the antithesis of free by all standard measures.
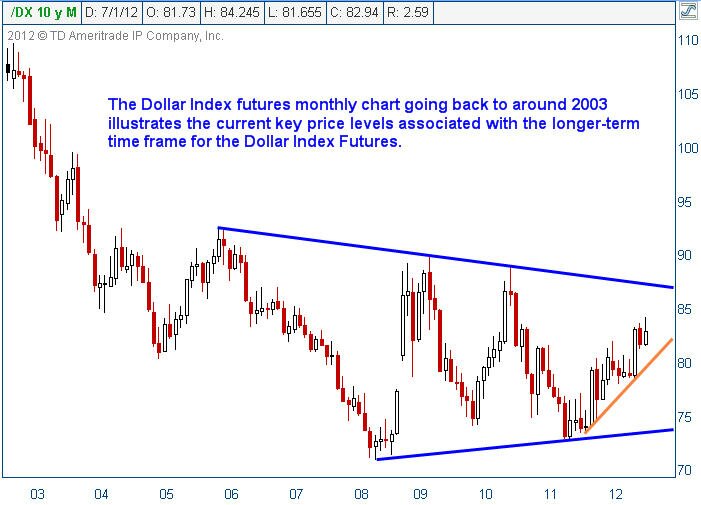
Consider the long-term monthly chart of the U.S. Dollar Index futures illustrated below:
Dollar Index Value Chart
The U.S. Dollar Index futures are in an uptrend that dates back to mid 2011. The orange line illustrates the uptrend and represents a key price level for the U.S. Dollar Index. For those unfamiliar with basic technical analysis, the rising orange trendline will act as buying support until the Dollar eventually breaks down through it signaling the bullish move higher has ended.
This brings us to a rather interesting potential observation. Today Mario Draghi, Chairman of the European Central Bank (ECB), made public comments regarding the readiness of the ECB to act if need be to safeguard the European Union. The Dollar Index Futures plummeted on the statement and remained under selling pressure most of the trading session on Thursday.
If a mere comment from the ECB can have such a damaging impact on the valuation of the Dollar, what would happen to the Dollar if the Fed initiated a new easing mechanism?
The answer is simple, the U.S. Dollar would immediately be under selling pressure. Selling pressure in the U.S. Dollar Index generally leads to a rally in risk assets such as equities and oil futures. Over the longer-term, a weak Dollar is also positive for precious metals and other hard assets.
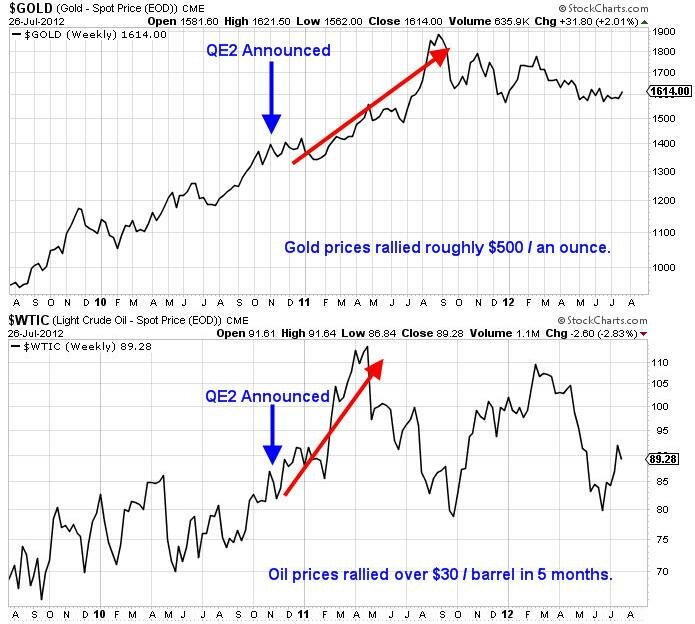
As an example to illustrate the power of Quantitative Easing as it relates to the price of both gold and oil, consider the following chart:
Spot Gold Price Chart
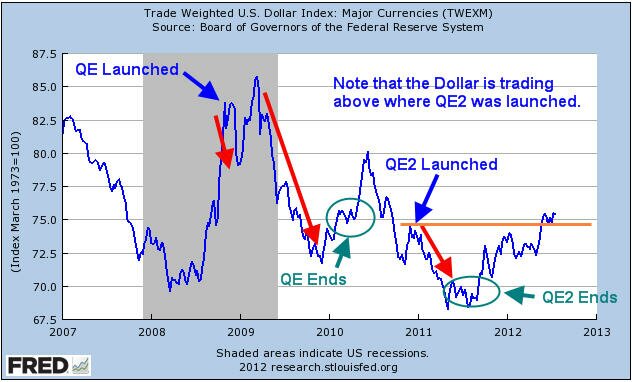
Obviously the price action is pretty clear that Quantitative Easing has a positively correlated impact on the price performance of hard assets, specifically gold and oil. Now consider a price chart of the Dollar Index shown below courtesy of the Federal Reserve Bank, the annotations are mine.
Quantitative Easing Effects
The chart above tells an interesting story about the impact that Quantitative Easing has on the Dollar. How can the Federal Reserve claim to be protecting the purchasing power of the U.S. Dollar when its actions have a direct negative correlation to the greenback’s price?
Furthermore, based on the chart above I am of the opinion that Quantitative Easing III is a foregone conclusion. The current price of the Dollar Index is clearly above the previous high where QE2 was launched. So far, the rally in the Dollar Index has not pushed equity prices considerably lower. However, should the Federal Reserve refrain from initiating additional easing measures it is likely based on the chart above that the U.S. Dollar Index will rally.
Upon the conclusion of both QE and QE2, the Dollar Index rallied sharply higher. With the Fed announcement coming closer by the hour, financial pundits will attempt to predict the future action of the Fed.
I have no interest in making predictions about what the Fed will do. It is a certainty that QE3 will take place at some point in the future whether it be sooner or later. The Federal Reserve simply has no choice, otherwise the Dollar would continue to rally and we would begin to go through a deflationary period which the Federal Reserve simply cannot tolerate.
The scenario that I would urge inquiring minds to consider would be as follows. If the Fed does nothing we can likely assume that the U.S. Dollar Index will continue to rally to the upside. Based on the price chart of the U.S. Dollar Index shown above, we can expect that sellers would certainly step in around the 86 – 88 price range based on previous resistance.
If the U.S. Dollar makes it anywhere near the 86 – 88 price range without the Federal Reserve initiating QE3 it would be expected that risk assets would be under considerable selling pressure somewhere along the way. Should the Fed act to break the Dollar’s rally either through more easing or “other” mechanisms, the result would be a potentially monster rally for risk assets, at least initially.
Equities, oil, and precious metals would rally on a falling Dollar as shown above. The question then becomes what if this is the last gasp rally before a monster selloff ensues in the Dollar Index?
If the Fed breaks the rally early or initiates a monster-sized easing program, the initial reaction will be quite positive, especially for equities. As the selloff in the Dollar Index worsens, equities would eventually begin to underperform as oil prices would surge putting pressure on the economy.
In addition to oil rallying on the weaker Dollar, we could also see sellers start to show up in droves dumping U.S. Treasury’s to any buyer left standing. International debt holders would especially have incentive to sell Treasury’s as the real purchasing power of the bonds’ interest payments would decline as the Dollar fell in value.
The way I see it, whether the Fed launches QE3 now or later, the outcome will not change. An extremely weak Dollar could wreak havoc across a variety of assets and the broader economy. Imagine where gasoline prices would be if oil prices hit $125 / barrel. The average price in the U.S. would be well above $5 / gallon based on current prices and possibly higher.
What happens to the economy if interest rates start to react violently to the price action in the Dollar? What if Treasury’s start to sell off viciously and interest rates start to rise wildly and volatility among bond holdings runs rampant? Are we to believe that the very entity that has created boom and bust cycles through easy monetary policies and has been oblivious to the bubbles that it has created is capable of solving the issues that would potentially arise from a currency crash in the U.S. Dollar?
The track record of the Federal Reserve is quite clear. They are generally late to the party and rarely are able to forecast events in the future with any clarity. Do you really think they will know what to do? The free market wants to destroy debt through deflationary pressure and price discovery and the Federal Reserve continues to get in the way.
The free market will win as it always does, but the American people will lose. This process may take months, years, or even decades to play out. Eventually the game will end. There is only one certainty should any portion of the scenario discussed above come to fruition, when the Dollar is inevitably broken the only safe place to hide during the potential currency crash will be in physical gold and silver. Paper money and paper assets will come under extreme selling pressure and in some cases will simply........disappear.
Here’s to hoping I am totally wrong!
Test drive our video analysis and trade idea service for only $1 at www.Trader Video Playbook.com


Get our Free Trading Videos, Lessons and eBook today!

Tuesday, July 24, 2012

How To Position Yourself for a 10 Year Pattern Breakout

As mentioned last Friday just before things took a dive on the weekend, a look at the major market indices did not look promising. If we take an even longer term look and examine the monthly charts we can see that The S&P 500 as well as the Dow Jones have been approaching multi decade rising channel resistance lines. Further, they also appear to be forming bearish rising wedge patterns.

Monthly Long Term Chart Analysis & Thoughts....

As many of my longer term subscribers can attest to, I always preach that technical analysis is one part art and one part science: you can never be completely certain on what the outcome of a pattern is going to be. However, we can use historical analysis to make better investments. The great American Novelist Mark Twain probably said it best in that “history does not repeat itself, but it rhymes”. Regarding a rising wedge pattern, we know that roughly two thirds of the time they will break to the downside. This also means that one third of the time they break to the upside.

In accomplishing our goal of capital growth we must do a number of things. We must make returns on our investments, we must protect our investments, and we must limit our losses. While all three aspects work in tandem with each other, there are times when focus must be allocated to one specific approach.

Regarding the current technical setup, I’m not so focused on the 67% chance that these wedges will break to the downside, but more so the impact of each outcome on the average Joe’s portfolio and mom and pop businesses. The S&P 500 and the Dow are approaching long term resistance lines that have been in place for decades. If we do break to the downside, which I suspect we will, there could be a very significant sell off with consequences that no one can predict at this point though I mention some things in the chart above. Alternatively, there is significant overhead resistance in the various indices, and I don’t believe an upside break would be too monumental.

That being said, I always like to keep an open outlook and wait for the right opportunity. I’m trying to think of scenarios that would prelude further upside action and I really am not coming up with much. As evidenced by the completion of the recent 5 wave uptrend on the S&P that coincided nicely with the various quantitative easing policies, Ben Bernanke and the fed have had less and less impact. I truly can’t see many fiscal developments that would prompt any significant bullish action.

The only scenario I really think that could pump up equities is a series of positive earnings announcements. A lot of expectations, earnings numbers, guidance, etc… have been revised downwards over the last couple of quarters, so there is the opportunity for some positive surprises that could lead to some bullish price action. In absence of such a scenario, I really can’t think of much else that would prompt a run up.

Look at these charts of positive and negative earnings surprises… and the dates and remember what happened following this negative data....

Positive Earnings Surprise


Negative Earnings Surprise


That being said, I am recommending two courses of action. For those steadfast bulls, lock in some profits and/or buy some protection. Missing out on some of the upside is a lot better than losing some of the gains you have fought so hard for over the past couple of years. For the more aggressive traders and investors, start following my updates a little more regularly as I foresee many shorting opportunities coming up in the future. As many of you know, sell offs are often quick and abrupt, and timing is extremely important when playing the downside.

Further, trading could get very volatile in the near future. Historically, and even more so looking forward as August and September have been very costly for the average investor. Our focus will be in taking the highest probability trades that offer the best risk to reward scenarios. There will be times when we miss trades, and times when they’re not timed perfectly. But, as those who have been with me for a while can attest to, patience pays off in the long run....

Join my Free Market Analysis & Trade Idea Newsletter > Now at The Gold & Oil Guy

Chris Vermeulen

Get our Free Trading Videos, Lessons and eBook today!

Monday, July 23, 2012

Financial Market Forecast is Looking Bleak

From guest blogger Chris Vermeulen.....

This week could be a huge one for stocks and commodities. This morning the dollar index is taking another run at our weekly chart resistance level. If it can break out and start to rally this week then a possible 4-6 week sell off in stocks and commodities may be just starting.

And we know just how we are going to play it when it does!

Watch the morning video or at least the last 4 minutes where I cover the SP500 intraday and daily chart which shows the main cycles. The video clearly explains where the market seems to be trading in terms of cycles and what we should expect this week and in the coming month.

Read and watch Chris' > "Financial Market Forecast is Looking Bleak"


Get our Free Trading Videos, Lessons and eBook today!

Sunday, September 12, 2010

Gold forms Overbought Rising Wedge at Resistance

From guest blogger Chris Vermeulen from The Gold and Oil Guy....

Precious metals soar as investors flock to gold and silver. But are they looking deep enough to truly understand the current trends at hand?

When reviewing the metals sector I like to look at it from different angles to get a solid understanding of the patterns and trend forming. I follow multiple time frames along with monitoring the gold mining stocks. Gold stocks tend to lead the price of gold bullion and when its out performing the price of gold substantially by 10% or more you should be expecting a pause or pullback in both gold stocks and gold bullion prices temporarily.

Below are a few charts showing the long and short term trends for gold.

Gold Bullion Price – Weekly Trend Chart
Gold continues to be in a strong up trend. The occasional test of support at the major moving averages can provide great long term points for adding to a position. The 50 period average is one which is tested frequently.

Looking at the weekly chart does give me a red flag for the intermediate price of gold. While the trend is clearly up I can’t help but notice the rising wedge which is a bearish pattern. During an uptrend we want to see bull flags and pennants, not a grind higher forming a narrowing range. This grind higher could unfold much similar to the price action of 2005 and 2007 instead of a correction but I am leaning more towards a sharp correction because more people are bullish on gold now then they were during the June top.

For those looking at gold as a long term investment/currency can be patient and wait for a pullback to a major moving average before adding to your position then you would lower your overall risk for this position. You will understand after reviewing the following charts.


GLD – Gold Bullion ETF – Daily Chart
(This fund moves identical to spot gold price so even though I am showing you GLD fund, the spot gold chart is doing the exact same thing.) As you can see below the price of gold is trading at resistance and becoming choppy. Buying gold at resistance does not make much sense to me. There is a very good chance gold will move lower in the coming weeks providing a better price for long term investors to add to their positions. For example, if you waited for the weekly chart to pullback to the 50 period moving average that would be like buying this GLD fund at $113, which is an 8% discount.

Gold continues to hold up within its channel but this week we could see fireworks if the price breaks below the blue support channels.


Gold:Gold Stocks Comparison – Daily Chart
This chart shows the performance of gold vs gold stocks from the Feb 2010 lows. The blue line is the performance of gold stocks while the red line shows gold’s performance. It’s obvious that when everyone is bullish on gold they buy the highly leverages gold investments in order to take full advantage of the upcoming move. This is much like reading the put/call ratio for trading the SP500 and it measures the bullishness of the precious metals sector.

When gold equities are strongly out performing gold bullion you should be thinking about raising your stops, taking partial profits and or hedging your long term position until the sector stabilizes is not trading at a premium.


Precious Metals Sector Trading Conclusion:
In short, Gold is in a strong up trend and will remain inrecious Metals Sector Trading Conclusion: one for a long time. Commodities have higher percentage of going parabolic. That means there’s a small chance that gold continues to move up quicker and quicker surging hundreds of dollars in a very short period of time. That being said, it’s not very likely, and from a technical point of view those buying gold now are paying a premium in my opinion.

Being a patient trader is not easy, but waiting for low risk entry points is very rewarding on many different levels when done correctly.

Get Chris Vermeulen'a detailed analysis and trades for Oil, US dollar, Treasury notes, the broad market, and Sectors. Be sure to join his ETF Trading Service at The Gold and Oil Guy.Com


Share