Showing posts with label support. Show all posts

Wednesday, July 22, 2020

Energy Sets Up Near Major Resistance - Breakdown Pending

Our research team believes Crude Oil and Energy, in general, has stalled near major resistance and maybe setting up a big downside move as the COVID-19 virus continues to roil regional and global economies.

The recent news that the COVID-19 virus cases have skyrocketed suggests further economic shutdowns may push oil prices below $35 ppb over the next few weeks and months. Our researchers believe Oil has already set up a resistance level near $42 and will begin to move lower as concerns about the economic recovery transition through expectations related to oil demand going forward. We believe the renewed global economic demand for oil will present a very real possibility that oil could collapse below $35 ppb over the next 30 days.

We believe this pending downside move in Crude Oil will set up a great trade opportunity in ERY, the Direxion Bear Energy 2x ETF. At this point in time, we are just waiting for the technical confirmation of this trade trigger. Once we receive confirmation from our price modeling systems, we believe ERY may rally 20% to 30% or more from current levels....Continue Reading Here.


Before you continue, be sure to opt-in to our free market trend signals 
so you don’t miss our next special report!


Stock & ETF Trading Signals

Saturday, December 14, 2019

Seven Year Cycles Can Be Powerful and Gold Just Started One

Our research and predictive modeling systems have nailed Gold over the past 15+ months. We expected Gold to rally above $1750 before the end of this year, but the global trade wars and news cycles stalled the rally in Gold over the past 2 months. Now, it appears Gold is poised for another rally pushing much higher.

But wait, if you’re thinking I’m just another one of those traders who is always bullish on gold, just know I have been telling the truth about where gold was headed (lower) for years, but finally, the tide has changed!

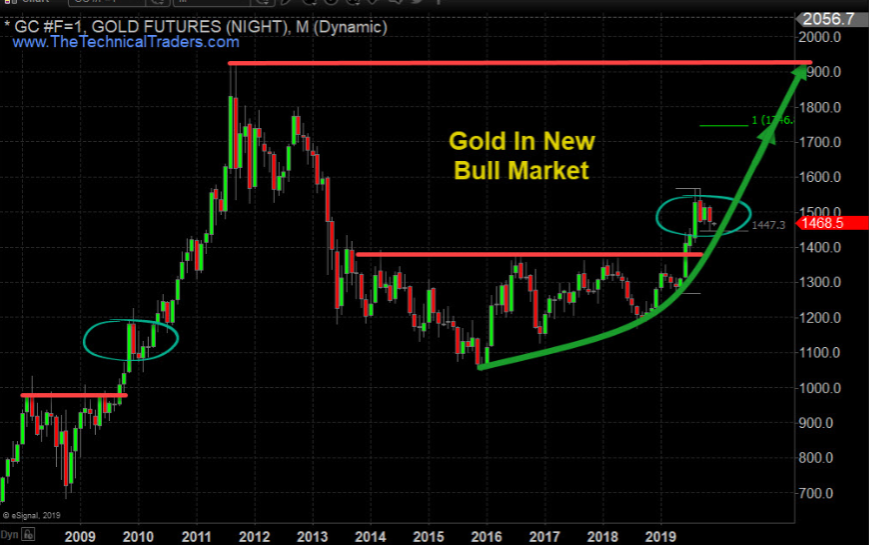
Gold broke down from a bull market in 2012/2013 – nearly 7 years ago. Now, Gold has broken resistance near $1375 and is technically in a full fledged Bull Market. The importance of this is the seven year cycle and how the rotation in Gold, between the high near $1923 and the low near $1045 represent an $878 price range. The upside (expansion) rally in Gold may very well move in expanding Fibonacci price structures – just like it did in 2005 through 2012. If this is the case, then we may expect to see an ultimate peak price in Gold well above $3500.

The rally that started in the last 2015 and ended in July 2016 totaled +$331.1 (+31.67%). The next price rally that started in August 2018 and ended in September 2019 totaled +$399.4 (+34.22%). If we take the current rally range (399.4) and divide it by the previous rally range (331.1), we end up with an expansion range of 121%. The two unique rallies that happened just before the 2009 parabolic rally in Gold represented (+315.8: 2006) and (394.8: 2008). The ratio of these two rallies is 125%. Could Gold have already set up for another parabolic rally well beyond the $1923 target level?

Before finding out what is next quickly join our free trend signals email list.

Monthly Price of Gold Chart – Bull and Bear Market Trends


Our research team believes Gold has already entered a technically valid Bullish Market trend. We believe Gold miners will follow higher as Gold begins this next move higher. The reason we have not engaged in Miners, yet, is because we have not received any technically valid signals related to the Gold miners indicating they have also entered a new Bullish Market trend.

Gold is the safe haven for the global market. It is a store of value and offers price appreciation when the global market risks are excessive. Because of this, the sentiment across the global markets appears to be weakening in regards to forward expectations and valuation appreciation within the investment/asset classes. If Gold continues to rally higher, consider it a strong indicator that the foundation of the global market valuation levels is weakening considerably.

U.S. Dollar Will Start to Support Higher Gold Prices


Should the U.S. Dollar retrace lower, Gold will see a price increase based on the renewed weakness of the U.S. Dollar. This would also assist in re-balancing global trade and economic issues with the US Dollar moving moderately lower as weakening global markets contract.

Gold Mining Stocks – Monthly Chart


Miners are set up much like Gold was in early 2018. Resistance has been set up with multiple price tops and any momentum rally above this level would technically qualify as a new Bullish Market trend for miners.

At this point, we believe the bottom in miners has already formed and we are simply waiting for the qualifying technical confirmation of the bullish trend to begin. Jumping into this trade too early could result in unwanted risks as the price could still waffle around within the Stage 1 Base range.

If you want to learn more about market stage analysis I will be covering it a new article shortly. Once you grasp the basic concept you will see these stages on every chart no matter the time frame and know when to focus on trading and when to ignore the charts.

If you like new fresh big trend trades then check out this real estate article I just posted and how the real estate ETF could allow your to profit from home prices but you don’t even need to own or buy a home!

Concluding Thoughts

The recent weakness in the US and global markets has prompted a moderately solid upside move in Gold and Silver over the past few days. We still need to see a Gold move above recent resistance to qualify as a new upside rally though. Miners are set up for a breakout technical move which we must also wait for. We believe these two may move somewhat in unison if the global markets continue to contract throughout the end of 2019 and into 2020.

Stay tuned for more updates and alerts when all these key sectors and asset classes start new trends because that is when you want to get involved for immediate oversized gains. See my stock, index, and commodity trade alerts here.

Chris Vermeulen
The Technical Traders


Stock & ETF Trading Signals

Monday, December 24, 2018

The SP500 Breaks 2018 February Lows - What Next?

The ES (S&P e-mini contracts) broke the support level from the February 2018 lows immediately after the US Federal Reserve announced a 25 bp rate hike this week. This breakdown below the February 2018 lows is concerning because it indicates that previous support is not holding and we could be in for further downside price activity.


We are preparing a detailed research post for early next week regarding a broad range of US markets as well as how our proprietary price modeling systems are reflecting this recent price move. What we can suggest to all investors is play small positions at the moment and prepare for increased volatility. There is near term support that may come into play soon, but overall the markets are reacting to a deleveraging event that could see prices push below 2400 before finding true support.

Visit The Technical Traders to read all of our recent research posts and see what we believe will be the big movers in 2019.

Chris Vermeulen


Stock & ETF Trading Signals


Monday, November 19, 2018

Will Crude Oil Find Support Near $60 Dollars

Our research team warned of this move in crude oil back on October 7, 2018. At that time, we warned that oil may follow a historical price pattern, moving dramatically lower and that lows near $65 may become the ultimate bottom for that move. Here we are with a price below that level and many are asking “where will it go from here?”.

We believe the support near $65, although clearly broken, may eventually become resistance for a future upside price move. Our proprietary Fibonacci price modeling system is suggesting a new target near $52.00 - $53.00 and we believe this downside move in crude oil is far from over at this point.


The current global climate for oil is that suppliers are pumping more and more oil into the market at a time when, historically, prices should continue to decline. One of our research tools includes the ability to identify overall bias models for each week, month or quarter. Historically, crude oil is dramatically weaker in the month of November and relatively flat for the month of December.

Analysis for the month of November = 11
    *  Total Monthly Sum : -44.52000000000001 across 36 bars

Analysis for the month of December = 12
    *  Total Monthly Sum : -0.699999999999922 across 36 bars

We believe the price of oil will continue to drift lower to target the $52.00 - $53.00 Fibonacci support level before attempting to find any real price support. This equates to an addition -6 to -8% price decline for skilled traders. We will alert you with a new research post as this downward price move continues or new research becomes available.

We have been calling these types of market moves all year and recently called the top in the U.S. equity markets nearly 40 days before it happened. Want to know what we think is going to happen for the rest of 2018 and into early 2019? Visit the Technical Traders Free Research to read all of our public research posts. Isn’t it time you invested in a team of researchers and tools to assist you in finding greater trading success?

Chris Vermeulen


Stock & ETF Trading Signals

Tuesday, September 6, 2016

Tuesday's Webinar...Low Risk Setups For Trading Precise Turning Points in Any Market

Join John Carter of Simpler Options for a special online training on Tuesday evening September 6th, 2016 at 7 pm central and discover low risk option strategies for catching "bold and beautiful" reversal trades. John will also show us how to hunt for tops and bottoms using low risk setups for trading precise turning points in any market and so much more.

Get Your Seat Here

Most traders have no idea how to capture the massive profit potential from trading major reversals. These days’ markets often turn on a dime and those who wait for ‘conservative’ setups either miss out or suffer steep losses.

Here's what you can expect to learn during this live webinar session....

  *  A simple 3-step process to identify major market turning points in any market

  *  How to find low risk, high probability trades in today's volatile market conditions

  *  Why it’s finally possible to catch tops and bottoms in real time on almost any chart

  *  Why these ‘Bold and Beautiful’ reversal trades can be safer than ‘comfortable’ trades

  *  How to avoid getting suckered into the costly traps that most traders fall into

  *  How to adapt your trades automatically for choppy conditions AND big trends

  *  How to know when a support or resistance level is likely to hold or not


       Get your reserved spot Right Here


       See you Tuesday evening,
       The Stock Market Club


Get John's latest FREE eBook "Understanding Options"....Just Click Here!


Sunday, October 5, 2014

Are Fake Cell Towers Intercepting Your Calls?

By Doug Hornig, Senior Editor

We’re now into Year 2 AS (After Snowden), and many Americans remain concerned about the security of their cellphone calls. They should be, especially considering a phenomenon that’s hit the news in the past few months.

Fake cell towers.

With most phones, you have no way of knowing whether someone might be listening in. You may believe that you’re safe because your calls are encrypted.

Trouble is, you may not be.

If you’d like to be informed when your call is being intercepted, one company that can put the proper tech in your hands is ESD America. It manufactures the CryptoPhone 500, which has a Samsung Galaxy SIII body, but with the standard Android OS hardened by the removal of 468 vulnerabilities.

The CryptoPhone will set you back $3,500. When it detects that your call has been compromised, it lights up and displays a warning message: “Caution: The mobile network’s standard encryption has been turned off, possibly by a rogue base station (‘IMSI Catcher’). Unencrypted calls not recommended.”

(IMSI stands for “international mobile subscriber identity” and is a unique identification number used by all cellular networks. It’s generally 15 digits in length, allotting the first three digits to country code and the next three to the mobile network code, with the remainder comprising the mobile subscription identification number within the network’s customer base.)

IMSI catchers are portable devices also known as “interceptors” or “stingrays.” They are not themselves actual towers, but they mimic the real thing and trick your mobile device into connecting to them even if you aren’t on a call. Once locked on to you, stingrays can be used for real time location tracking, with the ability to pinpoint where you are within two meters. But they can also eavesdrop on and capture the contents of your communications.

Stingrays are not cheap—upwards of $150,000 each—but they’re portable. They can be hand carried or mounted on a vehicle or drone. While the abilities of these interceptors vary, the full featured versions available to government agencies have a broad range of powers. For example, the VME Dominator can not only capture calls and texts, it can even take control of the intercepted phone. Yes, it can turn on your powered down phone and essentially use it as a bug.

But didn’t the Supreme Court recently instruct police that they must obtain a warrant before they can search your phone? Not really. The ruling was more limited, stating that police must get a warrant “before searching a cell phone seized incident to an arrest.”

The 11th Circuit Court has also ruled that warrantless cellphone location tracking is unconstitutional. But that conflicts with an earlier judgment by the 5th Circuit, which stated that people have no expectation of privacy over location data collected by cell towers because they are nothing more than a business record. The Supreme Court has not yet resolved that one.

Stingrays, however, can basically serve as wiretapping devices. Shouldn’t a warrant be required for cellphone intercepts, as it would be if law enforcement wanted to tap your home phone or place a bug behind the painting in your office?

Technically, yes. The Wiretap Act of 1968 requires the police to get a court order whenever they want to intercept any oral, electronic communication, or wire communications. It’s also been established that that protection extends to cellphones that have been turned on remotely for eavesdropping purposes.

To what extent are authorities honoring that requirement? Decide for yourself after reading this excerpt from a recent Newsweek article:

In January, Tallahassee, Florida, police used [a stingray] to track a stolen cell phone to a suspect’s apartment. The police then entered the home without permission, conducted a search, and arrested the suspect in his home. Not only did the police not have a warrant, but they did not disclose to a judge that they were in possession of a stingray because the department had received it on loan from the manufacturer on condition of secrecy.

Only after a judge granted a motion filed by the ACLU to unseal the transcripts of the case (the federal government had previously demanded the proceedings be sealed, going so far as to try to invoke the Homeland Security Act as the reason) was it was revealed that between 2007 and 2010 the department used stingrays without getting warrants around 200 times.

One ACLU spokesperson put it like this: “They are essentially searching the homes of innocent Americans to find one phone used by one person … It’s like they’re kicking down the doors of 50 homes and searching 50 homes because they don’t know where the bad guy is.”

Even though data is obviously hard to come by, the ACLU has been able to determine that stingrays are in use in at least 18 states—by local police, state police, or both. They’re also widely employed by the federal government, so you might want to remember that if you’re using your phone in the vicinity of a government facility, particularly a military base.

And if you’re encrypting messages, don’t count on that to save you. A stingray can force your 4G service down to a 2G level to thwart encryption, and the best of them will do it so that you’re not even aware it’s happening. Support for 2G is going away—AT&T is phasing it out by 2017 and Verizon by 2020—but manufacturers of stingrays are hard at work on the next generation of product, which will feature the ability to crack 4G.

Mass surveillance of law abiding citizens is just one aspect of the global cyberwar that’s red hot yet all but invisible to most of us. Casey Research has prepared an in-depth look at the subject in its white paper, Cyberwar: Threats to Your Money and Freedom, and How to Protect Yourself.

We urge you to download a copy today

The article Are Fake Cell Towers Intercepting Your Calls? was originally published at caseyresearch.com.


Get INO.coms Trader TV today, Free Trading Videos and Lessons....Just Click Here!


Wednesday, January 8, 2014

This Thursday, John Carters "Voodoo Lines" Webinar

Free webinar on Thursday, January 9th at 8:00 p.m. eastern time. John Carter of Simpler Options is back with another one of his wildly popular free trading webinars.

In this Free Webinar you will learn:

    *   How to Identify Key Support and Resistance Levels
    *   What are Voo Doo Lines?
    *   Why Should You Care about Voo Doo Lines?
    *   What are the Voo Doo Lines Telling us now?
    *   John's Favorite Trading Strategies Using the Voo Doo and much more

Simply click here and we'll register you for this event

See you on the webinar!


Saturday, July 13, 2013

Free Webinar: How to Use Fibonacci Analysis in Your Trading Wednesday, July 17th at 8:00PM est

For years Carolyn Boroden has been using Fibonacci based market geometry and symmetry that provides the edge needed to succeed in choosing your entry and exits points for your biggest trades. And you can easily use these methods whether you are trading stocks, currencies, ETFs or commodities.

In this Free webinar Carolyn "The Fibonacci Queen" Boroden and "Simpler Options" John Carter will show us......

*     How to identify Fibonacci support & resistance zones

*    The simple way to manage your risk/reward using Fibonacci ratios

*    The brain dead easy ways to set up your support & resistance zones

*     How you can identify what markets to trade and when

*    The secret to identifying high probability targets in stocks and ETFs .... and much more

Simply click here and fill out your email address, click submit and you will be automatically registered for the webinar.

Watch "How to Use Fibonacci Analysis in Your Trading"

See you on Tuesday,
Ray @ The Stock Market Club

Monday, June 17, 2013

SP 500 Extends Rally Off Thursdays Low

The September S&P 500 closed higher on Monday as it extends the rally off last Thursday's low. The mid range close sets the stage for a steady opening when Tuesday's night session begins trading.

Stochastics and the RSI are diverging but have turned neutral to bullish signaling that sideways to higher prices are possible near term. Closes above the 20 day moving average crossing at 1633.22 would confirm that a short term low has been posted. If September renews the decline off May's high, the 38% retracement level of the November-May rally crossing at 1545.59 is the next downside target.

First resistance is the 20 day moving average crossing at 1633.22. Second resistance is May's high crossing at 1678.00. First support is the 25% retracement level of the November-May rally crossing at 1591.35. Second support is the 38% retracement level of the November-May rally crossing at 1545.59.

Make sure to check out "Options Income Access" it's now LIVE!

Friday, June 7, 2013

Gold, Silver & Precious Metal Miners Signals

It has been a very long couple of years for the precious metal bugs. The price of gold, silver and their related mining stocks have bucked the broad market up trend and instead have been sinking to the bottom in terms of performance.

Earlier this week I posted a detailed report on the broad stock market and how it looks as though it‘s uptrend will be coming to an end sooner than later. The good news is that precious metals have the exact flip side of that outlook. They appear to be bottoming as they churn at support zones.

While metals and miners remain in a down trend it is important to recognize and prepare for a reversal in the coming weeks or months. Let’s take a look at the charts for a visual of where price is currently trading along with my analysis overlaid.

Weekly Price of Gold Futures

Gold has been under heavy selling pressure this year and it still may not be over. The technical patterns on the chart show continued weakness down to the $1300USD per once which would cleanse the market of remaining long positions before price rockets towards $1600+ per ounce.

There is a second major support zone drawn on the chart which is a worst case scenario. But this would likely on happen if US equities start another major leg higher and rally through the summer.

PriceOfGold


Weekly Price of Silver Futures

Silver is a little different than gold in terms of where it stands from a technical analysis point of view. The recent 10% dip in price which shows on the chart as a long lower candle stick wick took place on very light volume. This to me shows the majority of weak positions have been shaken out of silver. Gold has not done this yet and it typically happens before a bottom is put in.

While I figure gold will make one more minor new low, silver I feel will drift sideways to lower during until gold works the bugs out of the chart.

PriceOfSilver

Silver Mining Stock ETF – Weekly Chart

Silver miners are oversold and trading at both horizontal support and its down support trendline. Volume remains light meaning traders and investors are not that interested in them down where and it should just be a matter of time (weeks/months) before they build a basing pattern and start to rally.

SilverMiningStocksETF


Gold Mining Stock ETF – Weekly Chart

Gold mining stocks continue to be sold by investors with volume rising and price falls. Fear remains in control but that may not last much longer.

GOldMiningStocksETF


Gold Junior Mining Stock ETF – Weekly Chart

Gold junior miners are in the same boat with the big boys. Overall gold and gold miners are still being sold while silver and silver stocks are firming up.

GoldJuniorMiningStocksETF


Precious Metals Trading Conclusion

In the coming weeks we should see the broad stock market top out and for gold miners along with precious metals bottom. There are some decent gains to be had in this sector for the second half of the year but it will remain very dicey at best.

If selling in the broad market becomes intense and triggers a full blown bear market money will be pulled out of most investments as cash is king. Gold is likely to hold up the best in terms of percentage points but mining stocks will get sucked down along with all other stocks for a period of time. This scenario is not likely to be of any issue for a few months yet but it’s something to remember.

Chris Vermeulen


Get My Daily Precious Metals Report Each Morning And Profit!


The Bible for Commodity Traders....Get our free eBook now!

Wednesday, May 8, 2013

How to Trade Gold, Silver & Precious Metal Miners....It's not that Difficult!

How to trade Gold and other precious metals related investments is not that complex. But you must be willing to wait for price to provide low risk entry points before getting involved. Precious metals are like any other investment in respect to trading and investing in them. There are times when you should be long, times to be in cash and times to be short (benefit from falling prices).

Since 2011 when gold and silver started another major bull market correction the best position has been to move to cash or sell/write options against your positions to protect your investment until the next trend resumes.

If you take a look at the chart below of gold you will notice that in 2008 we had a similar breakdown in price which purged the market of investors who where long gold. And if you compare the last two breakdowns they look very much the same. If price holds true then much higher prices are likely to unfold at the end of 2013.

The key here is for the price to move and hold above the major resistance line. If it can do that then we are looking at a possible breakout to $2600 – $3500 gold. With that being said gold and silver may just be starting a bear market. Depending what the price of gold does when my resistance level is touched, my outlook may change from bullish to bearish.

Also with last weeks economic numbers getting better in the USA I do have concerns that gold may be starting a bear market but we will not know for several more months yet.

LongTermWeeklyGold

How to Trade Gold Daily Technical Chart:

Major technical damage has been done to the chart of gold. This can be seen as bullish or bearish price action but until price and volume pattern unfolds which puts the odds on the bullish or bearish side I remain neutral.

LongTermGold

How to Trade Silver Daily Technical Chart:

Silver is in the same position as gold. The question is if this is a shakeout or breakdown......

LongTermSilver

How to Trade Gold Mining Stocks Monthly Chart:

Gold mining stocks broke down a couple months ago and continue to sell off. If precious metals continue to move lower then mining stocks will continue their journey down. The chart below made in February and it has in most part played out as expected. While I do not try to pick bottoms (catch falling knives) I do like to watch for them so I am prepared for a new position when the time and chart become bullish.

LongTermMiners


How to Trade Gold, Silver and Mining Stocks Conclusion:

In short, precious metals continue to be in a down trend. While they look to be trying to bottom it is important to remember that the largest moves take place in the last 10% of a trend. So we may be close to a bottom but there could be sharply lower prices yet.

The time will come when another major buy or short signal forms and when it does we will be getting involved. The exciting part is that it could be just around the corner.

If you want to keep current and take advantage of the next major move be sure to join our free newsletter here... Join our FREE Newsletter Today!


Check out our current specials for full subscription members.


Wednesday, September 7, 2011

Adam Hewison: What A Difference A Day Makes

The song goes like this; “What a difference a day makes....” Gold, sharply lower on heavy profit taking and liquidation. Equities, sharply higher as all the problems in the world are solved. The U.S. dollar has a hiccup. Crude oil up on new demand? All this while the world waits for President Obama’s speech tomorrow evening. Here’s a rhetorical question for you, how many cans can you kick down the road at the same time? Well, if you’re a politician you become pretty adept at kicking as many cans as you want down the road.

The S&P 500 continues to claw its way back from the lows yesterday around the 1140 area. However, the pattern in this market is not a positive one in my estimation. The Trade Triangles are in a longer term negative mode. We have to believe that this market is going to resume its downward trend. Today’s reading of +55 indicate a sideways trading range.

We would use the Williams %R indicator to establish new short positions. Long term traders should continue to maintain short positions or be out of the market completely in a cash position. Intermediate term traders should be on the sidelines waiting for either a buy, or sell signal based on our Trade Triangle technology.

Monthly Trade Triangles for Long Term Trends = Negative
Weekly Trade Triangles for Intermediate Term Trends = Positive
Daily Trade Triangles for Short Term Trends = Negative
Combined Strength of Trend Score = +55


Unlimited access to this and other trading videos FREE! Click Here!

Friday, July 15, 2011

The Beat Goes On And On And On…

The beat goes on and on and on. I am of course talking about the debt ceiling talks which are absolutely imperative to the U.S. I think that most Americans are just getting disgusted with both parties and I think come election time we will see some major changes.

This should be a very interesting Friday with Gold at or close to its highs and Silver higher for the day so far. The equity markets just seem to be hanging on by their fingernails now and I expect we will see further pressure on the markets as the day wears on. Unless there’s some major news that comes out I can’t imagine these markets rallying from their current levels.

The opportunities to make money right now are huge. We’ve outlined clearly in our past reports the line in the sand for the S&P 500 and of course we remain positive on the precious metals. One trade you might want to consider this weekend is Gold. If Gold closes at or close to its highs for the day we want to go home with an additional trading unit. If this happens it will qualify as a 52 week high trade rule which means you go home long Gold and take profits on Monday or Tuesday. Use tight money management stops on this position.

Now, let’s go to the markets and see how we can protect and make your money grow.

S&P 500

Monthly Trade Triangles for Long-Term Trends = Positive
Weekly Trade Triangles for Intermediate Term Trends = Positive
Daily Trade Triangles for Short-Term Trends = Negative
Combined Strength of Trend Score = + 75
It looks like this market is just teetering on the edge of a precipice. The symmetry of the S&P500 is striking and should not be ignored as we could be making a right shoulder of a much larger head and shoulders formation. The Trade Triangles remain in a positive mode and we are expecting resistance around the 1333 to 1338 levels. Look for support to come into this market around the 1300 level. The 200-day moving average comes in at 1276, as does a long-term trend line from the lows set in March of 2009.

SILVER

Monthly Trade Triangles for Long-Term Trends = Positive
Weekly Trade Triangles for Intermediate Term Trends = Positive
Daily Trade Triangles for Short-Term Trends = Positive
Combined Strength of Trend Score = + 90
A close today over 39.50 will be viewed as extremely bullish for this market. Traders should be long this market as all of our Trade Triangles are in a positive mode indicating higher prices ahead. As we have been indicating, we are expecting this market to reach highs towards the latter part of Q3 and early Q4. Look for support for this market at 36.00.

GOLD

Monthly Trade Triangles for Long-Term Trends = Positive
Weekly Trade Triangles for Intermediate Term Trends = Positive
Daily Trade Triangles for Short-Term Trends = Positive
Combined Strength of Trend Score = + 100
The current market action in gold is very positive and this market is more than likely going to qualify for a 52 week high rule. Any market that is making all time highs must be considered bullish. All of our Trade Triangles are green indicating that a strong trend is in place. We expect to see this market move over $1,600 an ounce in the near future. Longer term, we are looking for a move higher until the end of Q3 and possibly into Q4.

CRUDE OIL

Monthly Trade Triangles for Long-Term Trends = Negative
Weekly Trade Triangles for Intermediate Term Trends = Negative
Daily Trade Triangles for Short-Term Trends = Positive
Combined Strength of Trend Score = – 55
The -55 score indicates that this market remains in a trading range. At the present time, the crude oil market continues to have problems just over the $99 a barrel price point. Both are indicators long-term and intermediate term remain negative for this market. Support comes in around $94 a barrel and resistance coming in just over $99.

DOLLAR INDEX

Monthly Trade Triangles for Long-Term Trends = Positive
Weekly Trade Triangles for Intermediate Term Trends = Positive
Daily Trade Triangles for Short-Term Trends = Negative
Combined Strength of Trend Score = + 75
For the past two months, this index has been trapped in a broad trading range. The Dollar index remains below its 200 day moving average. The longer term trend for the Dollar index is positive based on our Trade Triangle technology. Resistance remains between 76.00 and 77.00. Support comes in today at 74.00.

REUTERS/JEFFERIES CRB COMMODITY INDEX

Monthly Trade Triangles for Long-Term Trends = Negative
Weekly Trade Triangles for Intermediate Term Trends = Positive
Daily Trade Triangles for Short-Term Trends = Positive
Combined Strength of Trend Score = + 60
Since May of this year this index has moved in a broad trading range. Our Trade Triangle technology is mixed on this market at the present time. Resistance is now at 350 and support looks to be at 340.


Unlimited access to this and other trading videos FREE! Click Here!

Share

Thursday, July 8, 2010

New Video: Is it time to go short the S&P 500?

The current rally in the S&P 500 is bringing this market back to key levels of previous support. Normally when you see rallies back to a previous support level, that support level then acts as resistance.

In our earlier videos, we discussed the death cross as well as some of the other key indicators that continue to remain negative on this market. Today, however, we pinpoint exactly where we think this market is going to run into trouble and where you should perhaps look to go short.

You are free to watch this video with no obligation and no need to register, but we would really like to get your feedback on this video as well as this market.


Watch Is it time to go short the S&P 500?


Share

Tuesday, May 25, 2010

The Market Bulls Will Throw In The Towel At These Levels

This month is shaping up to be a strong negative month for the global equity markets. The S&P 500 is down a whopping 11.34% for the month and 3.9% on the year. The DOW is a little better down only 9.58% for the month and 3.45% for the year.

Despite today’s late covering rally, the bigger picture indicates that we are down overall on the week and the month.

Here are the levels that if, and it is an if, the markets break, then the stock market bulls will throw in the towel.

Here are the key levels of support for the month of May for the major indices:

SP500 - 1044
DOW - 9,835
NASDAQ - 2,100

Let's see how the markets act for the balance of the month. It will be interesting.


New Video: How to Take Money and Emotion Out of The Gold Market


Share

Wednesday, March 31, 2010

Rare Glimpse into MarketClub....Once a Year 2 Week Trial, Now Open!


I'll keep this short as I know you're busy, I just got word from my inside contact at MarketClub, that they're opening up the premium service for a no cost 2 week trial!

Just click here to get instant access here....

There are 4 powerful tools available to members that you, as a free trial member, will have access to. Smart Scan, Trade School, Chart Analysis, and Data Central will be opened up just for you.

The other major bonus about this trial is that their, customer support team will be providing UNLIMITED support! You can call or email for an instant response (I know because I've used it) to any question, comment or concern. They've added another support person (hired a month ago just to train her) to ensure that all calls and emails get answered as quickly as possible.

Again, here's that link and I'll get you more info a little bit later, but I'd recommend you jump on this now.


Share

Wednesday, January 20, 2010

Here's Your Market Index Numbers For Wednesday Trading


The S&P 500 index was lower due to profit taking overnight but remains above the 10-day moving average. Stochastics and the RSI are neutral to bearish signaling that additional weakness is possible near term.

Closes below the 20 day moving average crossing at 1129.60 are needed to confirm that a short term top has been posted. If March renews this winter's rally, the 62% retracement level of the 2007-2008-decline crossing at 1155.15 is the next upside target.

SP 500 pivot point for Wednesday is 1145.48

First resistance is last Monday's high crossing at 1147.90
Second resistance is the 62% retracement level of the 2007-2008 decline crossing at 1155.15

First support is the 20 day moving average crossing at 1129.60
Second support is the reaction low crossing at 1110.00

Check out the new "Trend TV"

The NASDAQ 100 was lower due to profit taking overnight while extending month's trading range. Stochastics and the RSI remain bearish signaling that this month's trading range appears to be a correction more of time than price.

However, closes below last Tuesday's low crossing at 1850.00 would confirm that a short term top has been posted while opening the door for a larger degree decline in price. If March renews this winter's rally, the 75% retracement level of the 2007-2008 decline on the weekly continuation chart crossing at 1947.00 is the next upside target.

First resistance is last Monday's high crossing at 1900.00.
Second resistance is the 75% retracement level of the 2007-2008 decline on the weekly continuation chart crossing at 1947.00.

First support is last Thursday's low crossing at 1854.75
Second support is last Tuesday's low crossing at 1850.00

MarketClub Alerts.....Just Click Here!

Gold was lower overnight as it consolidates below broken support marked by the 10 day moving average crossing at 1136.80. Stochastics and the RSI are bearish signaling that a short term top might be in or is near.

Closes below the 20 day moving average crossing at 1119.10 would confirm that a short term top has been posted. If February renews the rally off December's low, the reaction high crossing at 1170.20 is the next upside target.

First resistance is last Monday's high crossing at 1163.00
Second resistance is the reaction high crossing at 1170.20

First support is the 20 day moving average crossing at 1119.10
Second support is the reaction low crossing at 1086.60

Over 1,000 Hours of Trading Education

The U.S. Dollar was overnight and trading above the 20 day moving average crossing at 77.78. Stochastics and the RSI are bullish signaling that sideways to higher prices are possible near term.

Closes above the 20 day moving average crossing at 77.78 would confirm that a short term low has been posted while opening the door for a test of December's high crossing at 78.77. If March renews the decline off December's high, the 50% retracement level of the November-December rally crossing at 76.66 is the next downside target.

First resistance is the overnight high crossing at 78.26
Second resistance is December's high crossing at 78.77

First support is Tuesday's low crossing at 77.09
Second support is last Wednesday's low crossing at 76.74

Get 4 FREE Trading Videos from INO TV!

Share

Friday, January 8, 2010

Traders Looking to Digest Worse Then Expected Job Numbers


The S&P 500 was higher overnight as it extends this week's rally. Stochastics and the RSI are overbought but remain neutral to bullish signaling that sideways to higher prices are possible near term. If March extends this rally, the 62% retracement level of the 2007-2008 decline crossing at 1155.15 is the next upside target. Closes below the 20 day moving average crossing at 1115.88 are needed to confirm that a short term top has been posted. First resistance is the overnight high crossing at 1139.40. Second resistance is the 62% retracement level of the 2007-2008 decline crossing at 1155.15. First support is the 10 day moving average crossing at 1126.98. Second support is the 20 day moving average crossing at 1115.88.

The NASDAQ 100 was higher overnight as it consolidates some of this week's decline. Stochastics and the RSI are overbought but remain neutral to bullish signaling that sideways to higher prices are possible near term. If March extends last year's rally, the 75% retracement level of the 2007-2008 decline on the weekly continuation chart crossing at 1947.00 is the next upside target. Closes below the 20 day moving average crossing at 1843.11 would confirm that a short term top has been posted. First resistance is Wednesday's high crossing at 1891.75. Second resistance is the 75% retracement level of the 2007-2008 decline on the weekly continuation chart crossing at 1947.00. First support is the 10 day moving average crossing at 1875.82. Second support is the 20 day moving average crossing at 1843.11.

The U.S. Dollar was higher as it extends Thursday's rally. However, stochastics and the RSI remain neutral to bearish hinting that additional weakness is still possible near term. Closes below Tuesday's low crossing at 77.39 are needed to confirm that a short term top has been posted. If March renews last month's rally, the 38% retracement level of the 2008-2009 decline crossing at 79.72 is the next upside target. First resistance is the overnight high crossing at 78.32. Second resistance is the reaction high crossing at 78.77. First support is the 20 day moving average crossing at 77.84. Second support is Tuesday's low crossing at 77.39.

Get your favorite symbols' Trend Analysis TODAY!

Share

Tuesday, January 5, 2010

Markets Signals Appear to be Turning Neutral


The S&P 500 index was slightly higher overnight as it extends Monday's rally. Stochastics and the RSI are turning neutral signaling that sideways to higher prices are possible near term. If March extends last year's rally, the 62% retracement level of the 2007-2008 decline crossing at 1155.15 is the next upside target. Closes below the 20 day moving average crossing at 1109.02 are needed to confirm that a short term top has been posted. Tuesday's pivot point is 1127.81. First resistance is Monday's high crossing at 1129.80. Second resistance is the 62% retracement level of the 2007-2008 decline crossing at 1155.15. First support is last Thursday's low crossing at 1110.00. Second support is the 20 day moving average crossing at 1109.02.

The NASDAQ 100 was slightly lower overnight as it consolidates some of Monday's rally. Stochastics and the RSI are overbought but remain neutral signaling that sideways to higher prices are possible near term. If March extends last year's rally, the 75% retracement level of the 2007-2008 decline on the weekly continuation chart crossing at 1947.00 is the next upside target. Closes below the 20 day moving average crossing at 1828.30 would confirm that a short term top has been posted. First resistance is Monday's high crossing at 1889.00. Second resistance is the 75% retracement level of the 2007-2008 decline on the weekly continuation chart crossing at 1947.00. First support is the 10 day moving average crossing at 1864.22. Second support is the 20 day moving average crossing at 1828.30.

The U.S. Dollar was slightly lower overnight as it extends Monday's decline below initial support marked by the 10 day moving average crossing at 78.18. Stochastics and the RSI are bearish hinting that a short term top might be in or is near. Closes below the 20 day moving average crossing at 77.60 are needed to confirm that a short term top has been posted. If March renews last month's rally, the 38% retracement level of the 2008-2009 decline crossing at 79.72 is the next upside target. First resistance is the 10 day moving average crossing at 78.18. Second resistance is the reaction high crossing at 78.77. First support is the 20 day moving average crossing at 77.60. Second support is the overnight low crossing at 77.39.

Gold was higher overnight as it extends Monday's close above the 20 day moving average crossing at 1114.70. Stochastics and the RSI remain bullish signaling that sideways to higher prices are possible near term. If February extends this week's rally, the reaction high crossing at 1142.90 is the next upside target. Closes below the reaction low crossing at 1086.60 would confirm that a short term top has been posted. First resistance is the overnight high crossing at 1128.40. Second resistance is the reaction high crossing at 1142.90. First support is the 20 day moving average crossing at 1114.60. Second support is the 10 day moving average crossing at 1101.70.

Today’s Stock Market Club Trading Triangles

Share

Monday, July 20, 2009

Markets Open Higher, CIT Announces Private Deal


The S&P 500 was higher overnight as it extends last week's rally. Stochastics and the RSI remain bullish signaling that sideways to higher prices are possible near term.

If September extends the rally, June's high crossing at 952.50 is the next upside target. Closes below the 10 day moving average crossing at 904.71 would temper the near term friendly outlook in the market.

Day traders are looking for bullish set ups taking us past the -23% level of 945 and sellers will step in at the expected resistance at 957 double top area.

Monday's pivot point, our line in the sand is 935.50

First resistance is the overnight high crossing at 944.70
Second resistance is June's high crossing at 952.50

First support is the 20 day moving average crossing at 905.19
Second support is the 10 day moving average crossing at 904.71

The September S&P 500 Index was up 7.10 points at 944.00 as of 6:06 AM CST. Overnight action sets the stage for a higher opening by the September S&P 500 index when the day session begins later this morning.

Today’s Stock Market Club Trading Triangles


The NASDAQ 100 was higher overnight as it extends last Friday's rally above June's high crossing at 1516.00. Stochastics and the RSI remains bullish signaling that sideways to higher prices are possible near term.

The breakout above June's high has opened the door for a possible test of the 62% retracement level of last summer's decline crossing at 1635.44 is the next upside target. Closes below the 20 day moving average crossing at 1459.76 would temper the near term friendly outlook in the market.

First resistance is the overnight high crossing at 1539.25
Second resistance is the 62% retracement level at 1635.44

First support is the 20 day moving average crossing at 1459.76
Second support is last Wednesday's gap crossing at 1453.25

The September NASDAQ 100 was up 6.50 points at 1534.50 as of 6:05 AM CST. Overnight action sets the stage for a higher opening by June NASDAQ 100 when the day session begins later this morning.

Create FREE Portfolio Click Here