Showing posts with label Silver. Show all posts

Thursday, February 18, 2021

Gold Setting Up Major Bottom So Could We See A Breakout Rally Begin Soon?

There has been quite a bit of chatter related to precious metals lately. The rally in Cryptos, particularly Bitcoin, and various other stocks have raised expectations that Gold and Silver have been overlooked as a true hedging instrument. As these rallies continue in various other stocks and sectors, Gold and Silver have continued to trade sideways over the past 6+ months – when and how will it end?

Gold Support Near $1765 May Become a New Launchpad

My research team and I believe the recent downside trend in Gold has reached a support level, near $1765, that will act as a launching pad for a potentially big upside price trend. This support level aligns with previous price highs (May 2020 through June 2020) after the Covid-19 price collapse, which we believe is an indication of a strong support level. As you can see from the Gold Futures Weekly chart below, if Gold price levels hold above $1765 then we feel the next upside rally in metals could prompt a move targeting $2160, then $2400....Read More Here.


Friday, February 12, 2021

Platinum Begins Big Breakout Rally....What Does That Mean for Investors & Traders?


If you were not paying attention, Platinum began to rally much higher over the past 3+ days – initiating a new breakout rally and pushing well above the $1250 level. What you may not have noticed with this breakout move is that commodities are hot – and inflation is starting to heat up. What does that mean for investors/traders?

Daily Platinum Chart Shows Clear Breakout Trend

First, Platinum is used in various forms for industrial and manufacturing, as well as jewelry and numismatic functions (minting/collecting). This move in Platinum is more likely related to the increasing inflationary pressures we’ve seen in the Commodity sector coupled with the increasing demand from the surging global economy (nearing a post-COVID-19 recovery). The most important aspect of this move is the upward pricing pressure that will translate into Gold, Silver, and Palladium.

We’ve long suggested that Platinum would likely lead a rally in precious metals and that a breakout move in platinum could prompt a broader uptrend in other precious metals. Now, the combination of this type of rally in Platinum combined with the Commodity rally and the inflationary pressures suggests the global markets could be in for a wild ride over the next 12 to 24+ months....Read More Here.


Saturday, January 16, 2021

Our Custom Valuations Index Suggests Precious Metals Will Decline Before Their Next Attempt to Rally

My team prepares Custom Valuations Index charts to understand how capital is being deployed in the global markets alongside U.S. Dollar and Treasury Yields. The purpose of the Custom Index charts in this article is to provide better insight into and understanding of underlying capital movements in various market conditions. 

 Recently, we discovered the Custom Index chart shares a keen alignment with Gold (and likely the general precious metals sector). Let’s explore our recent analysis to help readers understand what to expect next in precious metals.

Weekly Custom Valuations Index Chart

The first thing that caught my attention was the very clear decline in the weekly Custom Valuations Index recently, as can be seen in the chart below. The second peak on the Custom Valuations Index chart occurred on the week of August 3, 2020. Gold also peaked at this very same time. This alignment started an exploratory analysis of the Custom Valuations Index and the potential alignment with the precious metals sector....Read More Here.


Thursday, January 14, 2021

Review of our recent BAN trade in SILJ


After recently closing our SILJ BAN trade, I want to take this opportunity to dissect our trade, including the process of selecting the proper exit targets and protecting capital within a trade. The BAN Trader Pro strategy incorporates these same techniques automatically within the decision making process of generating signals and taking trades.

With our recent SILJ trade, we initiated the entry on the upside breakout in price on November 5, 2020 – near $15.50. This upside breakout move prompted a new BAN trade trigger with SILJ near the top of the BAN Hotlist, suggesting further upside trending would continue.

Of course, nothing ever happens 100% as expected... like the announcement of Pfizer's vaccine being 90% effective coming out only days after making the trade! The immediate downturn in price activity resulted in our SILJ trade staying below our entry price for more than 30 days. Read on to see how we still made money on the trade....Read More Here.


Wednesday, January 13, 2021

Revisiting Our October 23rd "Four Stocks to Own" Article – Part I


Just before the U.S Elections, we authored an article related to four stocks/sectors that we thought would do well immediately after the November 2, 2020 elections. The article highlighted how sector rotation in almost any market trend can assist traders in finding solid trading triggers. 

We picked four stocks from various sectors for this example....

AAL   American Airlines Travel/Leisure
ACB   Aurora Cannabis Cannabis
GE     General Electric Industrial/Specialty Industry
SILJ   Junior Silver Miners ETF Precious Metals Miners


When you review my Yahoo! Finance article from October 23 and the November 6 follow up article related to these stock picks, you will quickly see that all of these stocks exhibited similar types of technical patterns. They were all bottoming in an extended rounded bottom formation and had all started to near a Pennant/Flag Apex in price. Additionally, many of them, with the exception of SILJ, had set up a very clear RSI technical divergence pattern over the course of setting up the extended bottom in price.

My research team and I selected these stocks because of key expectations related to the post election mentality of investors related to various sectors. First, the cannabis sector had a number of new US states approve cannabis legislation – providing for an expected increase in business activity for the entire cannabis sector. Second, no matter who won the election, another round of stimulus was likely to be approved resulting in increased economic opportunity for companies like GE and AAL. The Travel and Leisure sector still had its risks as a surge in COVID cases could greatly disrupt future travel expectations. Junior Silver Miners was our “hedge trade”. If none of these other stocks started to rally, then Silver Miners would likely move 15% to 20%+ higher over time....Continue Reading Here.


Saturday, November 14, 2020

Gold's Momentous Rally from 2000 Compared to SPY and QQQ - Part I

My research team and I went off on a wild tangent trying to identify how the markets could react to the recent spike in price activity on Monday, November 9, 2020. This is the day that Pfizer announced a 90% effective rate with its new COVID-19 vaccine, causing the US stock market to skyrocket higher before the opening bell in New York. As with most pop and drops, this incredible upside spike trailed lower for the remainder of the trading day. My research team was curious if this type of setup presented any real future outcome or trends. To this end, we focused on the QQQ and the SPY in relationship to Gold.

9 to 9 1/2 Year Gold Depreciation Cycle Ended in 2018 – What’s Next? 

Gold has been and continues to be a store of value for many around the world. At some times in history, Gold becomes undervalued in comparison to other assets (like stocks, real estate, and other tangible assets). At other times, Gold becomes more highly valued in comparison to other assets. This cycle has taken place throughout hundreds of years of history, and is rooted in the changing perceptions of market participants regarding “what/where is true value in the markets”.

When other assets are skyrocketing higher, Gold is out of favor in terms of real demand. It may still be moving higher in value, but as long as other assets seem to be increasing in value faster than Gold, demand for Gold will diminish. When most other assets enter a time of great concern or devaluation, Gold and Precious Metals usually begin to see stronger demand as the ratio between Gold prices and more traditional investment assets may be near extremes....Continue Reading Here.


Stock & ETF Trading Signals

Tuesday, November 3, 2020

Gold and Silver Supercycles Explored

Heading into what will likely become one of the biggest events in American political history on November 3, the US stock markets are holding up quite well on Monday, November 2. My team and I have published a number of articles recently suggesting we believe wild price swings and increased volatility is to be expected before and after the US elections. 

We have even suggested a couple of stock trades that we believe should do fairly well 60+ days after the elections are complete. Right now, we want to bring your attention to the Silver Junior Miners ETF (SILJ).

The current Pennant/Flag formation that is setting up in SILJ on the following Monthly chart has peaked our attention. Diminishing volume and moderately strong support above the $12 price level suggest key resistance near $15.05 will likely be retested as metals and miners continue to attract safe-haven capital after the elections. The Apex of the Pennant/Flag formation appears to be nearly complete – a breakout or breakdown move is pending. We believe the uncertainty of the elections will prompt a possible breakout (upside) price trend in the near future....Continue Reading Here.


Stock & ETF Trading Signals

Sunday, October 11, 2020

Learn Why Energy Stocks are Underperforming

Financial Survival Network Interview Highlights....
  • After a 30 year rally in the bond market, interest rates can’t go much higher given the lack of trust resulting in marginal returns. 
  • The lack of demand coupled with too much supply in the oil market has oil companies losing money   at these prices. Energy stocks have been underperforming which will likely continue until demand picks up or supply is significantly curtailed. 
  • Any stock market weakness or strength in the US dollar will likely lead to $1,810 Gold and $21 Silver.


Stock & ETF Trading Signals

Monday, September 14, 2020

It’s Go Time for Gold - Next Stop $2,250

Research Highlights....

* Gold Pennant/Flag formation is now complete and setting
   up new momentum base near $1,925. 

* Our Adaptive Fibonacci Models suggest support will prompt 
   new Gold rally to $2,250.

* The rally in Gold will continue to extend higher over the next
   4+ weeks.

The U.S. Dollar may move lower and/or the US stock market may break recent support to prompt this new rally in Gold. If you are a follower of my research, then you know I follow gold and silver closely. I believe Gold has completed a Pennant/Flag formation and has completed the Pennant Apex. 

Further, a new momentum base has setup near $1,925 - $1,930, near the upper range of our Adaptive Fibonacci Price Modeling System’s support range. My team and I believe the current upside price move after the Pennant Apex may be the start of a momentum base rally targeting the $2,250 level or higher.....Continue Reading Here.


Stock & ETF Trading Signals

Saturday, August 22, 2020

Precious Metals Cycles Demand Attention

Over the past few weeks and months, my research team and I have been actively publishing this research to help you better understand what is really happening in the markets right now. With Gold trading above $2,000 for the first time and Silver trading near $27.50, skilled traders need to understand the risks in the markets that precious metals are warning of. Think of it like this, as long as Gold continues to trade near or above $1900, the risk levels in the global markets are at extreme levels for traders and investors. If Gold breaks above $2,400, then there is a very real concern that the global markets could be close to some type of decline/collapse event.

1990 TO 2010: SIMILARITIES ABOUND

My research team believes the US stock market has already peaked near the January/February 2018 market highs. Our proprietary index analysis and price modeling systems suggest the US stock market has been buoyed by the U.S. Federal Reserve stimulus and foreign capital inflows (investment) while the US Dollar has strengthened. This trend may continue for a number of weeks or months, but precious metals are already warning that real fear has accelerated to levels we’ve not seen since 2010-2011....Continue Reading Here.


Stock & ETF Trading Signals

Saturday, July 25, 2020

Silver Begins Big Upside Rally Attempt

The move we saw in Silver early this week to new 6-year high price levels, above $22.60, is quite likely the biggest upside move in Silver since the bottom in March 2020 – after the US stock market collapsed because of the COVID-19 virus event. This new rally in Silver is likely the move we’ve been suggesting to our followers relating to a series of measured upside price moves totaling approximately $5.30 in each advance.

We wrote about these measured price moves in Gold and Silver in this article – Click Here

As traders, watching bonds accelerate moderately higher as the US Dollar falls and the stock market attempts new lofty levels, we are intrigued by the move in metals because it suggests a large segment of investors believe a bubble is nearing very peak valuation levels. The only reason metals, particularly Silver, would be accelerating as it has recently is that traders have suddenly adopted a stronger demand for second stage hedging of risk....Continue Reading Here.


Stock & ETF Trading Signals

Friday, July 10, 2020

Retail Traders & Investors Squeezed to Buy High Risk Assets Again

Yes, we certainly live in interesting times. This, the last segment of our multi-part article on the current Q2 and Q3 2020 US and global economic expectations, as well as current data points, referencing very real ongoing concerns, we urge you to continue using common sense to help protect your assets and families from what we believe will be a very volatile end to 2020. If you missed the first two segments of this research article, please take a moment to review them before continuing.

On May 24th, 2020, we published this research article related to our super cycle research. It is critical that you understand what is really happening in the world as we move through these major 21 to 85+ year super-cycles and apply that knowledge to the data we have presented in the first two segments of this research post. Within that article, we quoted Ray Dalio from a recent article published related to his cycle research.

That rather chilling statement suggests one thing that we all need to be aware of at this time: what the current and future economic cycles will likely present and how the world will navigate through this process of a cycle transition....Continue Reading Here


Stock & ETF Trading Signals

Friday, June 5, 2020

Gold & Silver “Washout” - Get Ready for a Big Move Higher

Gold and Silver moved lower early on June 2nd and 3rd. Our research team believes this is a “Washout Low” price rotation following a technical pattern that will prompt a much higher rally in precious metals. This type of washout price rotation is fairly common before very big moves after Pennant/Flag formations or just after reaching major price trigger levels.

With Gold, a sideways Pennant/Flag formation has been setting up near our GREEN Fibonacci Price Amplitude Resistance Arc. We believe the downward price rotation recently is a perfect setup for skilled technical traders to take advantage of lower entry price levels. The GREEN Fibonacci Price Amplitude Arc will very likely be breached over the next 5 to 10 trading days and the price of Gold should rally well above $1850 in the process. We believe this Washout Rotation is a process of running through the Long Stops just below recent price activity that will end with a defined upside price rally over the next 2 to 5+ weeks.

Before we continue, be sure to opt-in to our free market trend signals 
 before closing this page, so you don’t miss our next special report!


Silver has set up a completely different type of price pattern – a true Double-Top pattern. The downward price rotation recently in Silver is indicative of a weaker reaction to this massive resistance pattern and Double-Top. The likelihood that Silver will find support above $17 and mount a further upside price rally over the next 2 to 5+ weeks is still very strong. After the deep downward price collapse in Silver took place, just like what happened in 2009 and 2010, the upside potential for Silver is still massive – likely targeting $65 per ounce of higher.


This current Gold to Silver Ratio Monthly chart highlights the recent collapse in the ratio level as Silver rallied from near $12 towards current levels near $18. A similar spike in the Gold to Silver Ratio took place in 2008-09 – just before the broader market collapse in the US and Global markets took place. This happens as the initial reaction to risk in the global markets pushes Gold prices a bit higher while Silver, the often overlooked store of value, typically declines in value.

Once the price of Silver starts to rally, pushing the Gold to Silver ratio below 60 typically, both Gold and Silver start to align in price and begin to rally together. The current level of the Gold to Silver ratio is 94.9. This suggests that both Gold and Silver have quite a way to go in terms of reaching the “alignment phase”. Our researchers believe Gold will rally above $2100 to $2400 and Silver will rally above $40 to $50 before the two metals align and begin to rally together in almost equal strength.


Concluding Thoughts

Pay attention to what happens to precious metals over the next 10 to 15+ days. If our research is correct, both Gold and Silver will rally higher by about 7.5% to 14% – setting up new price highs for both metals. When the washout pattern completes, usually a fairly aggressive price trend begins where new price highs are established fairly quickly. Get ready, this should be a really nice upside price swing in precious metals over the next 6+ months or longer.

The next few years are going to be full of incredible opportunities for skilled traders and investors. Huge price swings, incredible revaluation events, and, eventually, an incredible upside rally will start again.

I’ve been trading since 1997 and I’ve lived through numerous market events. The one thing I teach my members is that risk is always a big part of trading and that’s why I structure all of my research and trading signals around “finding profits while reducing overall risks”. Sure, there are fast profits to be made in these wild market swings, but those types of trades are extremely risky for most people – and I don’t know of anyone that wants to risk 50 or 60% of their assets on a few wild trades.

I’m offering you the chance to learn to profit, as I do with my own money, from market trends that I hand-pick for my own trading. These are not wild, crazy trades – these are simple, effective, and slower types of trades that consistently build wealth. I issue about 4 to 8+ trades a month for my members and adjust trade allocation based on my proprietary allocation algo – the objective is to gain profits while managing overall risks.

You don’t have to spend days or weeks trying to learn my system. You don’t have to try to learn to make these decisions on your own or follow the markets 24/7 – I do that for you. All you have to do is follow my research and trading signals and start benefiting from my research and trades. My new mobile app makes it simple – download the app, sign in and everything is delivered to your phone, tablet, or desktop.

I offer membership services for active traders, long term investors, and wealth/asset managers. Each of these services is driven by my own experience and my proprietary trading systems and modeling systems. I have a small team of dedicated researchers and developers that do nothing but research and find trading signals for my members. Our objective is to help you protect and grow your wealth.

Please take a moment to visit The Technical Traders to learn more. I can’t say it any better than this… I want to help you create success while helping you protect and preserve your wealth – it’s that simple.

Chris Vermeulen
Chief Market Strategist
Founder of the Technical Traders 


Monday, April 13, 2020

We Adjusted Our Retirement Account Positions with This Major Signal Issued - Did You Get The Signal?

Our trading partner Chris Vermeulen, who are readers have followed for a while now, is loving what is happening in the markets for the last three weeks. He wants a big bounce here because it is going to set us up with a huge long-term investment position once price confirms this next entry signal.

Last week Chris issued a trade alert to members of his long-term investing newsletter. This allows you to protect your wealth and assets while continuing to take advantage of opportunities generated by the U.S and global markets over the next several months and possibly into next year. This is the first trade alert issued in 2020 of this kind, and he may have another very soon, but it's not too late to take advantage of the first signal.

If you are a trader or investor, with a retirement account of any type, or have assets in the stock market, then you need to take action and sign up to get these important investment trade signals.

We all have trading accounts, and while our trading accounts are important, what is even more important are our long-term investment and retirement accounts. Why? Because they are, in most cases, our largest store of wealth other than our homes.

If they are not protected during a time like this, you could lose another 25-50% or more of your entire net worth. The good news is we can preserve and even grow out long term capital when things get ugly like they are now and Chris shows us how.

Check It Out Here

Sincerely,

Chris Vermeulen
Founder of The Technical Traders


Stock & ETF Trading Signals

Thursday, March 12, 2020

Revisiting Our July 2019 Crude Oil Predictions & Our 2020 Forecast

When it comes to our Adaptive Dynamic Learning (ADL) predictive modeling system, we get asked questions from our friends and followers about how it could predict a virus event or how it could predict a price event so far out into the future. The truth of the matter is the ADL predictive modeling system doesn’t predict unknown virus, banking or other types of events.

What it does do, quite well we might add, is identify historically accurate price events (almost like unique DNA markers) and attempts to identify future price events that align with recent price bar (DNA) setups. In other words, it maps the markets highest probability outcomes by studying past price activity and using a unique DNA like mapping system. Once this analysis is complete for any chart, we can ask it what is likely to happen in the future.

On July 8, 2019, our researchers did exactly that and posted an article regarding our findings that many people continue to write us about. Some, at first, in total disbelief that Crude Oil could fall to levels below $40 ever again and others that wanted to know how we came up with these numbers. We set our ADL system to show us what is expected on a Monthly Crude Oil chart going forward and it draws the likely outcome and volatility (highs & Lows).

Here is a link to the original article....Just Visit Here

This Screen Capture From The Original July 2019 Article Clearly States

If our ADL predictive modeling is correct, we will see rotation between $47 and $64 over the next 3+ months before a breakdown in price hits in November 2019. This will be followed by two fairly narrow price range months (December 2019 and January 2020) where oil prices will tighten near $45 to $50. After that tightening, we believe an extremely volatile price move will happen in February through April 2020 that could see oil prices trade as low as $22 and as high as $51 over a two to three-month span.

The most critical component of this early research is the statement we have timed perfectly with our system was “we believe an extremely volatile price move will happen in February through April 2020” and the following price predictions.

The ADL predictive modeling system provided us with a hint that volatility would skyrocket throughout this time in Crude Oil. And, as we all know, this next Daily Crude Oil chart highlights the incredible collapse from early January 2020 (near $65.00) to levels just below $50 in early February. After that, the high price level was near $54.50 and the current low price level is $27.34. We believe this downward price rotation in Crude Oil completely validates our earlier ADL predictive analysis.


Imagine having this type of forecast for our trading and investing! Be sure to opt-in to our free market trend signals newsletter before closing this page so you don’t miss our next special report!

What's Next With The Price of Crude Oil?

Based on short term Fibonacci price momentum targets we could see fall as low as $17 per barrel, but this price target will change dramatically over the next few days depending on if oil bounces higher from here it is now.


If our research is correct, Crude oil may find a bottom somewhere near $17 to $24, the potential rally back up to somewhere above $37 - $41 ppb before staging another massive selloff. The massive volatility suggested by the ADL system also suggests a broad price range over the next 60+ days.

Thus, we believe crude oil will attempt to form a bottom below $30, then attempt a brief rally to “fill the gap” (or partially fill the gap). After that, supply side economics will take over and crude oil should begin to move back towards the to $30 price level again – just as our ADL predictive modeling system suggested.

As of today, we are getting dozens of emails asking about what we see for the US major markets and global markets with our systems. Everyone wants to know “what’s next?”. Most of that research is delivered to our active subscribers/members and you can gain access to that information simply by visiting my website. You really don’t want to miss these next huge moves.

As a technical analysis and trader since 1997, I have been through a few bull/bear market cycles. I believe I have a good pulse on the market and timing key turning points for short term swing traders.

Visit my ETF Wealth Building Newsletter and if you like what I offer, and ride my coattails as I navigate these financial markets and build wealth while others lose nearly everything they own during the next financial crisis.

Chris Vermeulen
The Technical Traders


Stock & ETF Trading Signals

Sunday, February 23, 2020

Gold Rallies as Fear Take Center Stage

Gold has rallied extensively from the lows near $1560 over the past 2 weeks. At first, this rally didn’t catch too much attention with traders, but now the rally has reached new highs above $1613 and may attempt a move above $1750 as metals continue to reflect the fear in the global markets.

We’ve been warning our friends and followers of the real potential in precious metals for many months – actually since early 2018. Our predictive modeling system suggests Gold will rally above $1650 very quickly, then possibly stall a bit before continuing higher to target the $1750 range.

The one thing all skilled traders must consider is the longer term fear that is building in the markets. Many traders are concerned about the global economy with the Coronavirus spreading economic worries throughout Asia, Japan, and Europe. We believe this fear will push precious metals continually higher over the next 24+ months with a real upside target above $2100 eventually.

Right now, skilled traders need to understand that wave after wave of higher price rotation will continue to happen in Gold and Silver. If you missed the $1450 level and missed the $1550 level, this is your time to attempt to find your entry point near $1650 or below that level. Ultimately, real fear has yet to result in a parabolic rally in Gold and Silver – but it is likely going to happen within the next 24+ months.


As skilled traders, our Fibonacci price modeling system is suggesting that any price rotation below $1550 would be an excellent buying opportunity. These levels really depend on where the current rally ends and what happens in the global markets over the next 60+ days.

Less than 7 days ago, we published this research article suggesting that our ADL predictive modeling system was telling us that Gold would rally above $1650 within 15 to 30 days. It is very likely this rally will start a multiple leg upside price advance in precious metals where Silver will finally breach the $20 to $21 level as Gold advances higher.

February 13, 2020: Predictive Modeling Suggests Gold Will Break Above $1650 Within 15 - 30 Days


Once fear really enters the markets, we’ll see huge sector rotation and a massive price reversion event take place. Historically, Gold and Silver will react to this move, but the parabolic price move in precious metals will come 4 to 6+ months after the reversion event in the global markets. So, from a historical standpoint, any entry-level near current price levels is exceptional.

Trust us, you really don’t want to miss this next move in precious metals. Our Fibonacci price modeling system and Adaptive Dynamic Learning modeling system are suggesting price levels above $2400 as an ultimate upside price target for Gold.

Join my Swing Trading ETF Wealth Building Newsletter if you like what you read here and ride my coattails as I navigate these financial markets and build wealth while others lose nearly everything they own.

Chris Vermeulen
The Technical Traders


Stock & ETF Trading Signals

Friday, January 3, 2020

ADL Gold Prediction Confirms Our Targets

The Gold rally we predicted to happen in late 2018 took place, almost perfectly, based on our ADL predictive modeling systems results. This rally took place in May through September 2019 and pushed Gold up to levels near $1600. The rest of the year, Gold consolidated near $1500 as a strong US Stock Market rally took hold in Q4 of 2019.

Our original prediction was that Gold would rally to levels near $1750 before the end of 2019 based on our Adaptive Dynamic Learning predictive modeling system (ADL). This did not happen in 2019 as out ADL modeling systems suggested, but it appears Gold is setting up for another massive upside rally in 2020.

Taking a look at our ADL predictive modeling systems on Monthly charts for Gold and Silver, we see two very interesting suggestions setting up :

  • First, Gold may attempt a rally to a level above $1700 before March/April 2020 and potentially extend this rally to well above $1850 by August/September 2020.


  • Second, Silver appears to lag behind this Gold rally by about 7 to 8 months. Silver does not appear to want to start a rally until well after July or August 2020.

If we consider what happened in 2008/09 with the global credit market crisis, both Gold and Silver contracted lower near the start of this crisis (in late 2008). Eventually, Gold began to move higher in August/September 2009 (well into the crisis event). Silver didn’t really start to accelerate higher will August 2010 – a full 12 months after the Gold rally started.

Our ADL system is suggesting that the Silver rally will lag behind the gold rally by about 10 to 14 months given the ADL predictions for price activity in 2020. Thus, Gold may continue to rally much higher fairly early in 2020, yet we won’t see much upside movement in Silver till after July 2020.

Monthly Gold ADL Chart

This first Monthly Gold ADL chart highlights the ADL predictive modeling systems suggestion related to future price targets. We can see the upside move in Gold should begin with an upside target near $1600-1625 over the next 60+ days. After that, the rally should accelerate higher in April/May 2020 with another move higher towards $1700-1725. By August/September 2020, Gold should attempt a rally to levels above $1800-1850 and then begin to consolidate above $1800 for a few months.


Silver Monthly ADL Chart

This Silver Monthly ADL chart suggests that Metals will react very similar in 2020 to what happened in 2008-09. While Gold began to rally in August 2009, Silver did not begin to accelerate higher till August/September 2010. This delay in the understanding that Silver presents valid protection against risk may take place in this current upside rally in Gold. If the ADL predictions are accurate, then Silver will continue to provide buying opportunities for many months near $17.50-$18.00 before a major upside price advance begin.

By July 2020, Our ADL predictive modeling system is suggesting Silver will advance to levels above $18.25, then begin a major price advance to levels above $19-20 fairly quickly. Please keep in mind the scope of these predictions related to the global markets and the U.S. Presidential elections. We read into this that a lot of chaos/turmoil may be taking place in the US/World after June/July 2020.


Weekly Gold Chart

This last chart is a Weekly Gold chart highlighting our Fibonacci Price Amplitude Arcs and the major resistance level that has just been broken in Gold. The heavy GREEN arc and the BLACKLINE that we’ve drawn on this chart represent massive resistance originating from the lows near August 2018 in Gold. We believe this resistance level, once broken, will prompt a major upside price move in Gold to levels closer to or above $1700. If this price advance in Gold aligns well with our ADL predictions, then we believe fear will continue to drive future a future price advance in Gold and that fear may be related to continued Global stock market concerns and the U.S. elections.


2020 may be a very good year for precious metals traders who are able to identify solid entry trades for these moves. If our ADL predictions are accurate, Gold should rally over 25% before the end of 2020. Silver may rally as much as 15% before the end of 2020. The timing of these moves suggests Gold traders will have opportunities for bigger price advanced early in 2020 and will begin a larger upside price move after February/March 2020. Silver will begin an upside price move after basing near the March/April 2020.

2020 is going to be a fantastic year for skilled technical traders. Join us and our valued members in finding great trades and incredible opportunities in the markets by joining The Technical Traders.

Chris Vermeulen
The Technical Traders Ltd.


Stock & ETF Trading Signals

Saturday, December 14, 2019

Seven Year Cycles Can Be Powerful and Gold Just Started One

Our research and predictive modeling systems have nailed Gold over the past 15+ months. We expected Gold to rally above $1750 before the end of this year, but the global trade wars and news cycles stalled the rally in Gold over the past 2 months. Now, it appears Gold is poised for another rally pushing much higher.

But wait, if you’re thinking I’m just another one of those traders who is always bullish on gold, just know I have been telling the truth about where gold was headed (lower) for years, but finally, the tide has changed!

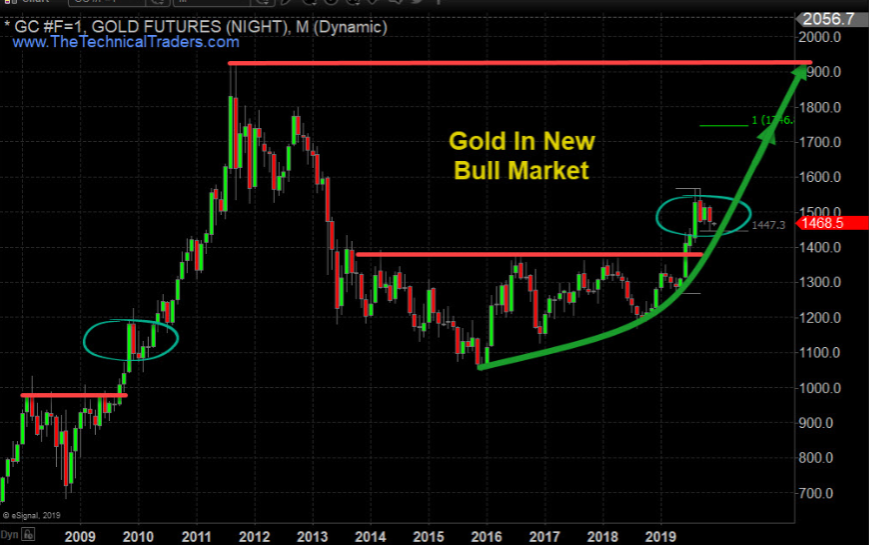
Gold broke down from a bull market in 2012/2013 – nearly 7 years ago. Now, Gold has broken resistance near $1375 and is technically in a full fledged Bull Market. The importance of this is the seven year cycle and how the rotation in Gold, between the high near $1923 and the low near $1045 represent an $878 price range. The upside (expansion) rally in Gold may very well move in expanding Fibonacci price structures – just like it did in 2005 through 2012. If this is the case, then we may expect to see an ultimate peak price in Gold well above $3500.

The rally that started in the last 2015 and ended in July 2016 totaled +$331.1 (+31.67%). The next price rally that started in August 2018 and ended in September 2019 totaled +$399.4 (+34.22%). If we take the current rally range (399.4) and divide it by the previous rally range (331.1), we end up with an expansion range of 121%. The two unique rallies that happened just before the 2009 parabolic rally in Gold represented (+315.8: 2006) and (394.8: 2008). The ratio of these two rallies is 125%. Could Gold have already set up for another parabolic rally well beyond the $1923 target level?

Before finding out what is next quickly join our free trend signals email list.

Monthly Price of Gold Chart – Bull and Bear Market Trends


Our research team believes Gold has already entered a technically valid Bullish Market trend. We believe Gold miners will follow higher as Gold begins this next move higher. The reason we have not engaged in Miners, yet, is because we have not received any technically valid signals related to the Gold miners indicating they have also entered a new Bullish Market trend.

Gold is the safe haven for the global market. It is a store of value and offers price appreciation when the global market risks are excessive. Because of this, the sentiment across the global markets appears to be weakening in regards to forward expectations and valuation appreciation within the investment/asset classes. If Gold continues to rally higher, consider it a strong indicator that the foundation of the global market valuation levels is weakening considerably.

U.S. Dollar Will Start to Support Higher Gold Prices


Should the U.S. Dollar retrace lower, Gold will see a price increase based on the renewed weakness of the U.S. Dollar. This would also assist in re-balancing global trade and economic issues with the US Dollar moving moderately lower as weakening global markets contract.

Gold Mining Stocks – Monthly Chart


Miners are set up much like Gold was in early 2018. Resistance has been set up with multiple price tops and any momentum rally above this level would technically qualify as a new Bullish Market trend for miners.

At this point, we believe the bottom in miners has already formed and we are simply waiting for the qualifying technical confirmation of the bullish trend to begin. Jumping into this trade too early could result in unwanted risks as the price could still waffle around within the Stage 1 Base range.

If you want to learn more about market stage analysis I will be covering it a new article shortly. Once you grasp the basic concept you will see these stages on every chart no matter the time frame and know when to focus on trading and when to ignore the charts.

If you like new fresh big trend trades then check out this real estate article I just posted and how the real estate ETF could allow your to profit from home prices but you don’t even need to own or buy a home!

Concluding Thoughts

The recent weakness in the US and global markets has prompted a moderately solid upside move in Gold and Silver over the past few days. We still need to see a Gold move above recent resistance to qualify as a new upside rally though. Miners are set up for a breakout technical move which we must also wait for. We believe these two may move somewhat in unison if the global markets continue to contract throughout the end of 2019 and into 2020.

Stay tuned for more updates and alerts when all these key sectors and asset classes start new trends because that is when you want to get involved for immediate oversized gains. See my stock, index, and commodity trade alerts here.

Chris Vermeulen
The Technical Traders


Stock & ETF Trading Signals

Friday, November 29, 2019

100% Measured Moves May Signal a Top

One type of Fibonacci price structure we use to attempt to measure price trends and identify potential tops/bottoms is the “100% Measured Move” structure. This is a price structure where a previous price move is almost perfectly replicated in a subsequent price trend after a brief period of retracement or price correction. These types of patterns happen all the time in various forms across multitudes of symbols to create very solid trading signals for those that are capable of identifying trends and opportunities using this technique. If you want my daily analysis and trade ideas, be sure to get my updates by joining my free trend signals email list.

The first thing we look for is a strong price trend or the initially confirmed reversal of a price trend. We find that these trending price ranges and initial “impulse trends” tend to prompt 100% measured moves fairly accurately. The explosive middle trend is where one can’t assume any type of Fibonacci 100% measured move will happen. Those explosive moves in a trend that tend to happen in the middle of a price trend are what we call the “expansion wave” of a trend and will typically be 160% or more the size of the initial impulse trend.

These trade setups we call the “100% measured moves” are naturally occurring price rotations that skilled traders can use to identify strong trade potential setups. They are more common in rotating markets where a moderate trend bias is in place (for example in the current YM or ES chart).

First, let’s take a look at this YM Weekly Chart to highlight the most recent 100% Measured Move. The original upside price move between June 2019 and July 2019 resulted in a 2787 point price rally that replicated between August 2019 and November 2019 – after a brief price retracement. Currently, price is rotating near the peak of this 100% measured price move near 27,875 while attempting to set up a new price trend.


In this ES Weekly example chart, we see a 100% Measured Move that originated in June 2019 and ended in July 2019 – just like on the YM chart. Although the completion of the 100% measured move didn’t originate until the low that formed before price rallied to take out the previous high near 3029.50. Remember, the other facets of Fibonacci price theory are also still at play in the markets while these 100% Measured Moves are taking place. Thus, rotation between a previous price peak and valley (without establishing any new price highs or new price low) are considered “price rotation” – not trending. The 100% Measured Move that did take place recently did complete a full 100% advancement and is now stalling near the 3040 level peak.


If you are not familiar with some of my forecasting and trading strategies for trading the S&P 500, or my gold trading signals be sure to click those links to see some pretty interesting charts like these.

SP500 Index Trend Identification and Trade Signal System


Cycle and Price Prediction System


Concluding Thoughts

Once these 100% measured moves complete, price usually attempts to stall or wash out a bit before attempting to establish a new price trend. At this point, given the examples we’ve illustrated, we believe the US market will enter a period of rotation and moderate volatility as these 100% measured moves have completed the upside price advance for now. Some level of price rotation after these 100% measured moves have completed will potentially allow for another attempt at a future 100% price advance after setting up a new price leg.

These techniques don’t always work, we recently got stopped out on a TVIX (vix/volatility trade for a loss) but we just close out our thirst natural gas trade for a quick 7% profit. The previous UGAZ trade netted 20%, and the one before that was 7.95%.

I can tell you that huge moves are about to start unfolding not only in metals, but stocks, and currencies. Some of these supercycles are going to last years. Brad Matheny goes into great detail with his simple to understand charts and guide about this. His financial market research is one of a kind and a real eye-opener. PDF guide: 2020 Cycles – The Greatest Opportunity Of Your Lifetime

As a technical analysis and trader since 1997, I have been through a few bull/bear market cycles. I believe I have a good pulse on the market and timing key turning points for both short term swing trading and long term investment capital. The opportunities are massive/life changing if handled properly.

I urge you to visit my Wealth Building Newsletter and if you like what I offer, join me with the 1 or 2 year subscription to lock in the lowest rate possible with our BLACK FRIDAY offer, PLUS get a FREE BAR OF GOLD and ride my coattails as I navigate these financial markets and build wealth while others lose nearly everything they own during the next set of crisis’.

Chris Vermeulen
The Technical Traders


Stock & ETF Trading Signals

Monday, October 21, 2019

Revisiting Black Monday 1987

Back in the day, for those of you that are old enough to remember and have experienced one of the most incredible trader psychology driven stock market decline in recent history. The difference between “Black Monday” and most of the other recent stock market declines is that October 19, 1987, was driven by a true psychological panic, what we consider true price exploration, after an incredible price rally.

It is different than the DOT COM (2001) decline and vastly different than the Credit Market Crisis (2008-09) because both of those events were related to true fundamental and technical evaluations. In both of those instances, prices have been rising for quite some time, but the underlying fundamentals of the economics of the markets collapsed and the markets collapsed with future expectations. Before we get too deep, be sure to opt-in to our free market trend signals newsletter.

Our researchers believe the setup prior to the Black Monday collapse is strangely similar to the current setup across the global markets. In 1982, Ronald Reagan was elected into his second term as the US President. Since his election in 1980, the US stock market has risen over 300% by August 1987.

Reagan, much like President Trump, was elected after a long period of U.S. economic malaise and ushered in an economic boom cycle that really began to accelerate near August 1983 – near the end of his first term. The expansion from the lows of 1982, near 102.20, to the highs of 1987, near 337.90, in the S&P 500 prompted an incredible rally in the US markets for all global investors.


This is very similar to what has happened since 2015/16 in the markets and particularly after the November 2016 elections when the S&P500 bottomed near 1807.5 and has recently set hew highs near 3026.20 – a 67.4% price rally in just over 3 years.

One can simply make the assumption that global investors poured capital in the US markets in 1983 to 1986 as the US markets entered a rally mode just like we suspect global investors have poured capital into the US markets after the 2016 US elections and have continued to seek value, safety, and returns in the US markets since. These incredible price rallies setup a very real potential for “true price exploration” when investors suddenly realize valuations may be out of control.

So, what actually happened on October 19th, 1987 that was different than the last few market collapse events and why is it so similar to what is happening today?

On October 19, 1987, a different set of circumstances took place. This was almost a perfect storm of sorts for the markets. The US markets had risen nearly 44% by August 1987 from the previous yearly close – a huge rally had taken place. Computer trading, which some people suspected may have been a reason for the price decline on October 19, was largely in its infancy.

Floor traders were running the show in New York and Chicago. The London markets closed early the Friday, October 16, because of a weather event that was taking place. The “setup” of these events may have played a roll in the liquidity issues that became evident on Black Monday and pushed the US markets down 22.61% by the end of trading.

The US markets had set up a top near 2,722 in early August 1987 after rising nearly 44% from the 1986 end of year closing price level of 1,895. The SPX rotated lower from this peak to set up a sideways price channel near 315 throughout the end of August and through most of September. On October 5, 1987, the SPX started a downward price move that attempted to test the lower support channel near 312. On October 12, one week later, the SPX broke below this support channel and closed at 298.10 (below the psychological 300 level). The very next weekend was October 17 & 18 – the weekend before Black Monday.


Sunday night, October 18, in the US, the Asian markets opened for trading and a price sell-off began taking place in Hong Kong. Because the London markets has closed early on the 16th due to the storm, by the time they opened the UK markets began tanking almost immediately. Early in the day on Monday, October 19, the FTSE100 had collapsed over 136 points.

Our researchers believe the declines in the US markets in early October 1987 set up a breakdown event that, once support was broken, prompted a collapse event where liquidity issues accelerated the price decline volatility – much like the “flash crash”. Global investors were unprepared for the scale and scope of the price decline event and panicked at the speed of the price collapse.

In fact, at the height of the 1987 crash, systemic problems (mostly solvency and brokerage house operations) continued to threaten a much larger financial market collapse. Within days of Black Monday, it became evident that margin accounts and solvency issues related to operating capital, large scale risks and continued fear that the markets may continue to collapse presented a very real problem for the US and for the world. Have we re-entered another Black Monday type of setup across the global markets?


As new economic data continues to suggest the global markets are economically contracting and stagnating, the US Federal Reserve has started buying assets again while the foreign central banks continue to push negative interest rates while attempting to spark any signs of real economic growth. The US stock market has continued to push higher – almost attempting new all-time highs again just recently. The US stock market is up nearly 68% over the past 3.5 years since Trump was elected and as of Friday, October 18, 2019, the US stock markets fell nearly 0.75% on economic fears.

In Part II of this article, we’ll explore the potential of another Black Monday type of setup that may be playing out before our very eyes right now in the US stock market.

As a technical analysis and trader since 1997, I have been through a few bull/bear market cycles. I believe I have a good pulse on the market and timing key turning points for both short term swing trading and long-term investment capital. The opportunities are massive/life changing if handled properly.

I urge you visit my ETF Wealth Building Newsletter and if you like what I offer, join me with the 1-year subscription to lock in the lowest rate possible and ride my coattails as I navigate these financial market and build wealth while others lose nearly everything they own during the next financial crisis.


Chris Vermeulen
The Technical Traders



Stock & ETF Trading Signals