Falling Bonds and rising yields are creating a condition in the global markets where capital is shifting away from Technology, Communication Services and Discretionary stocks have suddenly fallen out of favor, and Financials, Energy, Real Estate, and Metals/Miners are gaining strength. The rise in yields presents an opportunity for Banks and Lenders to profit from increased yield rates. In addition, historically low interest rates have pushed the Real Estate sector, including commodities towards new highs.
We also note Miners and Metals have shown strong support recently as the US Dollar and Bonds continue to collapse. The way the markets are shifting right now is suggesting that we may be close to a technology peak, similar to the DOT COM peak, where capital rushes away from recently high flying technology firms into other sectors (such as Banks, Financials, Real Estate, and Energy).
The deep dive in Bonds and the US Dollar aligns with the research we conducted near the end of 2020, which suggested a market peak may set up in late February. We also suggested the markets may continue to trade in a sideways (rounded top) type of structure until late March or early April 2021. Our tools and research help us to make these predictions nearly 4 to 5+ months before the markets attempt to make these moves....You Can Read This Research Here.
Showing posts with label precious metals. Show all posts
Thursday, February 25, 2021
Thursday, February 18, 2021
Gold Setting Up Major Bottom So Could We See A Breakout Rally Begin Soon?
There has been quite a bit of chatter related to precious metals lately. The rally in Cryptos, particularly Bitcoin, and various other stocks have raised expectations that Gold and Silver have been overlooked as a true hedging instrument. As these rallies continue in various other stocks and sectors, Gold and Silver have continued to trade sideways over the past 6+ months – when and how will it end?
Gold Support Near $1765 May Become a New Launchpad
My research team and I believe the recent downside trend in Gold has reached a support level, near $1765, that will act as a launching pad for a potentially big upside price trend. This support level aligns with previous price highs (May 2020 through June 2020) after the Covid-19 price collapse, which we believe is an indication of a strong support level. As you can see from the Gold Futures Weekly chart below, if Gold price levels hold above $1765 then we feel the next upside rally in metals could prompt a move targeting $2160, then $2400....Read More Here.
Gold Support Near $1765 May Become a New Launchpad
My research team and I believe the recent downside trend in Gold has reached a support level, near $1765, that will act as a launching pad for a potentially big upside price trend. This support level aligns with previous price highs (May 2020 through June 2020) after the Covid-19 price collapse, which we believe is an indication of a strong support level. As you can see from the Gold Futures Weekly chart below, if Gold price levels hold above $1765 then we feel the next upside rally in metals could prompt a move targeting $2160, then $2400....Read More Here.
Labels:
commodities,
Covid-19,
cryptos,
futures,
Gold,
investing,
precious metals,
Silver,
stocks
Friday, February 12, 2021
Platinum Begins Big Breakout Rally....What Does That Mean for Investors & Traders?
If you were not paying attention, Platinum began to rally much higher over the past 3+ days – initiating a new breakout rally and pushing well above the $1250 level. What you may not have noticed with this breakout move is that commodities are hot – and inflation is starting to heat up. What does that mean for investors/traders?
Daily Platinum Chart Shows Clear Breakout Trend
First, Platinum is used in various forms for industrial and manufacturing, as well as jewelry and numismatic functions (minting/collecting). This move in Platinum is more likely related to the increasing inflationary pressures we’ve seen in the Commodity sector coupled with the increasing demand from the surging global economy (nearing a post-COVID-19 recovery). The most important aspect of this move is the upward pricing pressure that will translate into Gold, Silver, and Palladium.
We’ve long suggested that Platinum would likely lead a rally in precious metals and that a breakout move in platinum could prompt a broader uptrend in other precious metals. Now, the combination of this type of rally in Platinum combined with the Commodity rally and the inflationary pressures suggests the global markets could be in for a wild ride over the next 12 to 24+ months....Read More Here.
Labels:
Chris Vermeulen,
Gold,
investing,
money,
platinum,
precious metals,
Silver,
stocks,
The Technical Traders
Saturday, January 16, 2021
Our Custom Valuations Index Suggests Precious Metals Will Decline Before Their Next Attempt to Rally
My team prepares Custom Valuations Index charts to understand how capital is being deployed in the global markets alongside U.S. Dollar and Treasury Yields. The purpose of the Custom Index charts in this article is to provide better insight into and understanding of underlying capital movements in various market conditions.
Recently, we discovered the Custom Index chart shares a keen alignment with Gold (and likely the general precious metals sector). Let’s explore our recent analysis to help readers understand what to expect next in precious metals.
Weekly Custom Valuations Index Chart
The first thing that caught my attention was the very clear decline in the weekly Custom Valuations Index recently, as can be seen in the chart below. The second peak on the Custom Valuations Index chart occurred on the week of August 3, 2020. Gold also peaked at this very same time. This alignment started an exploratory analysis of the Custom Valuations Index and the potential alignment with the precious metals sector....Read More Here.
Weekly Custom Valuations Index Chart
The first thing that caught my attention was the very clear decline in the weekly Custom Valuations Index recently, as can be seen in the chart below. The second peak on the Custom Valuations Index chart occurred on the week of August 3, 2020. Gold also peaked at this very same time. This alignment started an exploratory analysis of the Custom Valuations Index and the potential alignment with the precious metals sector....Read More Here.
Labels:
Chris Vermeulen,
Gold,
investing,
money,
precious metals,
Silver,
stocks,
The Technical Traders
Thursday, January 14, 2021
Review of our recent BAN trade in SILJ
After recently closing our SILJ BAN trade, I want to take this opportunity to dissect our trade, including the process of selecting the proper exit targets and protecting capital within a trade. The BAN Trader Pro strategy incorporates these same techniques automatically within the decision making process of generating signals and taking trades.
With our recent SILJ trade, we initiated the entry on the upside breakout in price on November 5, 2020 – near $15.50. This upside breakout move prompted a new BAN trade trigger with SILJ near the top of the BAN Hotlist, suggesting further upside trending would continue.
Of course, nothing ever happens 100% as expected... like the announcement of Pfizer's vaccine being 90% effective coming out only days after making the trade! The immediate downturn in price activity resulted in our SILJ trade staying below our entry price for more than 30 days. Read on to see how we still made money on the trade....Read More Here.
Labels:
Chris Vermeulen,
Gold,
investing,
precious metals,
SILJ,
Silver,
stocks,
The Technical Traders
Tuesday, November 3, 2020
Gold and Silver Supercycles Explored
Heading into what will likely become one of the biggest events in American political history on November 3, the US stock markets are holding up quite well on Monday, November 2. My team and I have published a number of articles recently suggesting we believe wild price swings and increased volatility is to be expected before and after the US elections.
We have even suggested a couple of stock trades that we believe should do fairly well 60+ days after the elections are complete. Right now, we want to bring your attention to the Silver Junior Miners ETF (SILJ).
The current Pennant/Flag formation that is setting up in SILJ on the following Monthly chart has peaked our attention. Diminishing volume and moderately strong support above the $12 price level suggest key resistance near $15.05 will likely be retested as metals and miners continue to attract safe-haven capital after the elections. The Apex of the Pennant/Flag formation appears to be nearly complete – a breakout or breakdown move is pending. We believe the uncertainty of the elections will prompt a possible breakout (upside) price trend in the near future....Continue Reading Here.
Labels:
Chris Vermeulen,
commodities,
miners,
precious metals,
Silver,
stocks
Friday, January 3, 2020
ADL Gold Prediction Confirms Our Targets
The Gold rally we predicted to happen in late 2018 took place, almost perfectly, based on our ADL predictive modeling systems results. This rally took place in May through September 2019 and pushed Gold up to levels near $1600. The rest of the year, Gold consolidated near $1500 as a strong US Stock Market rally took hold in Q4 of 2019.
Our original prediction was that Gold would rally to levels near $1750 before the end of 2019 based on our Adaptive Dynamic Learning predictive modeling system (ADL). This did not happen in 2019 as out ADL modeling systems suggested, but it appears Gold is setting up for another massive upside rally in 2020.
Taking a look at our ADL predictive modeling systems on Monthly charts for Gold and Silver, we see two very interesting suggestions setting up :
If we consider what happened in 2008/09 with the global credit market crisis, both Gold and Silver contracted lower near the start of this crisis (in late 2008). Eventually, Gold began to move higher in August/September 2009 (well into the crisis event). Silver didn’t really start to accelerate higher will August 2010 – a full 12 months after the Gold rally started.
Our ADL system is suggesting that the Silver rally will lag behind the gold rally by about 10 to 14 months given the ADL predictions for price activity in 2020. Thus, Gold may continue to rally much higher fairly early in 2020, yet we won’t see much upside movement in Silver till after July 2020.
This first Monthly Gold ADL chart highlights the ADL predictive modeling systems suggestion related to future price targets. We can see the upside move in Gold should begin with an upside target near $1600-1625 over the next 60+ days. After that, the rally should accelerate higher in April/May 2020 with another move higher towards $1700-1725. By August/September 2020, Gold should attempt a rally to levels above $1800-1850 and then begin to consolidate above $1800 for a few months.
This Silver Monthly ADL chart suggests that Metals will react very similar in 2020 to what happened in 2008-09. While Gold began to rally in August 2009, Silver did not begin to accelerate higher till August/September 2010. This delay in the understanding that Silver presents valid protection against risk may take place in this current upside rally in Gold. If the ADL predictions are accurate, then Silver will continue to provide buying opportunities for many months near $17.50-$18.00 before a major upside price advance begin.
By July 2020, Our ADL predictive modeling system is suggesting Silver will advance to levels above $18.25, then begin a major price advance to levels above $19-20 fairly quickly. Please keep in mind the scope of these predictions related to the global markets and the U.S. Presidential elections. We read into this that a lot of chaos/turmoil may be taking place in the US/World after June/July 2020.
This last chart is a Weekly Gold chart highlighting our Fibonacci Price Amplitude Arcs and the major resistance level that has just been broken in Gold. The heavy GREEN arc and the BLACKLINE that we’ve drawn on this chart represent massive resistance originating from the lows near August 2018 in Gold. We believe this resistance level, once broken, will prompt a major upside price move in Gold to levels closer to or above $1700. If this price advance in Gold aligns well with our ADL predictions, then we believe fear will continue to drive future a future price advance in Gold and that fear may be related to continued Global stock market concerns and the U.S. elections.
2020 may be a very good year for precious metals traders who are able to identify solid entry trades for these moves. If our ADL predictions are accurate, Gold should rally over 25% before the end of 2020. Silver may rally as much as 15% before the end of 2020. The timing of these moves suggests Gold traders will have opportunities for bigger price advanced early in 2020 and will begin a larger upside price move after February/March 2020. Silver will begin an upside price move after basing near the March/April 2020.
2020 is going to be a fantastic year for skilled technical traders. Join us and our valued members in finding great trades and incredible opportunities in the markets by joining The Technical Traders.
Chris Vermeulen
The Technical Traders Ltd.
Our original prediction was that Gold would rally to levels near $1750 before the end of 2019 based on our Adaptive Dynamic Learning predictive modeling system (ADL). This did not happen in 2019 as out ADL modeling systems suggested, but it appears Gold is setting up for another massive upside rally in 2020.
Taking a look at our ADL predictive modeling systems on Monthly charts for Gold and Silver, we see two very interesting suggestions setting up :
- First, Gold may attempt a rally to a level above $1700 before March/April 2020 and potentially extend this rally to well above $1850 by August/September 2020.
- Second, Silver appears to lag behind this Gold rally by about 7 to 8 months. Silver does not appear to want to start a rally until well after July or August 2020.
If we consider what happened in 2008/09 with the global credit market crisis, both Gold and Silver contracted lower near the start of this crisis (in late 2008). Eventually, Gold began to move higher in August/September 2009 (well into the crisis event). Silver didn’t really start to accelerate higher will August 2010 – a full 12 months after the Gold rally started.
Our ADL system is suggesting that the Silver rally will lag behind the gold rally by about 10 to 14 months given the ADL predictions for price activity in 2020. Thus, Gold may continue to rally much higher fairly early in 2020, yet we won’t see much upside movement in Silver till after July 2020.
Monthly Gold ADL Chart
This first Monthly Gold ADL chart highlights the ADL predictive modeling systems suggestion related to future price targets. We can see the upside move in Gold should begin with an upside target near $1600-1625 over the next 60+ days. After that, the rally should accelerate higher in April/May 2020 with another move higher towards $1700-1725. By August/September 2020, Gold should attempt a rally to levels above $1800-1850 and then begin to consolidate above $1800 for a few months.
Silver Monthly ADL Chart
This Silver Monthly ADL chart suggests that Metals will react very similar in 2020 to what happened in 2008-09. While Gold began to rally in August 2009, Silver did not begin to accelerate higher till August/September 2010. This delay in the understanding that Silver presents valid protection against risk may take place in this current upside rally in Gold. If the ADL predictions are accurate, then Silver will continue to provide buying opportunities for many months near $17.50-$18.00 before a major upside price advance begin.
By July 2020, Our ADL predictive modeling system is suggesting Silver will advance to levels above $18.25, then begin a major price advance to levels above $19-20 fairly quickly. Please keep in mind the scope of these predictions related to the global markets and the U.S. Presidential elections. We read into this that a lot of chaos/turmoil may be taking place in the US/World after June/July 2020.
Weekly Gold Chart
This last chart is a Weekly Gold chart highlighting our Fibonacci Price Amplitude Arcs and the major resistance level that has just been broken in Gold. The heavy GREEN arc and the BLACKLINE that we’ve drawn on this chart represent massive resistance originating from the lows near August 2018 in Gold. We believe this resistance level, once broken, will prompt a major upside price move in Gold to levels closer to or above $1700. If this price advance in Gold aligns well with our ADL predictions, then we believe fear will continue to drive future a future price advance in Gold and that fear may be related to continued Global stock market concerns and the U.S. elections.
2020 may be a very good year for precious metals traders who are able to identify solid entry trades for these moves. If our ADL predictions are accurate, Gold should rally over 25% before the end of 2020. Silver may rally as much as 15% before the end of 2020. The timing of these moves suggests Gold traders will have opportunities for bigger price advanced early in 2020 and will begin a larger upside price move after February/March 2020. Silver will begin an upside price move after basing near the March/April 2020.
2020 is going to be a fantastic year for skilled technical traders. Join us and our valued members in finding great trades and incredible opportunities in the markets by joining The Technical Traders.
Chris Vermeulen
The Technical Traders Ltd.
Labels:
charts,
Chris Vermeulen,
crisis,
Crude Oil,
Gold,
precious metals,
rally,
Silver,
The Technical Traders,
Volatility
Saturday, December 14, 2019
Seven Year Cycles Can Be Powerful and Gold Just Started One
Our research and predictive modeling systems have nailed Gold over the past 15+ months. We expected Gold to rally above $1750 before the end of this year, but the global trade wars and news cycles stalled the rally in Gold over the past 2 months. Now, it appears Gold is poised for another rally pushing much higher.
But wait, if you’re thinking I’m just another one of those traders who is always bullish on gold, just know I have been telling the truth about where gold was headed (lower) for years, but finally, the tide has changed!
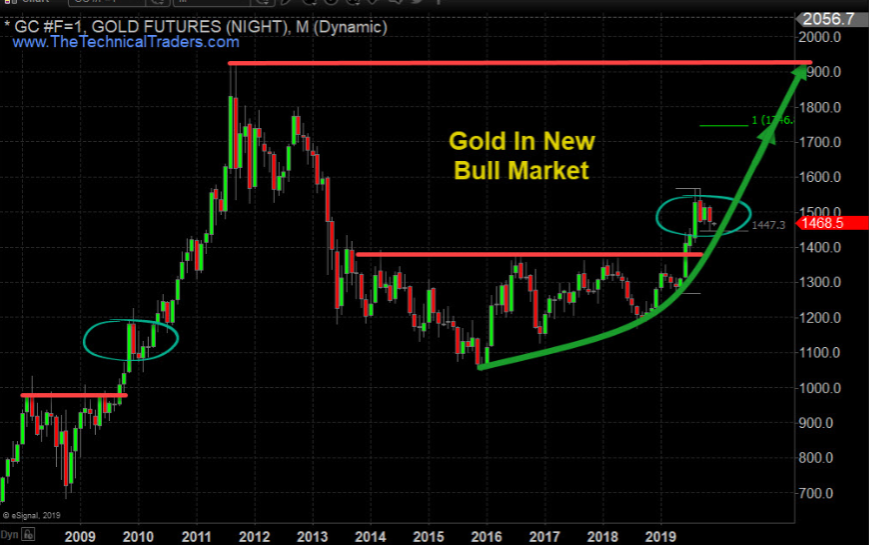
Gold broke down from a bull market in 2012/2013 – nearly 7 years ago. Now, Gold has broken resistance near $1375 and is technically in a full fledged Bull Market. The importance of this is the seven year cycle and how the rotation in Gold, between the high near $1923 and the low near $1045 represent an $878 price range. The upside (expansion) rally in Gold may very well move in expanding Fibonacci price structures – just like it did in 2005 through 2012. If this is the case, then we may expect to see an ultimate peak price in Gold well above $3500.
The rally that started in the last 2015 and ended in July 2016 totaled +$331.1 (+31.67%). The next price rally that started in August 2018 and ended in September 2019 totaled +$399.4 (+34.22%). If we take the current rally range (399.4) and divide it by the previous rally range (331.1), we end up with an expansion range of 121%. The two unique rallies that happened just before the 2009 parabolic rally in Gold represented (+315.8: 2006) and (394.8: 2008). The ratio of these two rallies is 125%. Could Gold have already set up for another parabolic rally well beyond the $1923 target level?
Before finding out what is next quickly join our free trend signals email list.
Our research team believes Gold has already entered a technically valid Bullish Market trend. We believe Gold miners will follow higher as Gold begins this next move higher. The reason we have not engaged in Miners, yet, is because we have not received any technically valid signals related to the Gold miners indicating they have also entered a new Bullish Market trend.
Gold is the safe haven for the global market. It is a store of value and offers price appreciation when the global market risks are excessive. Because of this, the sentiment across the global markets appears to be weakening in regards to forward expectations and valuation appreciation within the investment/asset classes. If Gold continues to rally higher, consider it a strong indicator that the foundation of the global market valuation levels is weakening considerably.
Should the U.S. Dollar retrace lower, Gold will see a price increase based on the renewed weakness of the U.S. Dollar. This would also assist in re-balancing global trade and economic issues with the US Dollar moving moderately lower as weakening global markets contract.
Miners are set up much like Gold was in early 2018. Resistance has been set up with multiple price tops and any momentum rally above this level would technically qualify as a new Bullish Market trend for miners.
At this point, we believe the bottom in miners has already formed and we are simply waiting for the qualifying technical confirmation of the bullish trend to begin. Jumping into this trade too early could result in unwanted risks as the price could still waffle around within the Stage 1 Base range.
If you want to learn more about market stage analysis I will be covering it a new article shortly. Once you grasp the basic concept you will see these stages on every chart no matter the time frame and know when to focus on trading and when to ignore the charts.
If you like new fresh big trend trades then check out this real estate article I just posted and how the real estate ETF could allow your to profit from home prices but you don’t even need to own or buy a home!
The recent weakness in the US and global markets has prompted a moderately solid upside move in Gold and Silver over the past few days. We still need to see a Gold move above recent resistance to qualify as a new upside rally though. Miners are set up for a breakout technical move which we must also wait for. We believe these two may move somewhat in unison if the global markets continue to contract throughout the end of 2019 and into 2020.
Stay tuned for more updates and alerts when all these key sectors and asset classes start new trends because that is when you want to get involved for immediate oversized gains. See my stock, index, and commodity trade alerts here.
Chris Vermeulen
The Technical Traders
But wait, if you’re thinking I’m just another one of those traders who is always bullish on gold, just know I have been telling the truth about where gold was headed (lower) for years, but finally, the tide has changed!
Gold broke down from a bull market in 2012/2013 – nearly 7 years ago. Now, Gold has broken resistance near $1375 and is technically in a full fledged Bull Market. The importance of this is the seven year cycle and how the rotation in Gold, between the high near $1923 and the low near $1045 represent an $878 price range. The upside (expansion) rally in Gold may very well move in expanding Fibonacci price structures – just like it did in 2005 through 2012. If this is the case, then we may expect to see an ultimate peak price in Gold well above $3500.
The rally that started in the last 2015 and ended in July 2016 totaled +$331.1 (+31.67%). The next price rally that started in August 2018 and ended in September 2019 totaled +$399.4 (+34.22%). If we take the current rally range (399.4) and divide it by the previous rally range (331.1), we end up with an expansion range of 121%. The two unique rallies that happened just before the 2009 parabolic rally in Gold represented (+315.8: 2006) and (394.8: 2008). The ratio of these two rallies is 125%. Could Gold have already set up for another parabolic rally well beyond the $1923 target level?
Before finding out what is next quickly join our free trend signals email list.
Monthly Price of Gold Chart – Bull and Bear Market Trends
Our research team believes Gold has already entered a technically valid Bullish Market trend. We believe Gold miners will follow higher as Gold begins this next move higher. The reason we have not engaged in Miners, yet, is because we have not received any technically valid signals related to the Gold miners indicating they have also entered a new Bullish Market trend.
Gold is the safe haven for the global market. It is a store of value and offers price appreciation when the global market risks are excessive. Because of this, the sentiment across the global markets appears to be weakening in regards to forward expectations and valuation appreciation within the investment/asset classes. If Gold continues to rally higher, consider it a strong indicator that the foundation of the global market valuation levels is weakening considerably.
U.S. Dollar Will Start to Support Higher Gold Prices
Should the U.S. Dollar retrace lower, Gold will see a price increase based on the renewed weakness of the U.S. Dollar. This would also assist in re-balancing global trade and economic issues with the US Dollar moving moderately lower as weakening global markets contract.
Gold Mining Stocks – Monthly Chart
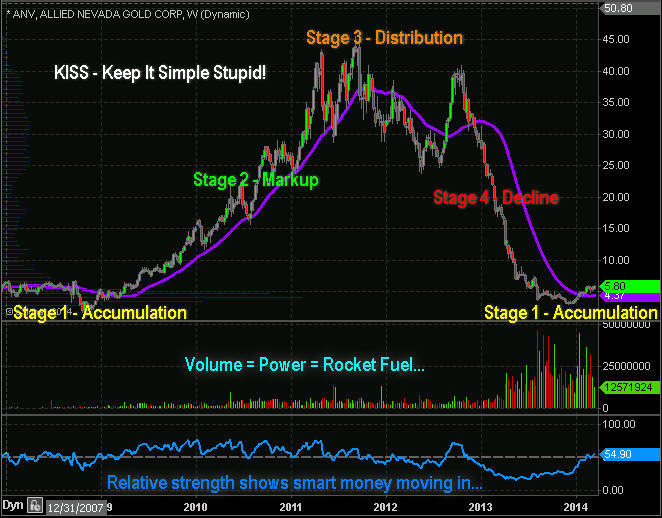
Miners are set up much like Gold was in early 2018. Resistance has been set up with multiple price tops and any momentum rally above this level would technically qualify as a new Bullish Market trend for miners.
At this point, we believe the bottom in miners has already formed and we are simply waiting for the qualifying technical confirmation of the bullish trend to begin. Jumping into this trade too early could result in unwanted risks as the price could still waffle around within the Stage 1 Base range.
If you want to learn more about market stage analysis I will be covering it a new article shortly. Once you grasp the basic concept you will see these stages on every chart no matter the time frame and know when to focus on trading and when to ignore the charts.
If you like new fresh big trend trades then check out this real estate article I just posted and how the real estate ETF could allow your to profit from home prices but you don’t even need to own or buy a home!
Concluding Thoughts
The recent weakness in the US and global markets has prompted a moderately solid upside move in Gold and Silver over the past few days. We still need to see a Gold move above recent resistance to qualify as a new upside rally though. Miners are set up for a breakout technical move which we must also wait for. We believe these two may move somewhat in unison if the global markets continue to contract throughout the end of 2019 and into 2020.
Stay tuned for more updates and alerts when all these key sectors and asset classes start new trends because that is when you want to get involved for immediate oversized gains. See my stock, index, and commodity trade alerts here.
Chris Vermeulen
The Technical Traders
Monday, August 26, 2019
Precious Metals ADL Predictions Getting Ready for a Big Move
This weekend we thought we would share some really important data and charts with all of you precious metals bugs/traders (like us). You probably remember our October 5th, 2018 call in Gold that has set off an incredible series of events for all of us.
We made a prediction that day that Gold would rotate higher from the $1200 level targeting the $1300 level, then stall and move lower to set up a “momentum base” near April 21st to 24th before accelerating much higher after June/July 2019. Our original research chart is shown below. But first, be sure to opt-in to our free market forecast newsletter
This incredible research targeted the $1600+ level by September/November 2019. We are only about $70 away from that level right now and we have new ADL research to share with all of our followers.
If you are a fan of our research or you can understand the value of the ADL predictive modeling system and what we have highlighted for our followers – you already know that any future ADL predictions for precious metals should be of particular interest to all of you. What are metals going to do over the next few months and how can you prepare for this move, let us help you try to prepare for this next move.
Check out these exciting charts full of opportunities that we will be sharing.
This Gold Monthly chat highlighting the ADL predictive modeling system results shows why gold traders need to be patient and wait for the next setup. That setup exists over the next 30 days as the ADL predictive modeling system is suggesting that Gold will attempt a downside price rotation to levels near $1490 before attempting another rally back above $1600. This is the next proper price rotation setup that traders need to look for. The second setup occurs in Jan/Feb 2020 where the price is expected to rotate from above $1600 to levels near $1540 before launching into another big rally to levels above $1870.
The Adaptive Dynamic Learning (ADL) predictive modeling system is one of the most incredible price modeling tools we use in our research. We’ve just shown you what our research tools believe Gold will do over the next 14+ months. We believe we are helping more traders and investors by proving our incredible research tools work better than any other technology solutions available in the market right now and are proving it by posting these types of charts many months before price can attempt to prove or disprove our research.
Now, one of the biggest moves is going to be in Silver and we’ve all been waiting for the incredible reversion of the Gold/Silver ratio. It is at that point when Silver begins to rally faster than Gold is rallying that we will see a true reversion in the Gold/Silver ratio. That event will result in an incredible rally in silver that could push the price of silver above $35 to $40 per ounce – or higher.
Our ADL predictive modeling system running on a Quarterly Silver chart highlights the opportunity that still exists for metals traders. Silver will continue to rally as Gold rolls higher. Silver will continue to rally to levels just below $20 over the next 8+months. The big breakout to the upside starts to take place Q3 2020. That move will push Silver prices to levels above $20 where a brief rotation will take place. By Q1 2021, the price of silver will be rallying extensively and the cat will be out of the bag in terms of what or why the metals are skyrocketing.
These moves in precious metals are going to be one of the most incredible opportunities for investors. There will be other swings in market sectors and major global market indexes as well. This is the time for all traders/investors to take advantage of the resources that are available to learn to take advantage of these setups. Our research team continues to deliver some of the most incredible research and predictive modeling results anyone has ever seen. If you can not see the value of being able to see 14 to 24 months into the future.
We urge you to consider finding resources and a team of researchers that can assist you over the next 12+ months as the moves in the global markets are going to be incredibly large and varied. Now is the time to take advantage of these opportunities and to find the right partners to assist you in finding the right trades.
In early June I posted a detailed video explaining in showing the bottoming formation and gold and where to spot the breakout level, I also talked about crude oil reaching it upside target after a double bottom, and I called short term top in the SP 500 index. This was one of my premarket videos for members it gives you a good taste of what you can expect each and every morning before the Opening Bell. Watch Video Here.
I then posted a detailed report talking about where the next bull and bear markets are and how to identify them. This report focused mainly on the SP 500 index and the gold miners index. My charts compared the 2008 market top and bear market along with the 2019 market prices today. See Comparison Charts Here.
On June 26th I posted that silver was likely to pause for a week or two before it took another run up on June 26. This played out perfectly as well and silver is now head up to our first key price target of $17. See Silver Price Cycle and Analysis.
More recently on July 16th, I warned that the next financial crisis (bear market) was scary close, possibly just a couple weeks away. The charts I posted will make you really start to worry. See Scary Bear Market Setup Charts.
In short, you should be starting to get a feel of where commodities and asset class is headed for the next 8+ months. The next step is knowing when and what to buy and sell as these turning points take place, and this is the hard part. If you want someone to guide you through the next 12 - 24 months complete with detailed market analysis and trade alerts (entry, targets and exit price levels) join my ETF Trading Newsletter.
Be prepared for these incredible price swings before they happen and learn how you can identify and trade these fantastic trading opportunities in 2019, 2020, and beyond with our Wealth Building & Global Financial Reset Newsletter. You won’t want to miss this big move, folks. As you can see from our research, everything has been setting up for this move for many months.
Join me with a 1 or 2 year subscription to lock in the lowest rate possible and ride my coattails as I navigate these financial market and build wealth while others lose nearly everything they own during the next financial crisis.
As a technical analysis and trader since 1997, I have been through a few bull/bear market cycles. I believe I have a good pulse on the market and timing key turning points for both short term swing trading and long term investment capital. The opportunities starting to present themselves will be life changing if handled properly.
Free Gold or Silver with Membership!
Kill two birds with one stone and subscribe for two years to get your FREE PRECIOUS METAL and get enough trades to profit through the next metals bull market and financial crisis!
Chris Vermeulen
The Technical Traders
We made a prediction that day that Gold would rotate higher from the $1200 level targeting the $1300 level, then stall and move lower to set up a “momentum base” near April 21st to 24th before accelerating much higher after June/July 2019. Our original research chart is shown below. But first, be sure to opt-in to our free market forecast newsletter
This incredible research targeted the $1600+ level by September/November 2019. We are only about $70 away from that level right now and we have new ADL research to share with all of our followers.
If you are a fan of our research or you can understand the value of the ADL predictive modeling system and what we have highlighted for our followers – you already know that any future ADL predictions for precious metals should be of particular interest to all of you. What are metals going to do over the next few months and how can you prepare for this move, let us help you try to prepare for this next move.
Check out these exciting charts full of opportunities that we will be sharing.
This Gold Monthly chat highlighting the ADL predictive modeling system results shows why gold traders need to be patient and wait for the next setup. That setup exists over the next 30 days as the ADL predictive modeling system is suggesting that Gold will attempt a downside price rotation to levels near $1490 before attempting another rally back above $1600. This is the next proper price rotation setup that traders need to look for. The second setup occurs in Jan/Feb 2020 where the price is expected to rotate from above $1600 to levels near $1540 before launching into another big rally to levels above $1870.
The Adaptive Dynamic Learning (ADL) predictive modeling system is one of the most incredible price modeling tools we use in our research. We’ve just shown you what our research tools believe Gold will do over the next 14+ months. We believe we are helping more traders and investors by proving our incredible research tools work better than any other technology solutions available in the market right now and are proving it by posting these types of charts many months before price can attempt to prove or disprove our research.
Now, one of the biggest moves is going to be in Silver and we’ve all been waiting for the incredible reversion of the Gold/Silver ratio. It is at that point when Silver begins to rally faster than Gold is rallying that we will see a true reversion in the Gold/Silver ratio. That event will result in an incredible rally in silver that could push the price of silver above $35 to $40 per ounce – or higher.
Our ADL predictive modeling system running on a Quarterly Silver chart highlights the opportunity that still exists for metals traders. Silver will continue to rally as Gold rolls higher. Silver will continue to rally to levels just below $20 over the next 8+months. The big breakout to the upside starts to take place Q3 2020. That move will push Silver prices to levels above $20 where a brief rotation will take place. By Q1 2021, the price of silver will be rallying extensively and the cat will be out of the bag in terms of what or why the metals are skyrocketing.
These moves in precious metals are going to be one of the most incredible opportunities for investors. There will be other swings in market sectors and major global market indexes as well. This is the time for all traders/investors to take advantage of the resources that are available to learn to take advantage of these setups. Our research team continues to deliver some of the most incredible research and predictive modeling results anyone has ever seen. If you can not see the value of being able to see 14 to 24 months into the future.
We urge you to consider finding resources and a team of researchers that can assist you over the next 12+ months as the moves in the global markets are going to be incredibly large and varied. Now is the time to take advantage of these opportunities and to find the right partners to assist you in finding the right trades.
Crucial Warning Signs About Gold, Silver, Miners and SP500
In early June I posted a detailed video explaining in showing the bottoming formation and gold and where to spot the breakout level, I also talked about crude oil reaching it upside target after a double bottom, and I called short term top in the SP 500 index. This was one of my premarket videos for members it gives you a good taste of what you can expect each and every morning before the Opening Bell. Watch Video Here.
I then posted a detailed report talking about where the next bull and bear markets are and how to identify them. This report focused mainly on the SP 500 index and the gold miners index. My charts compared the 2008 market top and bear market along with the 2019 market prices today. See Comparison Charts Here.
On June 26th I posted that silver was likely to pause for a week or two before it took another run up on June 26. This played out perfectly as well and silver is now head up to our first key price target of $17. See Silver Price Cycle and Analysis.
More recently on July 16th, I warned that the next financial crisis (bear market) was scary close, possibly just a couple weeks away. The charts I posted will make you really start to worry. See Scary Bear Market Setup Charts.
Concluding Thoughts
In short, you should be starting to get a feel of where commodities and asset class is headed for the next 8+ months. The next step is knowing when and what to buy and sell as these turning points take place, and this is the hard part. If you want someone to guide you through the next 12 - 24 months complete with detailed market analysis and trade alerts (entry, targets and exit price levels) join my ETF Trading Newsletter.
Be prepared for these incredible price swings before they happen and learn how you can identify and trade these fantastic trading opportunities in 2019, 2020, and beyond with our Wealth Building & Global Financial Reset Newsletter. You won’t want to miss this big move, folks. As you can see from our research, everything has been setting up for this move for many months.
Join me with a 1 or 2 year subscription to lock in the lowest rate possible and ride my coattails as I navigate these financial market and build wealth while others lose nearly everything they own during the next financial crisis.
As a technical analysis and trader since 1997, I have been through a few bull/bear market cycles. I believe I have a good pulse on the market and timing key turning points for both short term swing trading and long term investment capital. The opportunities starting to present themselves will be life changing if handled properly.
Free Gold or Silver with Membership!
Kill two birds with one stone and subscribe for two years to get your FREE PRECIOUS METAL and get enough trades to profit through the next metals bull market and financial crisis!
Chris Vermeulen
The Technical Traders
Labels:
ADL,
Chris Vermeulen,
ES,
Gold,
newsletter,
precious metals,
Silver,
SP500,
stocks,
The Technical Traders
Tuesday, March 26, 2019
20 Days Left to Find Buying Opportunities in Gold
Our researchers have been glued to Gold, Silver and the Precious Metals sector for many months. We believe the current setup in Gold is a once in a lifetime opportunity for skilled traders to stake positions below $1300 before a potentially incredible upside price move. We’ve been alerting our members and follower to this opportunity since well before the October/December 2018 downside price rotation in the U.S. markets.
October 5, 2018: Prepare for a Gold and Silver Rally
December 9, 2018: Waiting for Gold to Erupt
Jan 25, 2018: Why Everyone is Talking About Gold and Silver
Additionally, our researchers called the bottom in the U.S. equities markets and warned of an incredible upside price rotation setting up just before the actual price bottom occurred on December 24, 2018.
December 26, 2018: Has The Equities Sell Off Reached a Bottom Yet
Our research continues to suggest that Gold and Silver will rotate within a fairly narrow range over the next 3-5 weeks before setting up a likely price bottom near April 21st, 2019. We’ve been predicting this bottom formation for many months and have been warning our followers to prepare for this move and grab opportunities below $1300 when they set up.
This first chart, a Monthly chart showing our TT Charger price modeling system, clearly illustrates the strength of this bullish price trend and the initiation of this trend back in early 2016. One of the strengths of the TT Charger modeling system is that it establishes a number of key price data points and trend factors. The background color highlighted ranges show price range breadth and range expansion or contraction. The dual channel facets show where price is likely to find support and resistance. The DOT LEVELS show where critical support or resistance is in terms of the overall trend channels.
Right now, we are still in a bullish trend with key support near $1165. The Dual Channel system is showing the $1260 to $1285 level is currently the most likely active support levels just below current price. Thus, we could see a move to near these levels over the next 3+ weeks and I would suggest skilled traders jump on this opportunity. The Range system is showing a current $250~350 price range, thus, any upside price breakout could easily rally within this range and push prices at least $250+ higher than current levels – likely well above $1550. If range expansion sets up, we could see prices well above $1750.
We’ve authored hundreds of research posts over the past 12+ months and the one thing that we continue to mention is that Fibonacci price theory continues to operate on the premise that “price must always attempt to find and establish new price highs or lows – at all times”. Please keep this in mind as we continue.
Take a look at the TT Charger chart, above, and the raw Monthly price chart, below. Price must always attempt to find and establish new price highs or lows – so where is price going based on the most recent price rotations? Let’s review…
After rallying in early 2016 to establish a price high of $1377.50, gold immediately rotated downward to establish a higher low near $1124.50. The $1377.50 high price was a “new price high” in terms of previous rotational highs while the $1124.50 low was a higher low price rotation point. Thus, a failed “new price low”.
Since these two price points, Gold has settled into a sideways price channel where new price highs and lows have been attempted, but have failed to breakout out of the existing previous high and low price levels. As a technician of price, we can immediately identify this as a possible “Pennant or Flag” formation. With the last “new price level” being a “new price high” we still believe that Gold will attempt to break above the recent high price levels and attempt a much bigger upside price swing.
Our analysis suggests the April 21st date as a critical date for the potential price bottom in Gold and Silver. Our belief is that this date will like result in a near term momentum bottom in price. Where price may fall, briefly, below $1290 and rotate into a “washout low” price rotation. The opportunity for this move could come 3-5 days before or after the April 21st date.
This last chart, a Monthly price chart, illustrating the Pennant/Flag formation in Gold should be the clearest example we can provide that Gold will soon break out to the upside and rally extensively higher if our research and analysis are correct. The momentum that has built up over the past 2+ years, as well as the global demand for Gold by central banks and by investors as a hedging instrument, could prompt Gold and Silver to rally at least 50~60% in this first upside breakout wave – resulting in $1900 gold prices. Silver could rally to well above $18-$19 in a similar move and the number our researchers believe may become the upside target in Silver is $21.
This big picture chart and technical pattern could still take months to unfold if the price is to test the lower end of the trading range at $1225. If our analysis is correct, Gold and Silver could begin an upside price breakout shortly after April 21st (very likely to become evident in early May 2019). The upside potential for this move is at least $1550 in Gold and at least $18 in Silver.
Please understand that any upside breakout in Gold and Silver will likely be associated with general global market weakness including the potential for some type of global crisis event. This could be related to the EU, BREXIT, China, France or any other nation burdened by debt, dealing with election turmoil or related to social or economic angst. We could almost throw a dart at a map of the globe and hit some area that is poised for some type of economic crisis.
Our last buy signal for gold and gold miners was in Sept 2018 and subscribers and our team profited from that $100 gold rally. This next opportunity here is to understand that we only have about 20-25 days to search out and isolate the best entry prices we can find in Gold and Silver before our April 21st momentum bottom date hits. This means we need to prepare for this upside breakout move in Precious Metals and prepare our other open positions for the possibility of extended downside pricing concerns. If you read our continued research posts, you’ll understand that we believe the U.S. stock market will rotate a bit lower prior to this April 21st date and rally as well.
We believe the U.S. equities markets will become a safe haven, like Gold, where foreign investors can balance the strength of the U.S. Dollar with the strong U.S. economy and continued equity price appreciation while more fragile nations deal with economic crisis events and debt concerns. Thus, we believe capital will flood the US markets after April 21st as evidence of these economic concerns drives foreign investors into U.S. equities.
Take a minute to find out why Technical Traders Ltd. is quickly becoming one of the best research and trading services you can find anywhere on the planet. We are about to launch a new technology product to assist our members and we continue to deliver incredible research posts, like this one, where we can highlight our proprietary price modeling systems and adaptive learning solutions.
If you want to stay ahead of these markets moves and find greater success in 2019 and beyond Join Our Wealth Trading Newsletter Today.
Chris Vermeulen
October 5, 2018: Prepare for a Gold and Silver Rally
December 9, 2018: Waiting for Gold to Erupt
Jan 25, 2018: Why Everyone is Talking About Gold and Silver
Additionally, our researchers called the bottom in the U.S. equities markets and warned of an incredible upside price rotation setting up just before the actual price bottom occurred on December 24, 2018.
December 26, 2018: Has The Equities Sell Off Reached a Bottom Yet
Our research continues to suggest that Gold and Silver will rotate within a fairly narrow range over the next 3-5 weeks before setting up a likely price bottom near April 21st, 2019. We’ve been predicting this bottom formation for many months and have been warning our followers to prepare for this move and grab opportunities below $1300 when they set up.
This first chart, a Monthly chart showing our TT Charger price modeling system, clearly illustrates the strength of this bullish price trend and the initiation of this trend back in early 2016. One of the strengths of the TT Charger modeling system is that it establishes a number of key price data points and trend factors. The background color highlighted ranges show price range breadth and range expansion or contraction. The dual channel facets show where price is likely to find support and resistance. The DOT LEVELS show where critical support or resistance is in terms of the overall trend channels.
Right now, we are still in a bullish trend with key support near $1165. The Dual Channel system is showing the $1260 to $1285 level is currently the most likely active support levels just below current price. Thus, we could see a move to near these levels over the next 3+ weeks and I would suggest skilled traders jump on this opportunity. The Range system is showing a current $250~350 price range, thus, any upside price breakout could easily rally within this range and push prices at least $250+ higher than current levels – likely well above $1550. If range expansion sets up, we could see prices well above $1750.
We’ve authored hundreds of research posts over the past 12+ months and the one thing that we continue to mention is that Fibonacci price theory continues to operate on the premise that “price must always attempt to find and establish new price highs or lows – at all times”. Please keep this in mind as we continue.
Take a look at the TT Charger chart, above, and the raw Monthly price chart, below. Price must always attempt to find and establish new price highs or lows – so where is price going based on the most recent price rotations? Let’s review…
After rallying in early 2016 to establish a price high of $1377.50, gold immediately rotated downward to establish a higher low near $1124.50. The $1377.50 high price was a “new price high” in terms of previous rotational highs while the $1124.50 low was a higher low price rotation point. Thus, a failed “new price low”.
Since these two price points, Gold has settled into a sideways price channel where new price highs and lows have been attempted, but have failed to breakout out of the existing previous high and low price levels. As a technician of price, we can immediately identify this as a possible “Pennant or Flag” formation. With the last “new price level” being a “new price high” we still believe that Gold will attempt to break above the recent high price levels and attempt a much bigger upside price swing.
Our analysis suggests the April 21st date as a critical date for the potential price bottom in Gold and Silver. Our belief is that this date will like result in a near term momentum bottom in price. Where price may fall, briefly, below $1290 and rotate into a “washout low” price rotation. The opportunity for this move could come 3-5 days before or after the April 21st date.
This last chart, a Monthly price chart, illustrating the Pennant/Flag formation in Gold should be the clearest example we can provide that Gold will soon break out to the upside and rally extensively higher if our research and analysis are correct. The momentum that has built up over the past 2+ years, as well as the global demand for Gold by central banks and by investors as a hedging instrument, could prompt Gold and Silver to rally at least 50~60% in this first upside breakout wave – resulting in $1900 gold prices. Silver could rally to well above $18-$19 in a similar move and the number our researchers believe may become the upside target in Silver is $21.
This big picture chart and technical pattern could still take months to unfold if the price is to test the lower end of the trading range at $1225. If our analysis is correct, Gold and Silver could begin an upside price breakout shortly after April 21st (very likely to become evident in early May 2019). The upside potential for this move is at least $1550 in Gold and at least $18 in Silver.
Please understand that any upside breakout in Gold and Silver will likely be associated with general global market weakness including the potential for some type of global crisis event. This could be related to the EU, BREXIT, China, France or any other nation burdened by debt, dealing with election turmoil or related to social or economic angst. We could almost throw a dart at a map of the globe and hit some area that is poised for some type of economic crisis.
Our last buy signal for gold and gold miners was in Sept 2018 and subscribers and our team profited from that $100 gold rally. This next opportunity here is to understand that we only have about 20-25 days to search out and isolate the best entry prices we can find in Gold and Silver before our April 21st momentum bottom date hits. This means we need to prepare for this upside breakout move in Precious Metals and prepare our other open positions for the possibility of extended downside pricing concerns. If you read our continued research posts, you’ll understand that we believe the U.S. stock market will rotate a bit lower prior to this April 21st date and rally as well.
We believe the U.S. equities markets will become a safe haven, like Gold, where foreign investors can balance the strength of the U.S. Dollar with the strong U.S. economy and continued equity price appreciation while more fragile nations deal with economic crisis events and debt concerns. Thus, we believe capital will flood the US markets after April 21st as evidence of these economic concerns drives foreign investors into U.S. equities.
Take a minute to find out why Technical Traders Ltd. is quickly becoming one of the best research and trading services you can find anywhere on the planet. We are about to launch a new technology product to assist our members and we continue to deliver incredible research posts, like this one, where we can highlight our proprietary price modeling systems and adaptive learning solutions.
If you want to stay ahead of these markets moves and find greater success in 2019 and beyond Join Our Wealth Trading Newsletter Today.
Chris Vermeulen
Labels:
Chris Vermeulen,
downside,
Gold,
Oil,
precious metals,
Silver,
stocks,
The Technical Traders,
upside
Friday, March 15, 2019
Countdown to the Precious Metals Breakout Rally - Here is Our Targeted Entry Levels
If you have been following our research over the past few months, you already know that we’ve called just about every major move in Gold over the past 14+ months. Recently, we called for Gold to rally to $1300 area, establish a minor peak, stall and retrace back to setup a momentum base pattern. We predicted this move to take place back in January 2019 – nearly 30+ days before it happened.
Now, we are publishing this research post to alert you that we are about 15~30 days away from the momentum base setup in Gold which will likely mirror in Silver. Thus, we have about 20+ days to look for and target entry opportunities in both Gold and Silver before this momentum bottom/base sets up.
This Monthly Gold chart, below, shows you the historic peaks that make up a current resistance level near 1370. This level is critical in understanding how the momentum base and following breakout will occur. This resistance level must be broken before the upside rally can continue above $1400, then $1500. Ultimately, the momentum base we are expecting for form before April 21st is the “last base” to setup before a much bigger upside price move takes place. In other words, pay attention over the next 30 days before this move happens.
This next Monthly Silver chart is the real gem of the precious metals world. The upside potential for Silver is actually much bigger than Gold currently. Any breakout move will likely see Silver push well above $30 per ounce and we just need to watch the $18.90 level for signs the breakout is beginning. Silver will follow a similar basing patter as Gold. We expect only about 30 days of buying opportunity left before this basing pattern is completed. Again, watch the April 21st date as the key date for the breakout move to begin.
Palladium has reached our initial Fibonacci upside price targets. We expect price to consolidated and potentially rotate near the $1500 price level. Ideally, price could fall below the $1300 price level and target the $1100 area before finding any real support. As long as industrial demand continues for Palladium, we expect to see continued upside price activity over the long run. Right now, we are expecting a price contraction as global industrial demand may falter a bit.
Please consider the research we are presenting to you today. Our predictive modeling systems have been calling the metals markets quite accurately over the past 14+ months. If our prediction of a momentum base on or near April 21st is correct, then we should begin to see an incredible upside price swing in Gold and Silver shortly after this date. You won’t want to miss this one – trust us. There will be time to catch this move when it starts – it could be an extended upside move.
Pay attention and put April 21st on your calendar now.
If you like our research and our level of insight into the markets, then take a minute to visit our site to learn how we help our clients find and execute for success. We’ve been calling these market moves almost perfectly over the past 18+ months. Learn how our research team can help you stay ahead of these swings in price and find new opportunities for skilled traders. Take a minute to see how we can help you find and execute better trades by visiting The Technical Traders today.
Chris Vermeulen
Technical Traders Ltd.
Now, we are publishing this research post to alert you that we are about 15~30 days away from the momentum base setup in Gold which will likely mirror in Silver. Thus, we have about 20+ days to look for and target entry opportunities in both Gold and Silver before this momentum bottom/base sets up.
This Monthly Gold chart, below, shows you the historic peaks that make up a current resistance level near 1370. This level is critical in understanding how the momentum base and following breakout will occur. This resistance level must be broken before the upside rally can continue above $1400, then $1500. Ultimately, the momentum base we are expecting for form before April 21st is the “last base” to setup before a much bigger upside price move takes place. In other words, pay attention over the next 30 days before this move happens.
This next Monthly Silver chart is the real gem of the precious metals world. The upside potential for Silver is actually much bigger than Gold currently. Any breakout move will likely see Silver push well above $30 per ounce and we just need to watch the $18.90 level for signs the breakout is beginning. Silver will follow a similar basing patter as Gold. We expect only about 30 days of buying opportunity left before this basing pattern is completed. Again, watch the April 21st date as the key date for the breakout move to begin.
Palladium has reached our initial Fibonacci upside price targets. We expect price to consolidated and potentially rotate near the $1500 price level. Ideally, price could fall below the $1300 price level and target the $1100 area before finding any real support. As long as industrial demand continues for Palladium, we expect to see continued upside price activity over the long run. Right now, we are expecting a price contraction as global industrial demand may falter a bit.
Please consider the research we are presenting to you today. Our predictive modeling systems have been calling the metals markets quite accurately over the past 14+ months. If our prediction of a momentum base on or near April 21st is correct, then we should begin to see an incredible upside price swing in Gold and Silver shortly after this date. You won’t want to miss this one – trust us. There will be time to catch this move when it starts – it could be an extended upside move.
Pay attention and put April 21st on your calendar now.
If you like our research and our level of insight into the markets, then take a minute to visit our site to learn how we help our clients find and execute for success. We’ve been calling these market moves almost perfectly over the past 18+ months. Learn how our research team can help you stay ahead of these swings in price and find new opportunities for skilled traders. Take a minute to see how we can help you find and execute better trades by visiting The Technical Traders today.
Chris Vermeulen
Technical Traders Ltd.
Labels:
Chris Vermeulen,
Gold,
investing,
momentum,
palladium,
precious metals,
profit,
Silver,
The Technical Traders,
traders
Monday, October 29, 2018
Where's the Capitulation in Precious Metals?
Over the past 20+ years of research and trading in the markets, our team of traders and researchers know one thing is certain, when fear hits the global markets, precious metals react by rocketing higher. We’ve seen this happen over and over again – even when non-US geopolitical concerns spark some true fear in the markets.
If you’ve followed our research this week, we’ve been warning about how we believe this move is purely price and technical based and not really a fear based global price collapse. In other words, our technical systems, price modeling systems, and other advanced price analysis tools are suggesting this move is nearing an end and was likely a function of price rotation and less a function of true fear in the global markets.
Yes, there were a couple of key factors the precipitated this price move; the Fed, Earnings, Housing Data, Trade, and Geopolitical concerns and the US Elections. Yet the biggest concern for traders was the “deja vu” feeling that Housing could present another massive crash near an election. We’ve been through that and we know how ugly that can be if it were to unfold again.
Our researchers, at The Technical Traders, spent quite a bit of time going over the data and we continue to believe this downside price rotation in the global stock markets was nothing more than a technical price correction WITHOUT any real capitulation from other commodities. If the recent downside price collapse sowed any real fear into investors, then precious metals should have skyrocketed higher over the past 3+ weeks.
This Weekly Gold chart shows how prices advanced moderately over the past few weeks and failed to originate any real broad upside move as equity prices collapsed. Weeks ago, we predicted Gold would climb to near $1235, the CYAN line on this chart, before weakening to near $1200 again near the US mid term elections. After the elections, we believe that Gold will begin another price advance toward a price target near $1310 headed into 2019.
The YELLOW arrow showing the massive upside projections are based on our Fibonacci price modeling system and suggest that Gold may ultimately have an upside potential near $1435 or $1565 eventually. These upside targets, if reached, would be the result of REAL FEAR entering the global markets associated with a much greater contagion/capitulation event taking place. This may be something that happens in the future, as some point, but we don’t believe this is taking place now.
This Weekly Silver chart further illustrates the weakness in the precious metals sector throughout this recent global stock market collapse. The price of Silver actually fell slightly over the past few weeks and stayed near $14.75. A recent double bottom formation in Silver near $13.95 is a very strong indication that Silver is establishing a long-term base near the $14.00 level. You can see from our draws arrows that we believe Silver will continue to contract headed into the US mid-term elections, then begin a moderate advance higher.
We are actively searching for new trades within the precious metals sector that present clear opportunities for our members/subscribers as we believe this upside move in the metals will be one of the best trades in 2019. Although, right now, these trades are “set up trade” in the sense that we don’t expect any true fear to change price at the moment. We do expect investors to continue to look towards the precious metals markets as a form of protection from global events in the future and we believe that when the dam breaks and fear really does enter the markets, traders need to already be positioned within the precious metals sector – not chasing after the move.
Overall, our question still remains valid – where’s the capitulation in the precious metals? If this downside price movement within the global markets was “the top”, we have yet to see any real capitulation in precious metals, which we believe would be the first place to reflect this true fear. Without this capitulation, our researchers continue to believe this is a technical “reversion” move where price is moving lower to re-establish support for another upside price advance.
In conclusion, we do expect moderate price advances in the precious metals sector over the next 4~6+ months. We believe this sector will continue to attract investors as a means of protection against a sudden and more structural price collapse event in the future. Right now, though, we just don’t see the capitulation that would need to be in place if the downside equities move instilled any real fear in traders. It’s just not there – yet. Therefore, this recent downside swing appears to be a capital shift or reversion event where price will quickly attempt to find support, based (headed into the US mid-term elections – as we’ve been suggesting) and begin to move higher after November 12th.
Please visit The Technical Traders here for our Free Research to see all of our recent research posts and to help you understand what our researchers believe is really transpiring within the global markets.
Additionally, please visit The Technical Traders to learn how we can help you find and execute better trades and stay ahead of these market moves. Learn how we help our subscribers by delivering specialized content, video, research, trading signals and more. The next few years are going to be full of fantastic trading opportunities. Now is the time to start to take advantage of these setups and create greater success for your future.
Chris Vermeulen
If you’ve followed our research this week, we’ve been warning about how we believe this move is purely price and technical based and not really a fear based global price collapse. In other words, our technical systems, price modeling systems, and other advanced price analysis tools are suggesting this move is nearing an end and was likely a function of price rotation and less a function of true fear in the global markets.
Yes, there were a couple of key factors the precipitated this price move; the Fed, Earnings, Housing Data, Trade, and Geopolitical concerns and the US Elections. Yet the biggest concern for traders was the “deja vu” feeling that Housing could present another massive crash near an election. We’ve been through that and we know how ugly that can be if it were to unfold again.
Our researchers, at The Technical Traders, spent quite a bit of time going over the data and we continue to believe this downside price rotation in the global stock markets was nothing more than a technical price correction WITHOUT any real capitulation from other commodities. If the recent downside price collapse sowed any real fear into investors, then precious metals should have skyrocketed higher over the past 3+ weeks.
This Weekly Gold chart shows how prices advanced moderately over the past few weeks and failed to originate any real broad upside move as equity prices collapsed. Weeks ago, we predicted Gold would climb to near $1235, the CYAN line on this chart, before weakening to near $1200 again near the US mid term elections. After the elections, we believe that Gold will begin another price advance toward a price target near $1310 headed into 2019.
The YELLOW arrow showing the massive upside projections are based on our Fibonacci price modeling system and suggest that Gold may ultimately have an upside potential near $1435 or $1565 eventually. These upside targets, if reached, would be the result of REAL FEAR entering the global markets associated with a much greater contagion/capitulation event taking place. This may be something that happens in the future, as some point, but we don’t believe this is taking place now.
This Weekly Silver chart further illustrates the weakness in the precious metals sector throughout this recent global stock market collapse. The price of Silver actually fell slightly over the past few weeks and stayed near $14.75. A recent double bottom formation in Silver near $13.95 is a very strong indication that Silver is establishing a long-term base near the $14.00 level. You can see from our draws arrows that we believe Silver will continue to contract headed into the US mid-term elections, then begin a moderate advance higher.
We are actively searching for new trades within the precious metals sector that present clear opportunities for our members/subscribers as we believe this upside move in the metals will be one of the best trades in 2019. Although, right now, these trades are “set up trade” in the sense that we don’t expect any true fear to change price at the moment. We do expect investors to continue to look towards the precious metals markets as a form of protection from global events in the future and we believe that when the dam breaks and fear really does enter the markets, traders need to already be positioned within the precious metals sector – not chasing after the move.
Overall, our question still remains valid – where’s the capitulation in the precious metals? If this downside price movement within the global markets was “the top”, we have yet to see any real capitulation in precious metals, which we believe would be the first place to reflect this true fear. Without this capitulation, our researchers continue to believe this is a technical “reversion” move where price is moving lower to re-establish support for another upside price advance.
In conclusion, we do expect moderate price advances in the precious metals sector over the next 4~6+ months. We believe this sector will continue to attract investors as a means of protection against a sudden and more structural price collapse event in the future. Right now, though, we just don’t see the capitulation that would need to be in place if the downside equities move instilled any real fear in traders. It’s just not there – yet. Therefore, this recent downside swing appears to be a capital shift or reversion event where price will quickly attempt to find support, based (headed into the US mid-term elections – as we’ve been suggesting) and begin to move higher after November 12th.
Please visit The Technical Traders here for our Free Research to see all of our recent research posts and to help you understand what our researchers believe is really transpiring within the global markets.
Additionally, please visit The Technical Traders to learn how we can help you find and execute better trades and stay ahead of these market moves. Learn how we help our subscribers by delivering specialized content, video, research, trading signals and more. The next few years are going to be full of fantastic trading opportunities. Now is the time to start to take advantage of these setups and create greater success for your future.
Chris Vermeulen
Labels:
Chris Vermeulen,
commodities,
Gold,
investing,
precious metals,
Silver,
stocks,
Technical Traders
Thursday, January 12, 2017
Why Gold Could Soar Another 353%
By Justin Spittler
Gold is on the rise again. It’s climbed for two straight weeks, and it’s now up nearly 5% since December 15. Many precious metals investors couldn’t be happier about this. You see, gold stormed out of the gate last year. It had its strongest first quarter since 1986. By the end of June, it had risen 25%. Things were looking up. Then, the market changed course. Gold plunged 18% in just four months. Last month, it hit its lowest level since last February.• The sharp pullback spooked precious metals investors….
But regular Dispatch readers knew that gold would rebound. After such an explosive start to 2016, it was only natural for gold to “take a breather.” We urged you to not lose sight of the big picture. As we often remind you, gold’s a safe-haven asset. Investors buy it when they’re worried about the economy, financial system, or politics. And right now, investors have plenty of reasons to be worried, even if some are still enjoying the “Trump Honeymoon” phase.
• Louis James thinks gold will keep rising….
Louis is our chief resource expert. He is the editor of International Speculator and Casey Resource Investor, our advisories dedicated to resource stocks with big upside. According to Louis, gold has struggled recently because investors expect interest rates to rise. They have good reason to think this, too. After all, the Federal Reserve just raised its key interest rate… but for only the second time since 2006. It also said that it plans to lift rates three more times this year. Conventional wisdom tells us that this is bad for gold. Since gold doesn’t pay interest like a bond, most investors don’t want to own it when rates are rising or are likely to rise.
• According to Louis, the market has already “priced in” higher interest rates….
This means gold shouldn’t fall if the Fed sticks to its plan and raises rates three more times this year. Of course, that’s a big “if.” Heading into last year, the Fed said it wanted to raise rates four times. But it only raised rates once last year, and it waited until the eleventh hour to pull the trigger. We wouldn’t be surprised if the Fed sits on its hands again. If that happens, investors will know something is very wrong with the economy. Many folks will start buying gold hand over fist.
• But that’s not the only reason Louis is bullish on gold.…
Last week, he gave his subscribers several reasons why gold should keep rising:
➢ Rumors of new gold curbs in India have not panned out.• Gold is incredibly cheap, too.…
➢ Fear of the fall of New Rome [the EU] is driving Europeans into [U.S.] dollars and gold.
➢ The escalation of the “other” Cold War with China increases uncertainty in global markets.
➢ Even Trump’s best ideas (cuts in taxes and regulations) will cause disruptions that will have to work through the economy before things can improve.
Louis explains:
Gold needs to rise another US$900 or so to hit a new inflation-adjusted high. Given the trillions and trillions of new dollars, euros, yen, yuan, and so forth printed over the last 45 years, it should do much more than that.Right now, gold is trading for about $1,180. In other words, it would have to climb about 75% to reach its previous inflation-adjusted high.
But Louis thinks gold could race well past that in the coming years:
Many analysts see the current market as analogous to the great gold bull of the 1970s, only bigger and longer. Adjusted for inflation, gold rose about 353% from its mid-1970s trough to its 1980 peak. If that pattern repeats itself, gold would have to rise from its December 2015 low to just above US$5,200 per ounce by October 2022.If gold does anything close to what it did during the ’70s, precious metals investors could see explosive gains in the very near future. Just take a look at the chart below.

• Louis is so convinced that gold’s headed higher, he just made a giant bet on it…
He wrote last week:
I’m so sure, I put my money where my mouth is last week. As advised last month, I entered the market during the peak of Tax Loss Season. I’m not allowed to buy the same stocks I recommend (to avoid possible conflicts of interest), so I bought ETFs instead. In fact, I put about twice as much of my own cash into these proxies for gold stocks than I ever put into gold stocks before.Louis also plans to buy more gold at the first chance he gets:
I think that 2016 was an overture for what’s ahead. I intend to profit from it. And I’m not worried about any fluctuations in the near term. If prices drop, I’ll hope to buy more. If prices rise, it’s off to the races.• You, too, can make huge profits from rising gold prices.…
The key is to buy gold mining stocks. Gold miners are leveraged to the price of gold. This means gold doesn’t have to rise much for them to take off. During the 2000–2003 gold bull market, the average gold stock gained 602%. The best ones soared 1,000% or more. Of course, not every gold company is a winner. In fact, many gold stocks are total duds. That’s because gold mining is an incredibly difficult business. To protect your capital and make monster gains, you have to own the right gold stocks. Unfortunately, most folks have no clue what to look for in a gold stock.
That’s where we can help.…
You see, Louis is a true industry insider. He’s visited mining projects all around the world. He’s on a first name basis with many of the world’s top mining CEOs. And he understands the geology inside and out. Louis also has a proprietary system for finding the best gold stocks. Casey Research founder Doug Casey actually taught Louis this system… after he spent decades perfecting it.
You can learn more about Louis’ system by clicking here. As you’ll see, it’s delivered giant gains over and over again. Just don’t wait too long. Gold probably won’t stay cheap for much longer… meaning you’ll want to take action soon to have a shot at truly life changing gains. Click here to learn more.
Chart of the Day
Gold stocks are dirt cheap, too.Today’s chart compares the NYSE Arca Gold BUGS Index (HUI), which tracks large gold stocks, with the price of gold. The lower the ratio, the cheaper gold stocks are relative to gold. According to this ratio, gold stocks are cheaper today than they ever were during the dot com bubble. They’re also cheaper than they ever were during the last housing bubble.
Keep in mind, stocks were trading near record highs during these periods. Most investors were extremely bullish. They owned too many mainstream stocks and not enough gold stocks. Right now, this key ratio is lower than it was during either period. This tells us that today could be one of the best times to buy gold stocks since the turn of the century.
If you would like to add gold stocks to your portfolio, we encourage you to sign up for International Speculator. As we said earlier, this is our publication dedicated to gold stocks with the most upside.
Click here to begin your risk-free trial.

Labels:
Casey Research,
GDX,
GLD,
Gold,
HUI,
International Speculator,
investors,
Justin Spittler,
NYSE,
precious metals,
stocks
Wednesday, May 21, 2014
The Birth of a New Bull Market
By Jeff Clark, Senior Precious Metals Analyst
If I asked you why you think I’m bullish on platinum and palladium, you’d probably point to the strikes in South Africa, the world’s largest producer of platinum. Or maybe the geopolitical conflicts with Russia, the largest supplier of palladium. Maybe you’d even mention that some technical analysts say the palladium price has “broken out” of its trading range.
These are all valid points—but they’re reasons why a trader might be bullish. When the strikes end, or Russia ends its aggression, or short-term price momentum eases, they’ll sell.
And that will be a mistake.
Because underneath the headlines lies an irreparable situation with the PGM (Platinum Group Metals) market, one that will last at least several years and probably more like a decade. This market is teetering on the edge of a supply crunch, one more perilous than many investors realize. As the issues outlined below play out, prices will be forced higher—which signals that we should diversify into the “other” precious metals now.
The basic problem is that platinum and palladium supply is in a structural deficit. It won’t be resolved when the strikes end or Russia simmers down. Here are six reasons why…...
#1. Producers Won’t Meet the Cost of Production
The central issue of the striking workers in South Africa is wages. In spite of company executives offering to double wages over the next five years, workers remain on the picket line.
Once the strike settles, costs will rise further. Throw in ongoing problems with electric power supply, high regulations, and past labor agreements, and there is virtually no chance costs will come down. This dilemma means that platinum prices would need to move higher for production to be maintained anywhere near “normal” levels. Morgan Stanley predicts it will take at least four years for that to occur. And if the price of the metal doesn’t rise? Companies will have no choice but to curtail production, making the supply crunch worse.
#2. Inventories Are Near the Bottom of the Barrel
One reason platinum price moves have been muted during the work stoppage is because there have been adequate stockpiles. But those are getting low. Impala, the world’s second-largest platinum producer, said the company is now supplying customers from its inventories. In March, Switzerland’s platinum imports from strike-hit South Africa plummeted to their lowest level in five and a half years, according to the Swiss customs bureau.
Since producers can’t currently meet demand, some customers are now obtaining metal from other sources, including buying it in the open market. As inventories decline, supply from producing companies will need to make up the shortfall—and they’ll have little ability to do that.
#3. The Strikes Will Make Recovery Difficult and Prolonged
Companies are already strategizing how to deal with the fallout from the worst work stoppage since the end of apartheid in 1994…
- Amplats said it might sell its struggling Rustenburg operations. Even if it finds a buyer, the new operator will inherit the same problems.
- Impala said that even if the strike ends soon, its operations will remain closed until at least the second half of the year.
- Some companies have announced they may shut down individual shafts. This causes a future problem because some of these mines are a couple of miles deep and would require a lot of money to bring back online—which they may balk at doing with costs already so high.
- It’s not being advertised, but a worker settlement will almost certainly result in layoffs since some form of restructuring will be required. This could trigger renewed strikes and set in motion a vicious cycle that further degrades production and makes labor issues insurmountable.
#4. Russian Palladium Is Already in a Supply Crunch
When it comes to palladium, Russia matters more than South Africa, since it provides 42% of global supply. Remember: palladium demand is expected to rise more than platinum, due to new auto emissions control regulations in Asia.
- Ore grades at Russia’s major mines, including the Norilsk mines, are reported to be in decline.
- New mines will take as long as 10 years to come online. It could take a decade for Russian production to rebound—if Russia even has the resources to do it. This stands in stark contrast to global demand for palladium, which has grown 35.8% since 2004.
- Russia’s aboveground stockpile of palladium appears to have dwindled to near extinction. The precise amount of the country’s reserves is a state secret, but analysts estimate stockpiles were 27-30 million ounces in 1990.
Many analysts believe that since palladium reserve sales have shrunk, Russia has sold almost all its inventory. As unofficial confirmation, the government announced last week that it is now purchasing palladium from local producers. This paints a sobering picture for the world’s largest supplier of palladium—and is very bullish for the metal’s price.
#5. Demand for Auto Catalysts Cannot Be Met
The greatest use of PGMs is in auto catalysts, which help reduce pollution. Platinum has long been the primary metal used for this purpose and has no widely used substitute—except palladium.
Palladium is cheaper than platinum, but replacing platinum with palladium requires some retooling and, on a large scale, would worsen the supply deficit. As for platinum (which does work better than palladium in higher-temperature diesel engines), auto parts manufacturers are expected to use more of it than is mined this year, for the third straight year. Some investors may shy away from PGMs because they believe demand will decline if the economy enters a recession. That could happen, but tighter emissions controls and increasing car sales in Asia could negate the effects of declining sales in weakening Western economies.
For example, China is now the world’s top auto-producing country. According to IHS Global, auto sales in China are projected to grow 5% annually over the next three years. PricewaterhouseCoopers forecasts that sales of automobiles and light trucks in China will double by 2019. That will take a lot of catalytic converters. This trend largely applies to other Asian countries as well. It’s important to think globally when considering demand.
The key, however, is that supply is likely to fall much further than demand.
#6. Investment Demand Has Erupted
Investment demand for platinum rose 9.1% last year. The increase comes largely from the new South African ETF, NewPlat. At the end of April, all platinum ETFs held nearly 89,000 ounces—a huge amount when you consider it was zero as recently as 2007.
Growing investment demand adds to the deficit of these metals.
The Birth of a 10 Year Bull Market
Add it all up and the message is clear: by any reasonable measure, the supply problems for the PGM market cannot be fixed in the foreseeable future. We have a rare opportunity to invest in metals that are at the beginning of a potential 10-year bull run. Platinum and palladium prices may drop when the strikes end, but if so, that will be a buying opportunity. This market is so tenuous, however, that an announcement of employees returning to work may be too little, too late. We thus wouldn’t wait to start building a position in PGMs.
GFMS, a reputable independent precious metals consultancy, predicts the palladium price will hit $930 by year-end and that platinum will go as high as $1,700. But that will just be the beginning; the forces outlined above could easily push prices to double over the next few years.
At that point, stranded supplies might start coming back online—but not until after major, sustained price increases make it possible.
The RIGHT Way to Invest
In my newsletter, BIG GOLD, we cover the best ways to invest in the metals themselves (funds and bullion), but for the added leverage of investing in a profitable platinum/palladium producer, I have to hand the baton over to Louis James, editor of Casey International Speculator.
It’s the only platinum mining stock we recommend, and you can get its name, our full analysis, and our specific buy guidance with a risk free trial subscription to Casey International Speculator today.
If you give it a try today, you’ll get three investments for the price of one: Your Casey International Speculator subscription comes with a free subscription to BIG GOLD, where you’ll find two additional ideas on how to invest in the PGMs.
If you’re not 100% satisfied with our newsletters, simply cancel during the 3 month trial period for a full refund—but whatever you do, make sure you don’t miss out on the next 10 year bull market.
Click here to get started right now.
The article The Birth of a New Bull Market was originally published at Casey Research
Sign up for one of our Free Trading Webinars....Just Click Here!

Labels:
Bullish,
inventories,
Jeff Clark,
metals,
mines,
palladium,
precious metals,
production,
Russia,
Switzerland,
trader
Sunday, March 16, 2014
Is this Gold's "Best of the Breed" a Golden Rocket!
Gold
and gold stocks have be stabilizing for months and have been quietly
rising. Many gold stocks are up 30% even 50% in the past three months.
The $HUI AMEX Gold Bugs Index is up over 30% from the lows.
If you think you have missed most of the move already you are wrong. The truth is most of the biggest rallies in stocks take place after a basing pattern with 30 -50% or more has formed. This is signaling massive accumulation in gold stocks and its happening right now by the institutions.
So in this exclusive report I want to share one golden rocket stock pick which I feel has huge upside potential “IF” the precious metals market and miners can breakout of this stage 1 pattern it has formed.
One thing that excites me is about precious metals and gold stocks is the fact that we have heard nothing about gold, silver or mining stocks in the media for months… almost like the big institutions have told the media to avoid putting the spot light on it until they accumulate all they can in terms of physical bullion and stock shares.
This is the same for a few other sectors I have been watching build massive stage 1 bases in over the past few months and will be investing and actively trading them also once they break out of the basing stage.
Gold Stock Trading & Investing Success Formula
1. KISS – Keep It Simple Stupid! – Non one likes or follows complicated trading strategies
2. Understand and know how to identify the four market stages – Read My Book: Click Here
3. Know why and how stages must be traded for timing your entry, profit taking and exits.
4. Scan the market for the top performing sectors and focus on stocks/ETFs within those sectors.
5. Review all stocks and funds to meet setup criteria and trade only the best looking charts primed to start a new bull market (low overhead resistance nearby, strong relative strength, strong volume on breakout, 30 week SMA moving up etc..) Get this done for you: Click Here
6. Sit back, watch and monitor position for possible change in the stage, to adjust stops and identify profit taking levels.
Golden Rock Stock Pick
The chart below is top quality gold stock which has all the characteristics of a big winner. Just to be clear, I normally do not mention individual stocks within public reports. I am not compensated in any way to post this report. This is nothing more than my technical outlook on a stock and not investment advice. I do plan on buying some shares of this company this week or next.

Golden Rocket Conclusion:
While it still my be a little early for precious metals to bottom, it looks as though the stage (pardon the pun) has been set for a precious metals bull market to start. As they say, there is always a bull market somewhere… the key is finding it and taking the proper action.
If you want simple, hassle free trading and investing join my newsletter today.
Just visit The Gold & Oil Guy
Sincerely,
Chris Vermeulen
Founder of Technical Traders Ltd. - Partnership Program
Check out our other "Gold and Crude Oil Trading Ideas"
If you think you have missed most of the move already you are wrong. The truth is most of the biggest rallies in stocks take place after a basing pattern with 30 -50% or more has formed. This is signaling massive accumulation in gold stocks and its happening right now by the institutions.
So in this exclusive report I want to share one golden rocket stock pick which I feel has huge upside potential “IF” the precious metals market and miners can breakout of this stage 1 pattern it has formed.
One thing that excites me is about precious metals and gold stocks is the fact that we have heard nothing about gold, silver or mining stocks in the media for months… almost like the big institutions have told the media to avoid putting the spot light on it until they accumulate all they can in terms of physical bullion and stock shares.
This is the same for a few other sectors I have been watching build massive stage 1 bases in over the past few months and will be investing and actively trading them also once they break out of the basing stage.
Gold Stock Trading & Investing Success Formula
1. KISS – Keep It Simple Stupid! – Non one likes or follows complicated trading strategies
2. Understand and know how to identify the four market stages – Read My Book: Click Here
3. Know why and how stages must be traded for timing your entry, profit taking and exits.
4. Scan the market for the top performing sectors and focus on stocks/ETFs within those sectors.
5. Review all stocks and funds to meet setup criteria and trade only the best looking charts primed to start a new bull market (low overhead resistance nearby, strong relative strength, strong volume on breakout, 30 week SMA moving up etc..) Get this done for you: Click Here
6. Sit back, watch and monitor position for possible change in the stage, to adjust stops and identify profit taking levels.
Golden Rock Stock Pick
The chart below is top quality gold stock which has all the characteristics of a big winner. Just to be clear, I normally do not mention individual stocks within public reports. I am not compensated in any way to post this report. This is nothing more than my technical outlook on a stock and not investment advice. I do plan on buying some shares of this company this week or next.
Golden Rocket Conclusion:
While it still my be a little early for precious metals to bottom, it looks as though the stage (pardon the pun) has been set for a precious metals bull market to start. As they say, there is always a bull market somewhere… the key is finding it and taking the proper action.
If you want simple, hassle free trading and investing join my newsletter today.
Just visit The Gold & Oil Guy
Sincerely,
Chris Vermeulen
Founder of Technical Traders Ltd. - Partnership Program
Check out our other "Gold and Crude Oil Trading Ideas"
Subscribe to:
Posts (Atom)