Showing posts with label Fed. Show all posts

Thursday, December 27, 2018

Has This Selloff Reached a Bottom Yet?

Everyone wants to know if this selloff has reached a low or bottom yet and what to expect over the next 30 - 60+ days. Since October, the U.S. stock market has reacted to the U.S. Fed raising rates above 2.0% with dramatic downward price moves. The latest raise by the U.S. Fed resulted in a very clear price decline in the markets illustrating the fact that investors don’t expect the markets to recover based on the current geopolitical and economic climate.

Over 5 years ago, our research team developed a financial modeling system that attempted to model the U.S. Fed Funds Rate optimal levels given certain inputs (US GDP, US Population, U.S. Debt, and others). The effort by our team of researchers was to attempt to identify where and when the U.S. Fed should be adjusting rates and when and where the U.S. Fed would make a mistake. The basic premise of our modeling system is that as long as Fed keeps rates within our model’s optimal output parameters, the U.S. (and presumably global) economy should continue to operate without massive disruption events unless some outside event (think Europe, China or another massive economic collapse) disrupts the ability of the U.S. economy from operating efficiently. We’ve included a screen capture of the current FFR modeling results below.

This model operates on the premise that U.S. debt, population, and GDP will continue to increase at similar levels to 2004-2012. We can see that our model predicted that the U.S. Fed should have begun raising rates in 2013-2014 and continued to push rates above 1.25% before the end of 2015. Then, the U.S. Fed should have raised rates gradually to near 2.0% by 2017-2018 – never breaching the 2.1250% level. Our model expects the U.S. Fed to decrease rates to near 1.4 - 1.5% in early 2019 and for rates to rotate between 1.25%~2.0% between now and 2020. Eventually, after 2021, our model expects the US Fed to begin to normalize rates near 1.5-1.75% for an extended period of time.


Additionally, our Custom Market Cap index has reached a very low level (historically extremely low) and is likely to result in a major price bottom formation or, at least, a pause in this downward price move that may result in some renewed forward optimism going forward. Although we would like to be able to announce that the market has reached a major price bottom and that we are “calling a bottom” in this move, we simply can’t call this as a bottom yet. We have to wait to see if and when the markets confirm a price bottom before we can’t attempt any real call in the markets. You can see from our Custom Market Cap Index that the index level is very near historically low levels (below $4.00 – near the RED line) and that these levels have resulted in major price low points historically. We are expecting the price to pause over the next week or so near these $3.50 levels and attempt to set up a rotational support level before attempting another price swing. As of right now, we believe there is fairly strong opportunity for a price bottom to set up, yet these are still very early indicators of a major price bottom and we can’t actually call a bottom yet. If our Custom Market Cap Index does as it has in the past, then we are very close to a bottom formation in the US markets and traders would be wise to wait for technical confirmation of this bottom before jumping into any aggressive long trades.


Lastly, our Custom Global Market Cap Index has also reached levels near the lower deviation channel range over the past 7+ years, which adds further confidence that a potential price bottom may be near to forming in the US markets. As we can see from the chart below, the recent selloff has pushed our Global Market Cap Index to very low levels – from near $198 to near $144; a -27.55% total price decline. Nearing these low levels, we should expect the global markets to attempt to find some support and to potentially hammer out a bottom, yet we are still cautious that this downward price move could breach existing support levels and push even further in to bear market territory.


There are early warning signs that the market may be attempting to form a market bottom and our research team is scanning every available tool we have at out disposal to attempt to assist all of our members and followers. We alerted you to this move back on September 17, 2018 with our ADL predictive modeling system call for a -5 - 8%+ market correction. Little did we know that the U.S. Fed would blow the bottom out of the markets with their push to raise rates above the 2.0% level.

As the U.S. Fed has already breached our Fed Modeling Systems suggested rate levels, the global markets will be attempting to identify key price support in relation to this new pricing pressure and the expectations that debt/credit issues will become more pronounced as rates push higher. In other words, the global markets are attempting to price in the renewed uncertainty that relates to the U.S. Fed pushing rates beyond optimal levels. We expect the markets are close to finding true support near the levels we’ve shown on our Custom Index charts, yet we still need confirmation before we can call it a bottom.

We will continue to update you with our research and analysis as this move plays out and we hope you were able to follow our analysis regarding the Metals, Oil, Energy and other sectors that called many of these massive price swings. We pride ourselves on our analysis and ability to use our proprietary tools to find and execute successful trades for our members. Our ADL predictive price modeling system is still suggesting an upward price move is in the works for the U.S. markets and we are waiting for our “ultimate low price” level to be reached before we expect an upside leg to drive prices higher again. Based on our current research, we may be nearing the point where the markets attempt to hammer out a price bottom – yet time will tell if this is the correct analysis.

Please take a minute to visit The Technical Traders to learn how we help our members find and execute better trades. Recent swings in the markets have made it much more difficult for average traders to find and execute successful short term trades. Learn how we can help you find greater success and read some of our recent research posts by visiting our Free Research section of the Technical Traders.


Stock & ETF Trading Signals

Tuesday, December 18, 2018

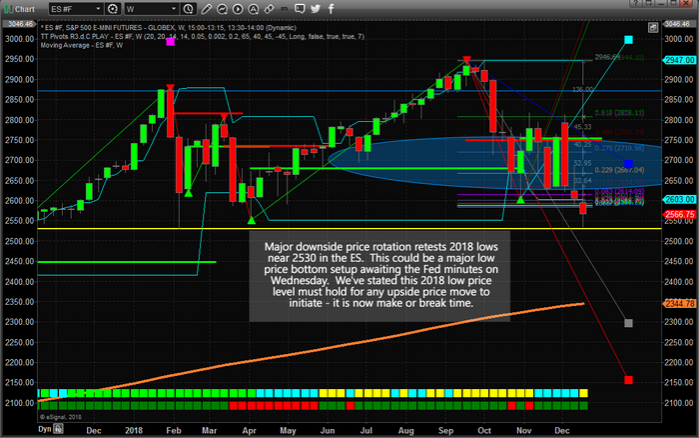
ES Sets Up Major Double Bottom Ahead of the Fed

The downside price rotation in the U.S. markets on Monday, December 17, set up a near perfect double bottom formation near the 2530 price level and also prompted a dramatic price recovery after reaching these lows. Currently, the ES has rallied over 35 pts from this low level and will likely pause before the Fed minutes are announced on Wednesday, December 19.

If the Fed holds true to their earlier promises of continued rate increases, we could see this 2530 level broken as price retreats from any relief rally and attempts to find lower support. If the Fed changes the context of their message and adopts a slower and more insightful rate policy, the markets are poised for one heck of a potential rally. The ES if down by a little more than 400 points (-13.75%) from the peak in September 2018.

Check Out Our 3 Hour Trading Strategy Mastery Video 

We believe the markets have already priced in the expected Fed rate hike and we believe an additional rate hike could become a catalyst for a downside move towards 2300 if the 2530 level is breached. We would like to see the Fed pause, or even decrease rate levels by 25 bp, allowing the markets to parse through the credit/debt issues that have started to plague the global markets before it causes the markets to “turn turtle” and prompt a greater crisis event.


Some of our earlier research, from 2013-2014, was a modeling system dedicated to the Fed interest rates, GDP, Population and Asset Valuations. We modeled various outcomes of the global economy over the future 15 to 20 years including massive debt increases, massive debt decreases, slowing GDP, growing GDP, massive changes in population and asset levels and many others. Overall, our research showed that the 2% Fed Funds Rate level should have been an upper boundary and should have been a near term target back in 2015-2016. As or right now, the Fed should be decreasing rates to allow for a smooth transition through a “deleveraging process”.

The Fed is behind the curve and is failing to properly navigate the future outcomes of global assets, debt and credit cycles. If the US Fed is not cautious over the next 12+ months with how they manage the FFR, they could push the entire global economy over a cliff faster than they can spell “Powell”.

Everything rests on Wednesday, December 19 and the U.S. Fed at this point. Our predictive modeling systems are still suggesting we should see strong upside price activity throughout the end of this year and early next year – assuming the Fed does not pull the floor out from under this market and capsize the global credit markets again.

Learn how we can help you find and execute trades for better success. Our analysis has been well ahead of these market moves for months and we’ve nailed some incredible trades.

Visit The Technical Traders to learn more.

Chris Vermeulen


Wednesday, June 20, 2018

Are the Global Markets Shifting Away from U.S. Price Correlation?

Well over a month ago we warned our followers of a “capital market shift” that was taking place in the global markets. Nearly 3 months before that time, we warned that China’s economy was about to enter a sustained economic down trend cycle that could be dangerous to the global markets. Today, we offer further evidence that the global markets are, in fact, shifting away from a price correlation to the U.S. stock market and this move could be a warning sign that emerging markets and global markets could lead the world into an extended stagflation cycle.

Think about this for a minute, as we briefly discussed in our last article, what would happen if the U.S. markets continued to rally on a strong economy with strong consumer participation while the U.S. Fed was slow to raise interest rates while supporting a transitional shift of the US economy towards more manufacturing, technology, and expectations? How would the world’s economies react to such a shift given their current economic cycles and opportunities? Would they be able to keep up with the U.S. or would they start to trail further and further behind the U.S.?

It is our belief that any continued strengthening of the U.S. economy could, in fact, present real dangers for many of the world’s economies simply because they may fall completely out of sync with the U.S. stock market as their currencies, economies and consumer expectations fail to keep up with the U.S. capabilities. How all of this will play out over the next few months/years is our concern. We know it will result in some tremendous trading opportunities for investors, but it could also create a new class of undervalued assets that could present some real long term opportunity over the next 20+ years.

Let’s start by taking a look at our China/Asia custom index to show how the past 60+ days have more clearly shown this price disconnect happening. When you look at this chart, pay attention to how closely this custom index (the candles) have moved in relation to the SPY (the blue area chart overlaid onto the candles). Notice how the moves in the SPY were relatively closely mirrored by the custom index. This is a direct price correlation to the SPY over an extended period of time.

Now, focus on the last 6 - 9 bars on this chart and take a really close look at how the SPY has rallied higher while this custom index has stayed flat to lower over the same time frame. The only answer for this type of price disconnect is that a global capital shift could be underway that is driving capital out of certain markets and away from risk and danger. In other words, it is our opinion that the China/Asia markets are starting to be perceived as riskier and more dangerous in relation to the U.S. market and other more mature markets.


Now, let’s take a look at the BRICS custom index. YIKES!! What happened here? Through most of 2017, a price correlation can be seen where the BRICS index moved somewhat in unison with the SPY price activity – although in some cases a bit delayed. Yet, after March 2018, something dramatic happened. When the SPY rotated lower in late March 2018, the BRICS index stayed relatively flat near the highs. Then in May 2018, a price disconnect became very evident as the SPY began to rally while the BRICS index began to sell off – very dramatically. The BRICS index also broke through the BLUE price channel recently which is another sign that price trends/activities have shifted.


You should now be starting to see what we have been warning you about for months – the global capital market shift that is taking place. This is happening because mature nations and economies are capable of achieving great economic growth and stability than many foreign markets and because many foreign markets have squandered the last 10+ years attempting to expand externally and not support their fundamental economic needs. As we have used this example before, a flower only has two modes of operation – flower mode (expand) or survive (keep the core plant alive). We believe these foreign markets have been in “flower mode” for the past 10+ years and have failed to support the core elements of their economies.

Now, onto more examples, this time Western Europe. Again, this custom index is weighted with the SPY, so it should reflect some of the price support of the recent uptrend. Yet, we see the most recent few weeks of this chart have shown a dramatic downtrend? This would indicate that the European markets/currencies are disconnecting from the US majors at a much more dramatic pace, recently, that they have been over the past few years. Yikes!


What about India & SE Asia? Our custom India index has shown relatively FLAT recent price activity compared to the SPY. Overall, our opinion is that India has yet to completely diverge from the U.S. majors and we urge all investors to be aware that any further price breakdown in this India custom index will warn that the Indian/SE Asian economies are losing their battle to stay correlated to the U.S. markets going forward. Right now, there is evidence of weakness in the India custom index – yet there are limited signs of a broken correlation to the U.S. markets. It certainly shows that this price disconnect could be happening and likely is happening – yet we don’t have clear signs that this custom index is breaking to new lows (yet).


Lastly, let's take a look at our Russia/Eastern Europe custom index for signs of a price disconnect. This chart is somewhat similar to the India chart (above). There are signs of weakness and downside price rotation while the SPY has been rallying, yet there is not massive disconnect evident on the right edge of the chart. We believe the recent downside price rotation within this custom index are the early warning signs of a price disconnect in the early stages of setting up (just like in the India chart). We believe these charts clearly show that the US market (and other mature economies) are advancing beyond the functional capabilities of many emerging and foreign markets. What will come from this, if it continues to play out as we expect, is a huge number of opportunities for traders and investors.


The next 3 to 5 years are likely to be very interesting and exciting for traders and investors. These types of moves don’t happen too often and should these markets continue to rotate as we are expecting, we could see some very big currency and foreign market moves over the next few months and years. You owe it to yourself to stay ahead of this move and learn how to profits from the extended volatility that will likely result from this price disconnect.

We believe we have nailed this analysis as we have correctly called the weakness in China/Asia as well as the global capital shift that is starting to play out in the global markets. We already know what will likely move and when we should expect these opportunities to set up. We are preparing our valued subscribers for this move and protecting them by providing them even more detailed research and analysis than you are seeing here.

Visit The Technical Traders to learn how this could be the biggest opportunity of your trading and investing life and how you need a qualified and dedicated team of researchers to help you stay ahead of these moves over the next 2+ years with our long term discounted subscription plan and Save 39%. There will come a time when you will be wishing you had access to our proprietary research and member only trade alerts and investment positions. Become a technical trader today [just visit here] and prosper with us!

Chris Vermeulen
Technical Traders Ltd.

Monday, August 28, 2017

VIX Spikes Showing Massive Volatility Increase

Today, we are going to revisit some of our earlier analysis regarding the VIX and our beloved VIX Spikes.  Over the past 3+ months, we’ve been predicting a number of VIX Spikes based on our research and cycle analysis.  Our original analysis of the VIX Spike patterns has been accurate 3 out of 4 instances (75%).  Our analysis has predicted these spikes within 2 to 4 days of the exact spike date.  The most recent VIX Spike shot up 57% from the VIX lows.  What should we expect in the future?

Well, this is where we should warn you that our analysis is subjective and may not be 100% accurate as we can’t accurately predict what will happen in the future. Our research team at Active Trading Partners.com attempt to find highly correlative trading signals that allow our members to develop trading strategies and allow us to deliver detailed and important analysis of the US and global markets.

The research team at ATP is concerned that massive volatility is creeping back into the global markets. The most recent VIX spike was nearly DOUBLE the size of the previous spike. Even though the US markets are clearly range bound and rotating, we expect them to stay within ranges that would allow for the VIX to gradually increase through a succession of VIX spike patterns in the future.

Let’s review some of our earlier analysis before we attempt to make a case for the future. Our original VIX Spike article indicated we believed a massive VIX spike would happen near June 29th. We warned of this pattern nearly 3 weeks ahead of the spike date. Below, you will see the chart of the VIX and spikes we shared with our members. This forecast was originally created on June 7th and predicted potential spikes on June 9th or 12th and June 29th.


What would you do if you knew these spikes were happening?

Currently, we need to keep in mind the next VIX Spike Dates
Sept 11th or 12th and finally Sept 28th or 29th.

Our continued research has shown that the US markets are setting up for a potential massive Head-n-Shoulders pattern (clearly indicated in this NQ Chart). The basis of this analysis is that the US markets are reacting to Political and Geo-Economic headwinds by stalling/retracing. The rally after the US Presidential election was “elation” regarding possibilities for increased global economic activities. And, as such, we have seen an increase in manufacturing and GDP output over the past 6+ months. Yet, the US and global markets may have jumped the gun a bit and rallied into “hype” setting up a potential corrective move.


Currently, the NQ would have to fall an additional 4.5% to reach the Neck Line of the Head-n-Shoulders formation. One interesting facet of the current NQ chart is that is setting up in a FLAG FORMATION that would indicate a massive breakout/breakdown is imminent. The cycle dates that correspond to this move are the September 11th or 12th move.


Please understand that we are attempting to keep you informed as to the potential for a massive volatility spike in the US and Global markets related to what we believe are eminent Political and Geo-Economic factors. Central Banks have just met in Jackson Hole, WY and have been discussing their next moves as well as the US Fed reducing their balance sheets. Overall, the US economy appears to show some strength, yet as we have shown, delinquencies have started to rise and this is not a positive sign for a mature economic cycle. Expectations are that the US Fed will attempt another one or two rate raises before the end of 2017. Our analysis shows that Janet Yellen should be moving at a snail’s pace at this critical juncture.


The last, most recent, VIX Spike was nearly DOUBLE the size of the previous Spike. This is an anomaly in the sense that the VIX has, with only a few exceptions, continued to contract as the global central banks continued to support the world’s economies. In other words, smooth sailing ahead as long as the global banks were supplying capital for the recovery.

Now that we are at a point where the central banks are attempting to remove capital from their balance sheets while raising rates and dealing with debt issues, the markets are looking at this with a fresh perspective and the VIX is showing us early warning signs that massive volatility may be reentering the global markets. Any future VIX Spike cycles that continue to increase in range would be a clear indication that FEAR is entering the markets again and that debt, contraction and decreased consumer participation are at play.

I don’t expect you to fully understand the chart and analysis below, but the take away is this. Pay attention to these dates: September 11, September 28 and October 16. These are the dates that will likely see increased price volatility associated with them and could prompt some very big moves.


This analysis brings us to an attempt at creating a conclusion for our readers. First, our current analysis of the Head-n-Shoulders pattern in the NQ is still valid. We do not have any indication of a change in trend or analysis at this moment. Thus, we are still operating under the presumption that this pattern will continue to form. Secondly, the current VIX spike aligns perfectly with our analysis that the markets are becoming more volatile as the VIX WEDGE tightens and as the potential for the Head-n-Shoulders pattern extends. Lastly, FEAR and CONCERN has begun to enter the market as we are seeing moves in the Metals and Equities that portend a general weakness by investors.

We will add the following that you won’t likely see from other researchers – the time to act is NOT NOW. Want to know why this is the case and why we believe our analysis will tell us exactly when to act to develop maximum profits from these moves?

Join the Active Trading Partners to learn why and to stay on top of these patterns as they unfold. We’ve been accurate with our VIX Spike predictions and we will soon see how our Head and Shoulders predictions play out. We’ve already alerted you to the new VIX Spike dates (these alone are extremely valuable). We are actively advising our ATP members regarding opportunities and trading signals that we believe will deliver superior profits. Isn’t it time you invested in your future and prepared for these moves?


Join the Active Trading Partners HERE today and Join a team dedicated to your success.


Stock & ETF Trading Signals

Thursday, January 19, 2017

One Big, Fat, Ugly Bubble

By Nick Giambruno

The establishment is setting up Donald Trump. The mainstream media hates him. Hollywood hates him. The “Intellectual Yet Idiot” academia class hates him. The CIA hates him. So does the rest of the Deep State, or the permanently entrenched “national security” bureaucracy. They did everything possible to stop Trump from taking office. None of it worked. They fired all of their bullets, but he still wouldn’t go down.

Of course, the Deep State could still try to assassinate Trump. It’s obvious the possibility has crossed his mind. He’s taken the unusual step of supplementing his Secret Service protection with loyal private security.
The Deep State’s next move is to pin the coming stock market collapse on Trump. When people think “Greater Depression,” they’ll think “Donald Trump.” 

The economy has been on life support since the 2008 financial crisis. The Fed has pumped it up with unprecedented amounts of “stimulus.” This has created enormous distortions and misallocations of capital that need to be flushed. Think of the trillions of dollars in money printing programs—euphemistically called quantitative easing (QE) 1, 2, and 3.

Meanwhile, with zero and even negative interest rates in many countries, rates are the lowest they’ve been in 5,000 years of recorded human history. This is not hyperbole. We’re really in uncharted territory. (Interest rates were never lower than 6% in ancient Greece, and ranged from 4% to over 12% in ancient Rome.) The too big to fail banks are even bigger than they were in 2008. They have more derivatives, and they’re much more dangerous.

If the Deep State wants to trigger a stock market collapse on par with 1929, it just has to pull the plug on the extraordinary life support measures it’s used since the last crisis. It’s already baked in the cake. It’s just a matter of when they decide to trigger the controlled demolition. Donald Trump is the perfect fall guy. And there are signs the Deep State is already starting to get its revenge. The most important variable to watch is the Federal Reserve—the quintessential establishment institution.


Source: Ben Garrison

Even though most politicians, economists, and pundits in the mainstream media won’t admit it, central banks exist to help governments finance themselves, at the expense of the average man. It’s the hidden, but real, reason they exist. The Fed accommodated Obama—effectively financing his regime’s deficits by creating new currency units. I doubt they will do Trump the same favor. And Trump will likely run up enormous deficits. Don’t forget about the $1 trillion in stimulus spending he has planned. If the Fed doesn’t gobble up the debt used to finance Trump’s spending, it will only work to push up interest rates.

Interest Rates

Manipulating interest rates to near 5,000-year lows is a crucial part of the life-support system. Now the Fed is set to pull the plug and leave Trump holding the bag. In December 2015 the Fed raised interest rates for the first time in almost a decade, from 0% to a mere 0.25%. The Fed kept rates there until last month, when it raised them to 0.50%. It also announced it would accelerate rate hikes throughout 2017—three in total.

There’s a good chance the Fed will announce these rate hikes during the eight Federal Open Market Committee (FOMC) meetings it has scheduled in 2017.

2017 FOMC Meetings
February 1 July 26
  March 15 September 20
  May 3 November 1
  June 14 December 13

I think some of these rate hikes will be much bigger than the 0.25% most expect. They could pull a series of 0.50% rate hikes… or go even bigger. Anything greater than the normal 0.25% tempo would shock the market—and seem designed to hurt Trump.

The establishment will get its revenge on Trump. The Federal Reserve is its weapon of choice.

Trump seems aware of the situation. He recently said, “They’re keeping the rates down so that everything else doesn’t go down.” He’s also said that “We have a very false economy” and the stock market is a “big, fat, ugly bubble.” During the campaign, Trump called Fed Chair Janet Yellen “highly political.” He said the Fed should raise interest rates but won’t because of “political reasons.” (Raising rates before the election would have hurt Hillary Clinton.)

The Media

The mainstream media is another variable to watch. Paul Krugman, a New York Times economist—or, more accurately, witch doctor economist—has come out against Trump’s $1 trillion infrastructure stimulus. It’s bizarre because Krugman, a die-hard Keynesian, had previously never seen a “stimulus” program he didn’t like. Once, he even advocated faking a space-alien invasion to stimulate the economy. It shows that Krugman is not only a fool, but a hypocrite. This is a clue.

I bet the rest of the mainstream financial media—CNBC, Bloomberg, The Economist, etc.—will morph from bullish cheerleaders into pessimistic doom-and-gloomers after Trump takes office. Don’t expect them to find any “green shoots” after the market tanks on Trump’s watch. All this is why what happens after Trump’s inauguration could change everything… in sudden, unexpected ways. This is exactly why Doug Casey and I put together a time-sensitive video explaining how it could all go down.

You absolutely must see this urgent video before Trump’s inauguration in two days. Click here to watch it now.


The article One Big, Fat, Ugly Bubble was originally published at caseyresearch.com.


Wednesday, March 30, 2016

Believe It or Not, It’s Happening to Gold

Last night as I was going over my charts and running my end of the day analysis the charts jumped out at me with a trade setup and wanted to share my cycle chart for gold with you. The price chart of gold below is exactly what my cycle analysis told us to look for last week WELL ahead of the today’s news and its things play out I as I feel they will then we stand to make some pretty good money as gold falls in value during the month of April.

If you have been following my work for any length of time then you know big price movements in the market like today (Tuesday, March 29th) based around the FED news ARE NOT and SHOULD NOT be of any surprise. In fact, this charts told use about today’s pop 2 weeks ago and we have been waiting for it ever since. The news is simply the best way to get the masses on board with market moves and gets them on the wrong side of the market before it makes a big move in the other direction, most times… not always, though.

Take a look at this chart below. You’ll see two cycle indicators, one pink and one blue. The pink cycle line is a cluster of various cycles blended together which allows us to view the overall market trend of biased looking forward 5 – 30 days. The blue cycle line is a cluster of much shorter time frame cycles in this tells us when we should expect strong moves in the same direction of the pink cycles or counter trend pullbacks within the trend.

One quick point to note with cycle trading is that the height and depth of the cycle does not mean the price will rise or fall to those levels, it simply tells us if the market has an upward or downward bias. The current cycle analysis for gold along with the current price is telling us that today the short term cycle topped which is the blue line and our main trend cycle is already heading lower. The odds favor gold should roll over and make new multi-month Lows in August.
gold-collapse

In short, we have been waiting for gold to have a technical breakdown and to retrace back up into a short term overbought condition. Today Tuesday, March 29 it looks as though we finally have the setup. Over the next 5 to 15 days I expect gold to drop along with silver and gold stocks. There are many ways to play this through inverse exchange traded funds or short selling gold, silver or gold stocks.

This year and 2017 I believe are going to be incredible years for both traders and investors. If treated correctly, it can be a life changing experience financially for some individuals. Join my pre-market video newsletter and start your day with a hot cup of coffee and my market forecast video.

Sign up right here > www.The Gold & Oil Guy.com

Chris Vermeulen


Stock & ETF Trading Signals

Friday, December 25, 2015

Is the “Easy Money Era” Over?

By Justin Spittler

It finally happened. Yesterday, the Federal Reserve raised its key interest rate for the first time in nearly a decade. Dispatch readers know the Fed dropped interest rates to effectively zero during the 2008 financial crisis. It has held rates at effectively zero ever since…an unprecedented policy that has warped the financial markets. Rock bottom interest rates make it extremely cheap to borrow money. Over the last seven years, Americans have borrowed trillions of dollars to buy cars, stocks, houses, and commercial property. This has pushed many prices to all time highs. U.S. stock prices, for example, have tripled since 2009.

The Fed raised its key rate by 0.25%.....

U.S. stocks rallied on the news, surprising many investors. The S&P 500 and NASDAQ both gained 1.5% yesterday. The Fed plans to continue raising rates next year. It’s targeting a rate of 1.38% by the end of 2016. So, is this the beginning of the end of the “easy money era?” For historical perspective, here’s a chart showing the Fed’s key rate going back to 1995. As you can see, yesterday’s rate hike was tiny. The key rate is still far below its long term average of 5.0%.


Josh Brown, writer of the financial website The Reformed Broker, put the Fed’s rate hike in perspective.

The overnight borrowing rate…has now risen from “around zero” to “basically zero.”

In other words, interest rates are still extremely low, and borrowing is still extremely cheap. We’re not ready to call the end of easy money yet.

Cheap money has goosed the commercial property market..…

Commercial property prices have surged 93% since bottoming in 2009. Prices are now 16% higher than their 2007 peak, according to research firm Real Capital Analytics. Borrowed money has been fueling this hot market. According to the Fed, the value of commercial property loans held by banks is now $1.76 trillion, an all time high. The apartment market is especially frothy today. Apartment prices have more than doubled since November 2009. U.S. apartment prices are now 34% above their 2007 peak.

Sam Zell is cashing out of commercial property..…

Zell is a real estate mogul and self-made billionaire. He made a fortune buying property for pennies on the dollar during recessions in the 1970s and 1990s. It pays to watch what Zell is buying and selling. He was one of few real estate gurus to spot the last property bubble and get out before it popped. In February 2007, Zell sold $23 billion worth of office properties. Nine months later, U.S. commercial property prices peaked and went on to plunge 42%.

Recently, Zell has started selling again. In October, Zell’s company sold 23,000 apartment units, about one quarter of its portfolio. The deal was valued at $5.4 billion, making it one of the largest property deals since the financial crisis. The company plans to sell 4,700 more units in 2016. Yesterday, Zell told Bloomberg Business that “it is very hard not to be a seller” with the “pricing currently available in the commercial real estate market.”

Recent stats from the commercial property market have been ugly. In the third quarter, commercial property transactions fell 6.5% from a year ago. Transaction volume also fell 24% between the second quarter and third quarter.

Auction.com, the largest online real estate marketplace, said economic growth is hurting the market.
Both commercial real estate transaction volume and pricing have showed signs of softening over the past few months. It’s likely that what we’re seeing is the result of reduced capital spending due to some weakness in the U.S. economy, coupled with a highly volatile economic climate in China and ongoing financial issues in Europe.

Zell is bearish on the U.S. economy..…

On Bloomberg yesterday, he predicted that the U.S. will have a recession by the end of 2016.
I think that there’s a high probability that we’re looking at a recession in the next twelve months.

A recession is when a country’s economy shrinks two quarters in a row. The U.S. economy hasn’t had a recession in six years. Instead, it’s been limping through its weakest recovery since World War II.
Zell continued to say that the U.S. economy faces many challenges.


World trade is slowing. Currencies continue to be manipulated. You’re looking at the beginnings of layoffs in multinational companies. We’re still looking all over the world for demand…
So, when you look at those factors it’s hard to see where strength is going to come from. I think weakness is going to be pervasive.

Like Zell, we see tough economic times ahead. To prepare, we suggest you hold a significant amount of cash and physical gold. We put together a short video presentation with other strategies for how to protect your money in an economic downturn. Click here to watch.

Chart of the Day

The U.S. economy is in an “industrial recession”. In recent editions of the Dispatch, we’ve told you that major American manufacturers are struggling to make money. For example, sales for global machinery maker Caterpillar (CAT) have declined 35 months in a row. In October, CAT’s global sales dropped by 16%...its worst sales decline since February 2010.

Today’s chart shows the yearly growth in U.S. industrial production. The bars on the chart below indicate recessions. Last month, U.S. industrial production declined -1.17% from the prior year. It marked the 19th time since 1920 that industrial output dropped from a positive reading to a reading of -1.1% or worse.
15 of the last 18 times this happened – or 83% of the time – the U.S. economy went into recession.


The article Is the “Easy Money Era” Over? was originally published at caseyresearch.com.


Get our latest FREE eBook "Understanding Options"....Just Click Here!

Thursday, November 19, 2015

The “Bloodbath” in Canada Is Far From Over

By Justin Spittler

The oil price crash continues to claim victims…and many of them are in Canada.The price of oil hovered around $100 for most of last summer. Today, it’s trading for less than $45. Weak oil prices have pummeled huge oil companies. The SPDR S&P Oil & Gas Exploration & Production ETF (XOP), which tracks the performance of major U.S. oil producers, has declined 36% over the past year. The Market Vectors Oil Services ETF (OIH), which tracks U.S. oil services companies, has declined 30% since last November. Weak oil prices have even pushed entire countries to the brink. Saudi Arabia, which produces more oil than any country in the world, is on track to post its first budget deficit since 2009 this year. If oil prices stay low, the country could burn through its massive $650 million pile of foreign reserves within five years.

Oil’s collapse is also creating big problems for Canada’s economy.....

Canada is the world’s sixth largest oil producer. Oil makes up 25% of its exports. Last month, The Conference Board of Canada said it expects sales for Canada’s energy sector to fall 22% this year. It also expects the industry to record a net loss of about C$2.1 billion ($1.6 billion) in 2015. That’s a drastic change from last year, when the industry booked a C$6 billion ($4.5 billion) profit.

Major oil firms are slashing spending to cope with low prices. Last month, oil giant Royal Dutch Shell plc (RDS.A) said it would stop construction on an 80,000 barrels per day (bpd) project in western Canada. The company had already abandoned another 200,000 bpd project in northern Canada earlier this year. The Canadian Association of Petroleum Producers estimates that Canadian oil and gas companies have laid off 36,000 workers since last summer. Most of these layoffs happened in the province of Alberta.

For the past decade, Alberta was Canada’s fastest growing province.....

Its economy exploded, thanks to the booming market for Canadian tar sands. Tar sand is a gooey sand and oil mixture that melts down with heat from burning natural gas. More than half of Canada’s oil production comes from tar sands. In Alberta, they account for 75% of oil production.

Tar sand is generally more expensive to produce than conventional crude oil. Canadian tar sand projects made sense when oil hovered around $100. But many of these projects can’t make money when oil trades for $45/barrel. Last year, Scotiabank (BNS) said the average breakeven point for new Canadian oil sand projects was around $65/barrel. This is why giant oil companies are walking away from projects they’ve spent years and billions of dollars developing.

All these cancelled oil projects are making Alberta’s economy unravel.....

Alberta lost 63,500 jobs from the start of year through August. It hasn’t lost that many jobs during the first eight months of the year since the Great Recession. The decline in oil production is also draining government resources. Last month, Reuters reported that Alberta was on track to post a $4.6 billion budget deficit this year. Economists say it could be another five years before Alberta runs a budget surplus. The crisis isn’t confined to the oil patches either.

A real estate crisis is unfolding in Calgary.....

Calgary is home to 1.2 million people. It’s the largest city in Alberta and the third largest in Canada. On Tuesday, Bloomberg Business reported that Calgary’s property market is starting to crack:
Vacancy is already at a five-year high in Calgary and rents are the lowest since 2006 after thousands of office jobs were cut. In downtown Calgary, the vacancy rate jumped to 14 percent in the third quarter, the highest since 2010 and compared with 5 percent for downtown Toronto, according to CBRE Group Inc. .... That doesn’t include as much as 2 million square feet of so-called "shadow vacancy" or space leased but sitting empty, which would push vacancy to 16 percent, the most since the mid-1980s.
Demand for office space is falling because of massive layoffs in the oil industry. That’s because oil companies didn’t just lay off roughnecks. They also laid off oil traders and middle managers, which means they need a lot less office space. According to Bloomberg Business, a principal at one Calgary real estate office called the situation “a bloodbath” and said “we’re at the highest point of fear and uncertainty now.”

Casey readers know the time to buy is when there’s blood in the streets.....

But it looks like Calgary’s property crisis is just getting started. Bloomberg Business reports that the city has five new office towers in the works. These projects will add about 3.8 million square feet to Calgary’s office market over the next three years. More office space will only put more pressure on rents and occupancy rates. Real estate developers likely planned these projects because they thought Canada’s oil boom would last. It’s that same thinking that made oil companies invest billions of dollars in projects that can’t make money when oil trades for less than $100/barrel.

Doug Casey saw this coming.....

In September, Doug went to Alberta to assess the damage first-hand. E.B. Tucker, editor of The Casey Report, joined Doug on the trip. Doug and E.B. spoke with the locals. They even tried to buy a Ferrari. They shared their experience in the October issue of The Casey Report.

E.B. went on record saying Canada was in for “a major wakeup call.” He still thinks that’s the case. In fact, he thinks the situation is going to get a lot worse.
When we were in Alberta, we heard over and over again "It'll come right back...it always does." It's not coming back. I expect the situation to get worse. And I see the Canadian dollar going much lower.
When that happens, E.B. thinks Canada’s central bank might do something it’s never done before:
Vacancy rates are rising in Canada’s heartland cities. Jobs in Alberta are disappearing. Unemployment is climbing. And there’s still a global oversupply in oil. None of this bodes well for Canada’s economy. Canada’s economy is in a midair stall. The locals certainly didn’t grasp this when we visited Alberta last month. That's usually the case when things are going from bad to a lot worse. If you’re a central banker in Canada looking at the data, there’s only one decision: print.

E.B. says Canada’s central bank will launch its own quantitative easing (QE) program.....

QE is when a central bank creates money and pumps it into the financial system. It’s basically another term for money printing. Since 2008, the Fed has used QE to inject $3.5 trillion into the U.S. financial system. If the Fed’s experience with QE is any indication, money printing wouldn’t help Canada’s “real” economy much. But it would inflate asset prices. That, in turn, would only make Canada’s economy even more fragile. E.B. is confident the situation in Canada will get worse. And he can’t wait to go back to Canada to collect on bets he made during his last visit:
Doug and I made a lot of side bets with business owners during our visit. One of them promised to sell us a Ferrari if things got worse...that's how sure he was that we were wrong. Looks like we'll be headed back to collect on that one.

You can read all about Doug and E.B.’s visit to Alberta by signing up for a risk free trial of The Casey Report. You’ll even discover how to make money off the oil industry, despite the collapse in the price of oil. Click here to learn more.

The article The “Bloodbath” in Canada Is Far From Over was originally published at caseyresearch.com.


Get our latest FREE eBook "Understanding Options"....Just Click Here!

Friday, October 9, 2015

Mrs. Magoo, Deflation, and Commodity Woes

By Tony Sagami 

Did you read my September 22 issue? Or my July 14 column? If you did, you could have avoided the downdraft that has pulled down stocks all across the transportation sector or even made a bundle, like the 100% gain my Rational Bear subscribers made by buying put options on Seaspan Corporation, the largest container shipping company in the world.


Don’t worry, though. Transportation stocks still have a long ways to fall, so it’s not too late to sell any trucking, shipping, or railroad stock you may own—or profit from their continued fall through shorting, put options, or inverse ETFs. This chart of the Dow Jones Transportation Average validates my negative outlook on all things transportation and shows why we’ve been so successful betting against the “movers” of the US economy.


However, the bear market for transportation stocks is far from finished.

Federal Express Crashes and Burns

Federal Express, which is the single largest weighting of the Dow Jones Transportation Average at 11.6%, delivered a trifecta of misery:
  1. Missed on revenues
     
  2. Missed on earnings
     
  3. Lowered 2016 guidance

I’m not talking about a small miss either. FedEx reported profits of $2.26 per share, well below the $2.46 Wall Street was expecting. Moreover, the company should benefit from having one extra day in the quarter, which makes the results even more disappointing.

What’s the problem?

“Weak industry demand,” according to FedEx. By the way, both Federal Express and United Parcel Service are good barometers of overall consumer spending/confidence, so that should tell you something about the (deteriorating) state of the US economy. Oh, and Federal Express announced that it will increase its rates by an average of 4.9% beginning in January 2015. Yeah, I bet that rate increase will really help with that already weak demand. The decline is even more troublesome when you consider that gasoline/diesel prices have fallen like a rock this year.

Speaking of Falling Commodity Prices

Oil, which dropped by 23% in the third quarter, isn’t the only commodity that’s falling like a rock.
  • Copper prices plunged to a six-year low.
     
  • Aluminum prices have also dropped to a six year low.
  • Coal prices have fallen 40% since the start of 2014.
     
  • Minerals aren’t the only commodities that are dropping. Sugar hit a 7-year low in August.
Commodities across the board are lower; the Thomson Reuters CoreCommodity CRB Index of 19 commodities was down 15% for the quarter and 31% over the last 12 months. Since peaking in 2008, the CRB Index is down 60%.

That’s why anybody and anything associated with the commodity food chain has been a terrible place to invest your money. Just last week:

Connecting the Dots #1: Caterpillar announced that it was going to lay off 4,000 to 5,000 people this year. That number could reach 10,000 by the end of 2016, and the company may close more than 20 plants. Layoffs are nothing new at Caterpillar—the company has reduced its total workforce by 31,000 workers since 2012.


The problem is lousy sales. Caterpillar just told Wall Street to lower its revenues forecast for 2016 by $1 billion. $1 billion!

How bad does the future have to look for a company to suddenly decide that it is going to lose $1 billion in sales? “We are facing a convergence of challenging marketplace conditions in key regions and industry sectors, namely in mining and energy,” said Doug Oberhelman, Caterpillar chairman and CEO.

Like the layoffs, vanishing sales are nothing new. 2015 is the third year in a row of shrinking sales, and 2016 will be the fourth. Caterpillar, by the way, isn’t the only heavy-equipment company in deep trouble.

Connecting the Dots #2: Last week, UK construction machinery firm and Caterpillar competitor JCB announced that it will cut 400 jobs, or 6% of its workforce, because of a massive slowdown in business in Russia, China, and Brazil.


“In the first six months of the year, the market in Russia has dropped by 70%, Brazil by 36%, and China by 47%,”said JCB CEO Graeme Macdonald. Caterpillar, the world’s biggest maker of earthmoving equipment, cut its full-year 2015 forecast in part because of the slowdown in China and Brazil.

Connecting the Dots #3: BHP Billiton announced that it is chopping its capital expenditure budget again to $8.5 billion, a stunning $10 billion below its 2013 peak. Moreover, BHP Billiton currently only has four projects in the works, two of which are almost complete, compared to 18 developments it had going just two years ago.


Overall, the mining industry—according to SNL Metals and Mining—is going to spend $70 billion less in 2015 less than it did in 2012. And in case you think metals prices are going to rebound, consider that the previous bear market for mining lasted from 1997 to 2002, which suggests at least another two years of shrinking budgets and pain.

Repeat After Me!

I have said this many, many times before, but repeat after me.....ZIRP (zero interest rate policy) and QE are DEFLATIONARY!

The reason is that cheap (almost free) money encourages over-investment as well as keeping zombie companies alive that should have gone out of business. Both of those forces are highly deflationary, and unless you think that Mrs. Magoo (Janet Yellen) is going to aggressively start jacking up interest rates, you better adjust your portfolio for years and years and years of deflation.

While the rest of the investment world has been struggling, here at Rational Bear, we’ve been doing just fine.

Here are the results of six recent trades: 38% return from puts on an oil services fund, 16.6% return from an ETF that shorts industry sectors, 200% return from puts on an auction house, 50% return from puts on a jeweler, 50% return from puts on a social media giant and 100% return from puts on a container shipping company.

And we still have more irons in the fire. It’s time to be bearish, so I suggest you give Rational Bear a try—like it or your money back.
Tony Sagami
Tony Sagami

30 year market expert Tony Sagami leads the Yield Shark and Rational Bear advisories at Mauldin Economics. To learn more about Yield Shark and how it helps you maximize dividend income, click here.

To learn more about Rational Bear and how you can use it to benefit from falling stocks and sectors, click here.


Get our latest FREE eBook "Understanding Options"....Just Click Here!


Tuesday, September 8, 2015

Muddling Through Shanghai

By John Mauldin

“He who knows when he can fight and when he cannot, will be victorious.”
– Sun Tzu

A couple of weeks ago I was complaining about 47,000 China reports clogging my email. The number now feels like it is well into six figures (perhaps a slight exaggeration). Maybe my memory is going, but there wasn’t nearly as much China talk on the way up. Funny how that works.

This weeks free webinar "Trading for Income with Risk Protection"....Get your seat HERE!

Is China collapsing? I think parts of China are under severe pressure if not outright recession, and clearly the stock market is a disaster. Anyone who bought Shanghai or Shenzhen stocks on margin this year is probably on the brink.

That said, China itself is not collapsing. There are parts of China that are doing just fine, thank you very much. It does have serious problems, though. The Pollyannas and the Cassandras are both wrong. The change in tone in the Financial Times is quite amusing. Their recent hyperbolic, bearish section called “China Tremors” is a case in point. Of the last 30 articles on China on their website, I found less than a handful that were positive on China. My take? China will muddle through, at least for the near term.

China is in transition, a transition that was clearly telegraphed if you have been paying attention. Our recent book on China (A Great Leap Forward?) clearly laid out this new path. Today we are going to talk about this precarious, difficult transition, which may impose profound impacts on much of the rest of the world. This transition is going to change the way global trade has worked in the past. There will be winners and losers.
But first, a brief comment on today’s employment report and how it impacts the need for a rate hike by the Federal Reserve in September. I offer a little different perspective on the coming decision.

To Hike or Not To Hike – That Is the Question

Today’s unemployment report was lackluster, as has been the case for the initial reporting for the last two Augusts. Both were revised significantly upward – August 2012 was eventually revised up 96,000 jobs, while August 2013 saw a final revision upward of 69,000 jobs, and August 2014 saw a final count of +213,000 jobs. Part of the reason for the major revisions is that only some 70% of the potential survey participants actually responded (hat tip Joan McCullough).

Evidently the United States is becoming like Europe, and we are all going on vacation in August. Or at least the department personnel responsible for handling employment figures are. Expect to see significant upward revisions in the coming months, just as July saw another 30,000 added and June saw a plus 14,000.

This report was not so ugly that it would take the breath away from hawks wanting to raise rates or force doves into agreeing to a rate increase. Nothing changed, really. That is illustrated by the two articles below that were side-by-side on the New York Times website within an hour of the release of the report (hat tip Brent Donnelly). Everybody got to see what they wanted to see.


I can’t remember a time when there was such serious disagreement over what the Federal Reserve should do regarding a rate hike. I have been in several groups of analysts and economists in the last few months, and I must confess to being surprised at the split in opinions.

Upon reflection, I think I can actually understand both positions. First, the Fed keeps reiterating that they are “data dependent” – thus the focus on every little bit of data, no matter how trivial. Let me see if I can explain why both sides can feel they are right and then why, to my way of thinking, they are missing the point.

On the side of those who feel that a rate hike should be postponed at the September meeting, it must be remembered that most rate hikes are in anticipation of an economy beginning to pick up speed. The Fed has said they want to see low unemployment, and under the leadership of Bernanke and now Yellen, they have a 2% inflation target. Remember, their congressional mandate is to promote stable prices and full employment.

While unemployment did drop to 5.1%, that is a “soft” unemployment figure. The participation rate is down. The number of part time workers wanting full time jobs is still high. And the new employment trend is not encouraging.

August's gains were well below trend. The average of the previous five months is 211,000; for the previous six before that it was 282,000. The yearly employment gain, 2.1%, is off 0.2 point from the late 2014/early 2015 rate. The private sector gain is 60,000 below the average of the previous six months. (The Liscio Report)

We are not close to 2% inflation; and, frankly, it doesn’t look like we’re going to get there for a while. The economy is, at best, stuck in a low, Muddle Through gear (as I predicted years ago); and getting back to a stable 3% growth rate, let alone the occasional 4–5% that we used to see, seems out of reach. The dollar is strong and getting stronger and is not only holding down inflation but also, anecdotal evidence suggests, slowing down exports in various sectors of the economy.

There were those who argued that a bubble was developing in the stock market, but it appears the stock market is taking care of itself to make sure it doesn’t become overheated. There is no need to pile on to see if we can drive asset prices even lower. Further, we are just in the beginning of a housing recovery. Why raise mortgage rates, etc., at the beginning?

In such an environment, why would you raise rates in order to keep the economy from overheating? The last thing we seem to be doing is overheating, let alone even getting to a slow boil. Instead, we may already be cooling down. If the economy does start to pick up and inflation becomes an issue, we could raise rates then as fast as we would need to. Or so Kocherlakota and his friends on the FOMC say. And thus we should postpone a rate increase until we see a reason for it. Kind of like, don’t shoot till you see the whites of their eyes.

Those who think we should raise rates likewise have an array of data to support their case. GDP grew 3.7% in the second quarter. If you take out the weather related first quarter 2015 GDP figure, GDP growth is running well over 3%. Given the global headwinds currently buffeting economies, that’s about as good as it’s going to get.

This economy has weathered tax increases and the abrupt changes of Obamacare, as well as a significant drop in capital spending related to oil production and has “kept on ticking.” If there is a recession in our near future, as David Rosenberg points out, it would be the first recession ever that did not see consumer spending or employment go down for the count.

We’ve always been able to find negatives in the unemployment rate. Even if unemployment were somehow to ratchet down to less than 200,000 per month, it will be for only two quarters at the most; and it may be that before the end of the year we will be under 5% unemployment. We just set a record for all measures of corporate profits in absolute terms. We finally set a new record for real disposable personal income in July, again in absolute terms. As Jim Smith says,

What all this means is that when the FOMC meets on September 16 and 17, they will be looking at a US economy in which more people are employed than ever before, earning more money than ever before, producing more goods and services than ever before, and with personal consumption expenditures and corporate profits at the highest levels ever seen. If that is not a prescription for finally raising the Fed Funds rate, then I can't imagine what it would take to get them to move. (source)

Despite the significant slowdown in the oil patch, the level of investment in the second quarter was almost 4% higher than last year. Businesses are optimistic. Even given the turmoil in Canada, China, the Eurozone, and the rest of the BRICS, and even though global trade is beginning to fall off a little bit, the US economy seems to be doing quite well in spite of it all.

What else do you need in order to begin to normalize rates? Inflation is under control and according to most Fed economists seems to be ticking higher. Unemployment is moving lower. The economy is doing quite well. If not now, when? How much better do you want things to get before rates are taken back to something close to normal?

I must confess that I personally lean toward the latter argument, but I have a few additional reasons for thinking the Federal Reserve should act in September. As I have presented in previous letters, there are real reasons to think that low interest rates are not only creating malinvestment but also encouraging companies to use financial engineering and to buy their competition rather than purchasing the tools of production and actually competing head on. These behaviors distort an economy over the long term. They frustrate Schumpeter’s forces of creative destruction.

Further, what policy tools does the Federal Reserve still have available if we enter a recession? I admit that doesn’t seem to be a likely possibility today, but there are many potentials for exogenous shocks to the US economy that could cause a recession. Further, in the history of the United States we have never had a period longer than nine years without a recession. This recovery, relatively weak though it is, is getting long in the tooth. Do we want the Fed to confront the next recession with another round of massive quantitative easing as the only policy tool left to deploy? When their own research shows that QE wasn’t very useful and when we can clearly see the distortions caused by QE in emerging markets around the world?

The Federal Reserve is functionally incapable of not feeling the need to “do something” in the midst of a recession. If the only tool they have is further massive quantitative easing, they will use it. Damn the distortions, full speed ahead!

I would not argue for a rapid rate hike. In fact, I would prefer 1/8 of a point at every meeting, rather than the typical quarter point. But there is no reason not to raise a quarter of a point at this meeting, skip a meeting to make sure everybody can take a deep breath, and then raise once more before the end of the year.

I mean, really? Does the Fed think this economy is so fragile that it can’t take a lousy quarter of a point increase in interest rates? The Federal Reserve needs to begin to restock its policy tool chest now. While I personally think we are a long way from ever seeing 5% Fed funds rates again, a 2% rate can probably easily be absorbed if it comes slowly. And that rate would give the Fed some policy tools when, not if, we enter the next recession.

Now, let’s turn back to China.

Repeat After Me: Chinese Stocks Are Not the Chinese Economy

It’s easy to assume that a country’s stock market reflects the condition of its economy, but that is not always the case. Further, what the stock market really does reflect is the consensus estimate of an economy’s future condition. More specifically, stock prices reveal future expectations for corporate profits.

This generally applies to both the United States and China. One key difference, though, is that most American stocks represent companies that seek to make profits. In China, that isn’t necessarily the case. The Chinese stock market includes many state-owned enterprises (SOEs), whose executives answer to bureaucrats in Beijing. The government views them as public policy tools. Everyone is happy if the SOEs make a profit, but profit is not the first priority.

If US stock prices generally tell us more about the future than the present, except in times of serious over- or undervaluation, then Chinese stock prices tell us even less about either. Just as last year’s incredible run-up in Chinese stocks did not signal an economic boom, the ongoing decline does not signal an economic bust. The correlations aren’t just weak, they are nonexistent. China’s official economic data is also questionable and would be so even if GDP were a precise measurement tool. As we discussed last week, it usually isn’t.

It is no stretch to say we are flying blind about China.

Fortunately, we have diligent researchers like Leland Miller of China Beige Book, whose research firm does the hard work of gathering reliable data each quarter from thousands of companies in China and assembling it in comprehensible form. His data shows that China’s economy has actually been in good shape since China stopped acting Chinese last year. But even then, you have to separate the Chinese economy into several categories.

China Good, China Bad, & China Ugly

Among the many letters and reports on China that I received over the last month, I’d like to single out an excellent research note that the team at Gavekal Dragonomics published last week, called “What to Worry About and What Not to in China.” I appreciated this piece, because it really helped me structure my worrying. I dislike spending energy worrying about the wrong things. Further, worrying about the wrong things can be dangerous. It’s when you are paying attention to the wrong things that what you should have been paying attention to jumps up and bites you on the derrière.

In the spirit of the Gavekal note, here is the good side of China. We’ll get to the bad and the ugly below.
Chinese real estate prices will stabilize. We hear a lot about China’s massive infrastructure boom and the resulting “ghost cities.” These aren’t just rumors. The government mandated the construction of entire cities to house the formerly agrarian population as it shifts to industrial jobs. Provincial governments earned as much as 80% of their revenues from land sales. Essentially, this is a process where they take possession of rural land that has very little value in price terms, declare it to be available for development, and can make profits several orders of magnitude greater than their costs. Nice work if you can get it.

The ghost cities will not stay empty forever. They will fill with people over the next few years (in some cases more than a few). The recent housing bubble is more a function of young people wanting to cram into certain popular areas. The broader internal migration will support housing prices even as the bubble areas pop.

It might be helpful to think of the Chinese ghost cities as analogous to the overbuilt condos in Florida. Prices in Florida did in fact collapse, and places were selling for a fraction of their construction cost. I wrote at the time that I thought they would be very good investments, because the number of people wanting to retire to Florida is actually a fairly steadily growing figure. Low taxes, good weather, positive infrastructure, excellent medical care – what’s not to like, other than it’s not Texas? Just saying…..

To continue reading this article from Thoughts from the Frontline – a free weekly publication by John Mauldin, renowned financial expert, best-selling author, and Chairman of Mauldin Economics – please click here.



Get our latest FREE eBook "Understanding Options"....Just Click Here!