Showing posts with label Trade Triangles. Show all posts

Thursday, August 1, 2013

Unique Trade Triangle signals that tell you when to enter and exit any trade with ease

We’ve all seen the ads for trading tools that promise to double or triple your investment or pick instant winning trades. The thing is, you never really get to see this “amazing” technology without paying tons of money for it.

If these products were so amazing, why wouldn’t they let you try them to decide if they were really worth paying for?

I’d like to introduce you to a new way of doing things, brought to you by my friends at INO.com. They would like to invite you to take a exclusive FREE trial to their service MarketClub in return for your feedback. You’ll have unlimited access to all of the trading tools MarketClub offers for 2 full weeks!

  • Use and backtest the unique Trade Triangle signals that tell you when to enter and exit any trade with ease.
  • Scan over 320,000 stock, futures and forex symbols to find your next trade with Smart Scan.
  • Receive custom market warnings with their Email Alerts.
  • Educate yourself with trading strategies and techniques in our Trade School.
  • Access to many more tools and educational services

There is no payment information required or difficult hoops to jump through. If you have time, all they ask is that you send them feedback so they can keep improving their tools (that’s it!). Once you see the power of the trading tools, you’ll be asking about an extended membership.

You can get started right now, Click here for your exclusive trial to MarketClub


Get our Free Trading Videos, Lessons and eBook today!
 

Saturday, April 14, 2012

It's Finally Here....Access Market Club on Your iPad!


I love my iPhone and my new iPad, but one of my big frustrations with both Apple devices was not being able to look at our very own Trade Triangles and MarketClub charts.
Now for the good news!  That problem has been solved for me with three apps that all work with MarketClub.

Puffin Web Browser:
  It is a cute name, only $2.99, and easily downloadable from the App Store. The Puffin app works just like the Safari browser that is already installed on your iPad and iPhone, but it displays Flash content.  Its creators, CloudMosa Inc., claim it “is a wicked fast web browser and renders the full versions of web pages quickly and reliably.  It also supports Flash with excellent performance on iPads and iPhones.”

 You can start with Puffin Free for a 14-day Trial of the paid Puffin Web Browser.
Personally, I stick with Safari when surfing the web until I see something that is interesting and requires Flash, then I switch to one of the three browsers we are reviewing here today.

Photon Flash Player Browser for iPad:  
According to USA Today, who gives this browser five stars, “Photon browser is a powerful and versatile Safari alternative that excels in its flash support…”  This browser can be used instead of Safari to look at MarketClub charts.  Created by Appsverse Inc., the current cost of this browser is $4.99.
Now here is my current favorite for viewing and drawing on MarketClub charts:

OnLive Desktop Plus:  
This is an awesome app! Not only does put a Windows like desktop on the iPad (now that’s a little freaky!), but it also includes three Microsoft programs:  Word, PowerPoint, and Excel. You get all three programs when you download the app.
  OnLive Desktop Plus is a monthly subscription service, at $4.99 a month.  It offers the best control of our charts and studies. You will be able to draw trendlines, use the Fibonacci tool, and do practically everything you can do on your laptop and desktop machines.  This is my favorite way to access MarketClub on my iPad.
Drop us a comment on your new MarketClub Members Blog and let us know which app you use on your iPad. Now you can have MarketClub on your iPhone and iPad wherever you are, 24/7.
Every success in using MarketClub with your iPad,
Adam Hewison
P.S. Learn more about MarketClub 

Thursday, January 19, 2012

Why it Just Might Be a Good Time to Sit on the Sidelines with Gold

Looking at gold today using our "Trade Triangle Technology" we see a long term downtrend line drawn from the highs of September 5, 2011 and intersecting the November 13th and December 4th highs, continues to be the overriding factor in this market.

That factor along with our negative monthly Trade Triangle continues to act as an inhibitor for this market on the upside. With a Chart Analysis Score of +60, this market is in a trading range.

Long term term traders should be in short positions in gold with appropriate money management stops. Intermediate term traders should be on the sidelines.

Get ready for Fridays trading, check out today's 50 Top Trending Stocks NOW!

Tuesday, December 27, 2011

Sears and the Trade Triangles

Sears Holding Corp (NASDAQ_SHLD) announced today that it will be closing up to 120 stores in its Kmart and Sears chains to focus on the stronger stores. This news made the stock drop more than 19% today at the open. 
Of course MarketClub members were on the right side of this move down well in advance of the news by following the Trade Triangles. The Trade Triangles signaled an entry into a Short position on 12/14/11 @ 51.14. 
With a current price of 36.92 members are sitting on a profit of 14.22 per share (+27.80%).
If you are not using the Trade Triangles become a member today!

Saturday, October 29, 2011

Adam Hewison: Big Moves in all of the Markets! And our weekend video update

Last week we saw the markets have massive gains both on the upside in the case of equities, gold, silver and crude oil. The US dollar came under pressure losing 1.6% on its index.

You have to be impressed with the market action and certainly this is a classic example of markets not following the fundamentals. I think everyone can agree that the fundamentals in Europe are not good and they are not particularly great here in the United States.
A quick look at the changes for last week:

S&P 500 Index: – up a positive 3.78% * Spot Silver:– up double digits with a gain of 12.64% * Spot Gold: – up 6.15% * Crude Oil (December): – up 7.05% * Dollar Index: – down 1.6% * Reuters/Jefferies CRB Index: – up 3.9%

So let’s go look at the charts and see what to expect for this coming trading week and find out how we can create can maintain your wealth in 2011.

SP500 Index
Change for the week: + 3.78%
Monthly Trade Triangles for Long Term Trends = Negative
Weekly Trade Triangles for Intermediate Term Trends = Positive
Daily Trade Triangles for Short Term Trends = Positive
Combined Strength of Trend Score = + 70

Silver
Change for the week: + 12.64%
Monthly Trade Triangles for Long Term Trends = Negative
Weekly Trade Triangles for Intermediate Term Trend = Positive
Daily Trade Triangles for Short Term Trends = Positive
Combined Strength of Trend Score = – 70

Gold
Change for the week: + 6.15%
Monthly Trade Triangles for Long Term Trends = Positive
Weekly Trade Triangles for Intermediate Term Trends = Positive
Daily Trade Triangles for Short Term Trends = Positive
Combined Strength of Trend Score = + 100

Crude Oil
Change for the week: + 7.05%
Monthly Trade Triangles for Long Term Trends = Negative
Weekly Trade Triangles for Intermediate Term Trends = Positive
Daily Trade Triangles for Short Term Trends = Positive
Combined Strength of Trend Score = + 70

U.S. Dollar Index
Change for the week: – 2.72%
Monthly Trade Triangles for Long Term Trends = Positive
Weekly Trade Triangles for Intermediate Term Trends = Negative
Daily Trade Triangles for Short Term Trends = Negative
Combined Strength of Trend Score = – 60

As always, we rely on our market proven Trade Triangle technology for catching the big moves.

Let's check out this weeks video, just click here to see our video with details on the 6 markets we cover publicly.

Sunday, September 18, 2011

For The First Time Ever, a Special MarketClub Introductory Offer......Only $8.95 for the First 30 Days!

Maybe you've seen or heard about trading veteran Adam Hewison's powerful Trade Triangle technology. But unless you are a member of MarketClub, you truly have no idea of the full benefit of these incredible indicators!

Maybe you just haven't wanted to take the leap? Well, then this email is for you. For the first time ever, MarketClub is offering a special introductory offer.......only $8.95 for the first 30 days!

INO.com believes in the profit-making potential of MarketClub so much, they’ve decided to give my readers the first 30 days of full, no limits access to everything MarketClub has to offer for only $8.95.

• Trade Triangles -- that will tell you EXACTLY when to get in and out of the market
• Email Alerts -- that will let you know when a new Trade Triangle occurs OR set one of several other alert options
• Talking Charts -- will tell you what any of our 250,000 symbols are doing, yes, TELL you
• Smart Scan -- will help you quickly find trades that meet 24 different criteria
• Multiple Portfolios -- will allow you to organize ALL of your portfolios and know what is happening in each of them in an instant
• Chart Analysis -- is just like Trend Analysis, but you can get it on any symbol, anytime

...plus much, MUCH more! Sign up for MarketClub now.

Can you afford 30 cents a day?

I don't know about you, but I probably lose more than 30 cents a day on the floorboard of my car and if I had the opportunity, like you do right now, to use some extra pocket change to help me get on the right side of every trade, I wouldn't hesitate.

Try MarketClub right now and I promise you will never look back. Click here sign up now for only $8.95!


P.S. A great thing about joining MarketClub is that it's really like joining a family. They don't play favorites like fat cat brokers who don't even have five minutes to give you on the phone. They treat you the same way whether your account has seven zeros... or just three.

Saturday, September 10, 2011

The Markets Voted and it's No Confidence In Obama

It would appear that President Obama’s speech last night was not well received looking at the financial markets this morning.

Readers of this report know that we rely on our Trade Triangle technology for trends, and not what a government official has to say and this includes the president of the United States. I learned over the years that the markets generally tell you what they’re going to do. Price action alone is the greatest truth you can see in the marketplace. Price action is what determines trends, price action is what determines traders actions.

Many newbie traders think there must be some mystical power that drives the markets. The truth is, the market is driven by people who believe prices are you going to go higher or go lower. It is that simple, however, most investors tend to over think the market.

Now I understand that there are folks out there that would disagree with that statement and say that the fundamentals, i.e. supply and demand, earnings etc. etc. is what drives the markets. Yes, there is a certain truth to that, but the other part of the equation is the psychology of the market. Market sentiment or psyche can really play havoc on the fundamentals and that is why price action alone is the best market analyst in the world.

As we go into this weekend with the 10th anniversary of 9/11 looming over everyone’s head It’s important to look at how the markets are closing for the week.

We consider how a market closes for the week to be very important. Did the market make or lose ground for the week? Which way is the monthly Trade Triangles? Did the market close in the direction of the major trend? All of these thoughts are reflected for the most part in the weekly closing price of any market. That’s why we concentrate and bring to you our weekend updates, which allows you to see the big picture and not the minutia of every tick.

Let's look at the SP 500 price action........

As we have illustrated before the pattern in this market is not a positive one. It would appear as of this writing that the S&P 500 index is going to close lower for the week if it closes at current levels. Last week we closed at 1173.97 and currently were trading at 1162.18. The Trade Triangles longer-term are in a negative mode and we have to believe that this market is going to resume its downward trend before to long. Long-term traders should continue to maintain short positions or be out of the market completely, and in a cash position. Intermediate term traders should be on the sidelines waiting for either a buy, or sell signal based on our Trade Triangle technology.

Monthly Trade Triangles for Long Term Trends = Negative
Weekly Trade Triangles for Intermediate Term Trends = Positive
Daily Trade Triangles for Short Term Trends = Positive
Combined Strength of Trend Score = + 60

Check out todays video that covers all 6 markets that we follow.....


Unlimited access to this and other trading videos FREE! Click Here!

Wednesday, September 7, 2011

Adam Hewison: What A Difference A Day Makes

The song goes like this; “What a difference a day makes....” Gold, sharply lower on heavy profit taking and liquidation. Equities, sharply higher as all the problems in the world are solved. The U.S. dollar has a hiccup. Crude oil up on new demand? All this while the world waits for President Obama’s speech tomorrow evening. Here’s a rhetorical question for you, how many cans can you kick down the road at the same time? Well, if you’re a politician you become pretty adept at kicking as many cans as you want down the road.

The S&P 500 continues to claw its way back from the lows yesterday around the 1140 area. However, the pattern in this market is not a positive one in my estimation. The Trade Triangles are in a longer term negative mode. We have to believe that this market is going to resume its downward trend. Today’s reading of +55 indicate a sideways trading range.

We would use the Williams %R indicator to establish new short positions. Long term traders should continue to maintain short positions or be out of the market completely in a cash position. Intermediate term traders should be on the sidelines waiting for either a buy, or sell signal based on our Trade Triangle technology.

Monthly Trade Triangles for Long Term Trends = Negative
Weekly Trade Triangles for Intermediate Term Trends = Positive
Daily Trade Triangles for Short Term Trends = Negative
Combined Strength of Trend Score = +55


Unlimited access to this and other trading videos FREE! Click Here!

Monday, August 22, 2011

Adam Hewison: Forget The News If You Want To Trade Successfully!

Many news stories, particularly when it comes to the markets, are basically fed to reporters by folks who have a vested interest in that particular market. I’ve seen this happen time and time again, when information is given to an online anchor or someone else who is on air and reading the latest news. The information that they report, may be not accurate. In the competitive rush to get news online, and be the 1st to break a story, very few stories are ever checked and triple checked.

So we wake up this morning with the potential conflict in Libya over, and Libya’s Colonel Qaddafi’s 42 year reign of insanity has maybe come to an end. Based on that news, the Dow rallies up over 200 points. Let’s see, that little conflict cost the US about 1 trillion dollars, money we don’t have. How could that be good for the market?

Now we are tying the news in Libya to the markets here and the terrible economic conditions that exist, it is a stretch by anyone’s imagination. The truth is, that the markets probably rallied based on a short covering. Many active traders went home with short positions over the weekend. When the markets did not follow through to the downside they quickly covered their short positions and pushed the market higher.

So here’s my advice, do not pay too much attention to the news. Let the market, and the price action give you all the direction you need. Market action is the # 1 item to watch to be a successful trader.

Now, let’s go to the 6 major markets we track every day and see how we can create and maintain your wealth in 2011.

S&P 500
Monthly Trade Triangles for Long Term Trends = Negative
Weekly Trade Triangles for Intermediate Term Trends = Negative
Daily Trade Triangles for Short Term Trends = Negative
Combined Strength of Trend Score = – 90

Remember, despite the big call this morning, the major trend is down for the equity markets. Today’s strong rally was probably an opportunity to go short. We see this market going lower.

SILVER
Monthly Trade Triangles for Long Term Trends = Positive
Weekly Trade Triangles for Intermediate Term Trends = Positive
Daily Trade Triangles for Short Term Trends = Positive
Combined Strength of Trend Score = + 100

Our Trade Triangles kicked in perfectly with a buy at 42.20 basis spot. Based on this signal, all traders should be long this market or looking to trade silver from the long side.

GOLD
Monthly Trade Triangles for Long Term Trends = Positive
Weekly Trade Triangles for Intermediate Term Trends = Positive
Daily Trade Triangles for Short Term Trends = Positive
Combined Strength of Trend Score = + 100

Long Term, intermediate and short term traders should hang on for the ride and protect profits with money management stops. It looks more and more likely that we will get close to the magical $2,000 an ounce. We expect to see professional profit taking and some shorting at that level.

CRUDE OIL 
Monthly Trade Triangles for Long Term Trends = Negative
Weekly Trade Triangles for Intermediate Term Trends = Negative
Daily Trade Triangles for Short Term Trends = Negative
Combined Strength of Trend Score = – 90

Despite the knee jerk reaction rally based on the news out of Libya, the trend in crude oil is bearish. Long Term, intermediate and short term traders should hang on for the ride and protect profits with money management stops. The longer term trend for crude oil is down based on our Trade Triangle technology.

DOLLAR INDEX
Monthly Trade Triangles for Long Term Trends = Positive
Weekly Trade Triangles for Intermediate Term Trends = Negative
Daily Trade Triangles for Short Term Trends = Negative
Combined Strength of Trend Score = + 55
This market has remained in a fairly well defined trading range for the last several months. With a Chart Analysis Score of + 55 we would want to approach this market using our Donchian Trading Channels as well as our Williams %R indicator. The index remains below its 200 day moving average, while our longer-term Trade Triangle remains positive.

REUTERS/JEFFERIES CRB COMMODITY INDEX
Monthly Trade Triangles for Long Term Trends = Negative
Weekly Trade Triangles for Intermediate Term Trends = Negative
Daily Trade Triangles for Short Term Trends = Negative
Combined Strength of Trend Score = – 100

While our bias is towards inflation, the index is currently indicating that we are in more of a deflationary scenario. We want to remain patient and let our Trade Triangles signal when this market has made a trend change to the upside. Long Term, intermediate and short term traders should hang on for the ride and protect profits with money management stops.


Unlimited access to this and other trading videos FREE! Click Here!

Tuesday, July 12, 2011

It's Still a "Kick The Can Down The Road" Trading Environment

Last week, the standout story was the disastrous jobs report. As this week unfolds, we are faced with more problems such as the debt ceiling and the total lack of cooperation between the Democrats and the Republicans. It seems as though both parties are firmly entrenched in their own party lines and are failing to see just what it’s doing to the country.

We have talked about this before, and the fact that the politicians both in Europe and here in the United States really don’t want to face the truth has created the current mess over the last 20-30 years. It is always same old story of “kick the can down the road” and let somebody else take care of it.

Well, it’s showtime or should I say it’s a showdown now! We need to get serious about getting this right in this country. I believe that we got into this together and now we should get out of it together.

Now let’s see how we can protect and make your money grow.

S&P 500: +75. The resistance level we discussed all last week was enough to turn this market back down. The symmetry of the S&P is striking and should not be ignored as we could be making a right shoulder of a much larger head and shoulders formation. However, it should not be ignored that the Trade Triangles remain in a positive mode. Look for support to come into this market around the 1300 level.

Silver: +90. Silver reversed course and hit the top of the Donchian trading channel and also moved out of an overbought territory. Our Trade Triangle technology is longer-term trend positive. Intermediate term traders should now be long this market. We still believe that silver is building in major energy base to go higher.

Gold: +65. Like silver, gold is at the top of its Donchian trading channel and this was enough to bring pressure on this market. We continue to believe that gold is building a long term energy field to go much higher later in the year. Long-term trends with the Trade Triangles are positive, while intermediate term trends are neutral.

Crude Oil: -80. Profit-taking and liquidation in the crude oil market is making this market pullback into what could be a very interesting area. A 61.8% Fibonacci retracement brings crude oil to $93.30 for the August contract. We expect that this level should offer sufficient support for this market. Overall the Trade Triangles continue to reflect a negative trend.

The Dollar Index: +70. This index rallied just enough to trigger our intermediate term Trade Triangles, which in turn put us in the neutral camp for this market. The longer term trend for the dollar index is still negative based on our Trade Triangle technology. Resistance remains between 76.35 and support at 74.00.


Share

Tuesday, March 1, 2011

Two Stocks That Appear to be Ready to Rocket Higher

Today Adam Hewison shows us two stocks that have popped up on his radar screen thanks to our Trade Triangle technology.

In this short video you will see exactly how to best use our Trade Triangles and with just a few clicks, you'll be spotting winning trades in minutes.

Some of you may have heard of these two stocks, but the chances are that they have been flying under the radar for the other 99% of traders. The good news is that our Trade Triangle technology is programmed to spot big moves when they begin, not months later after the market has moved and you are kicking yourself for not getting in sooner.

Today's educational video shares with you how to get the most out of the markets in the least amount of time. As always our videos are free to watch and there are no registration requirements. Please feel free to leave a comment about what you think of the video and these two stocks.

Share

Tuesday, February 8, 2011

Precious Metals.....Precious Investments You Won't Want to Miss

Gold, silver & rare earth, which has the strongest trend right now? In today's video we will be looking at the gold market, analyzing the silver market, and finally, checking into the rare earth market.

Before you look at the video, you may want to consider doing this as an exercise: Write down which market has the strongest trend, up or down. Then rate the markets. Number 1....Number 2....Number 3.... Once you see the video it will become clear to you how we rate these markets. It might surprise you.

If you're using MarketClub's "Trade Triangle" technology the answer is simple and you'll discover it in a matter of seconds. If you haven't used our "Trade Triangle" technology, this will be a good exercise for you to look and see just how powerful this technology is and how it can help your trading.

We all know that gold has had a big move, but so have silver and rare earth stocks. So what's next? We hope this video helps outline some ideas that you can put to good use in the future.

As always our videos are free to watch and there are no registration requirements. All we ask in return is that you Tweet about us and share this video with your friends. Also, please feel free to leave a comment and let us know what you are thinking. Enjoy the video and every success in trading,

Watch "Precious Metals.....Precious investments You Won't Want to Miss"


Share

Tuesday, February 1, 2011

Why is Gold Not Going Higher With All of The Turmoil in Egypt?

Despite all the turmoil in Egypt and the Arab world, gold has stubbornly refused to rally. This probably causes great concern amongst the gold bugs and the folks who are bullish on gold. As we have mentioned before many times "perception is more powerful than fundamentals."

While the gold bugs argue that the market is being manipulated, we are more realistic and respect what the market is actually doing. The big question on everyone's mind is: Why are food prices and other commodity markets soaring, while gold is dismally staying down in the $1,330 area?

MarketClub's Trade Triangles are all Red, meaning that the trend for gold is likely to remain negative or at best move in a sideways fashion. Our best estimation at this point in time is that we are going to see more sideways action and probably some recovery from current levels. However, we would like to see some concrete evidence that the market has actually put in a low and that we will see a recovery in this yellow metal in the future.

Although historically our monthly RED Trade Triangles have not been successful in gold. You would have been more successful fading the RED monthly Trade Triangle signal and going long gold.

Before getting, "gung ho" on this approach, you will be better off waiting for a green weekly trade triangle to kick in which would indicate that the market has probably made a low. That is the main reason why, we recommend using the weekly Trade Triangles for trend, and daily Trade Triangle's for timing.

In this short video, we explain what we mean and show you concrete examples of how you can use this strategy to make money. As always our videos are free to watch and there is no registration requirements. Our only request is that you tell your friends, Tweet and Facebook about this article and the video. We would also enjoy hearing from you, so please feel free to leave a comment and tell us where you think gold is headed.

Share

Sunday, January 30, 2011

Amazon Plunges And Trade Triangles Save The Day

Amazon shares fall 9.5% and the company’s founder reduces his holdings.

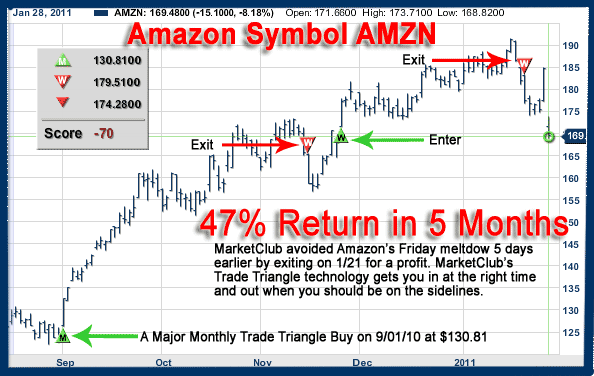
Amazon.com (AMZN), which posted its quarterly earnings on Friday, disappointed many investors with slipping margins. The market reacted quite dramatically with shares of Amazon skidding downhill for a loss of 9.5%. MarketClub members did not have to sit through this downturn as we exited Amazon on January 21st, some five days before the report. How did we know the report was going to bad? The truth is we didn’t know, but our “Trade Triangle” technology recognized that something was amiss and alerted members who follow Amazon to exit pronto.


As the graph will show, we have had two trades since September 1st of last year and in both of these trades we were successful, giving us gains of $36.85 a share. Our long term indicator continues to be positive on Amazon, but for now intermediate term traders should be on the sidelines counting their money and waiting for a better opportunity to re-enter this stock.

Another worrying concern is what Bank of America/Merrill Lynch said today, “Owning the stock here requires trust and patience. We have seen Amazon go through investment cycles before and believe investment in growth is the right long term strategy for the Internet.”
Not exactly a ringing endorsement in my opinion.

Well, forget trust and patience. We prefer to trust our “Trade Triangle” technology as it has consistently proven to be successful. Our “Trade Triangles” produced just 2 trades in Amazon since 9/1/10. Producing a very respectable 47% return in just five months. If you’re not already a MarketClub member, you should seriously look into our “Trade Triangle” technology. It will help get you into the markets at the right time and out before everything starts to slide.

You can learn more about MarketClub by clicking here and signing up for a 30 day risk free trial.


Share

Tuesday, June 29, 2010

New Video: Is Amazon Losing It?

In today's short video we look at Amazon, not the river, but the stock. Yesterday (6/28/10) we spotted some market action that we wanted to bring to your attention. Unfortunately, we could not release this video any sooner because of scheduling.

Amazon is in a whole lot of trouble in my opinion. Not only are our "Trade Triangles" negative, but also an important technical element for Amazon was breached. This one element is one of the simplest, yet most powerful technical tools you can use in trading.

We think you'll enjoy this very simple approach as it has worked consistently over the years. As always our videos are free to watch and there are no registration requirements.


Watch Is Amazon Losing It?


Share

Tuesday, June 15, 2010

New Video: The Talk Of The Day Is Crude Oil

Whether it is the spill in the Gulf, which continues unabated, or talk on Capitol Hill, the subject is crude oil. Today we received a signal by way of our weekly "Trade Triangle" to get long crude oil.

In this new brief video, we show you the exact levels to keep your eye on and also where a logical stop would go for this position. We have had a lot of questions on Fibonacci retracements lately and this video goes into detail about that phenomenon and how you can best use it.

As always our videos are free to watch and there are no registration requirements. We are always interested in your views so please leave us a comment and let us know what you think about the direction of crude oil.

Watch "The Talk Of The Day Is Crude Oil"


Share

Monday, March 8, 2010

Gold Alert


Daily "Trade Triangles" flash short term exit signal today at $1,126.60 in basis spot gold.

Just Click Here to find out more about the Stock Market Club's "MarketClub Trade Triangle Technology"


Share

Monday, September 14, 2009

MarketClub Alerts in Action and Explained


Just in case you’ve been waiting to see what MarketClub is all about, here is another reason why I’m you need to take the time to look at the notification tool titled Alerts. This email alert system gives you the ability to stay on top of the Trade Triangles as well as 18 other breakout patterns! We just produced this video that digs deep into the Alerts as only someone on the inside could.

Just Click Here to watch the video, it will cost you nothing!

Please feel free to leave a comment and let us know what you think of the potential of Market Club.

Thursday, September 3, 2009

Is This the Move in Gold we Have Been Waiting For?


We believe the action in gold Wednesday should be looked at seriously as it pushes the gold market to its best level in almost 3 months.

In our new video, we show you what we think is going to happen to this market in the near term and the long term. I also discuss energy fields as they pertain to gold, and where our Trade Triangles are positioned in the yellow metal.

There is no need to register for this video and of course you can watch it with my compliments. We highly recommend watching this video today otherwise you risk missing out on what could be the move of the year.

Wednesday, July 29, 2009

New Video: What Happened to the Gold Market?


I think it came as a big surprise to many traders that the gold market imploded on Tuesday pushing to its lowest levels in several days.

The downward spiral was enough to trigger a daily “Trade Triangle” which moved us into the neutral camp on this market. Exiting our long gold position based on our “Trade Triangle” signals produced a very small profit or in some cases of break even trade.

So the question is: Is the sharp downward move in gold over?

In our new video we answer that question and share with you some levels we think gold will go to on the downside. We also share with you that we could be setting up for an excellent buying opportunity, if and when our “Trade Triangles” are aligned.

Before you trade gold watch the video and please leave a comment letting us know where you think gold is headed.