One of the biggest movers over the past few months has been the recovery of the Oil/Gas/Energy sector after quite a bit of sideways/lower price trending. You can see from this XOP chart, below, a 44% upside price rally has taken place since early November, and XOP has recently rotated moderately downward – setting up another potential trade setup if this rally continues. Traders know, the trend if your friend. Another upside price swing in the XOP, above $72, would suggest this rally mode is continuing.
Recently, we published a research article suggesting a lower U.S. Dollar would prompt major sector rotations in the US and global markets where we highlighted the fact that the Materials, Industrials, Technology, and Discretionary sectors had been the hottest sectors of the past 180 days, but the Energy, Financials, Materials, and Industrials had shown the best strength over the past 90 days....Read More Here.
Showing posts with label Technology. Show all posts
Tuesday, January 26, 2021
Tuesday, May 14, 2019
How Chinese Trade Issues Will Drive Market Trends
It is becoming evident that the US/Chinese trade issues are going to become a point of contention for the markets going forward. We’ve been review as much news as possible in an attempt to build a consensus for the future of the U.S. markets and global markets. As of last week, it appears any potential trade deal with China has reset back to square one. The news we are reading suggests that China wants to reset their commitments with the US, remove all tariffs and wants the US to commit to buying certain levels of Chinese goods in the future. Additionally, China has yet to commit to stopping the IP/Technology theft from U.S. companies – which is a very big contention for the US.
This suggests the past 6+ months of trade talks have completely broken down and that this trade issue will likely become a market driver over the next 12+ months. The global markets had anticipated a deal to be reached by the end of March 2019. At that time, Trump announced that he was extending talks with China without installing any new tariffs. The intent was to show commitment with China to reach a deal at that time – quickly.
It appears that China had different plans – the intention to delay and ignore U.S. requests. It is very likely that China has worked to secure some type of “plan B” type of scenario over the past 6+ months and they may feel they are negotiating from a position of power at this time. Our assumption is that both the U.S. and China feel their interests are best served by holding their cards close to their chests while pushing the other side to breakdown through prolonged negotiations.
Our observations are that an economic shift is continuing to take place throughout the globe that may see these US/China trade issues become the forefront issue over the next 12 to 24 months – possibly lasting well past the November 2020 US Presidential election cycle. It seems obvious that China is digging in for a prolonged negotiation process while attempting to hold off another round of tariffs from the US. Additionally, China is dealing with an internal process of trying to shift away from “shadow banking” to eliminate the risks associated with unreported corporate and private debt issues.
The limited, yet still valid, resources we have from within China are suggesting that layoffs are very common right now and that companies are not hiring as they were just a few months ago. One of our friends/sources suggested the company he worked for has been laying off employees for over 30 days now and he just found out he was laid off last week. He works in the financial field.
We believe the long term complications resulting from a prolonged U.S./China trade war may create a foundational shift within the global markets over the next 16 to 24+ months headed into the November 2020 U.S. Elections. We’ve already authored articles about how the prior 24 months headed into major U.S. elections tend to be filled with price rotation while an initial downside price move is common within about 16+ months of a major US election event. This year may turn out to prompt an even bigger price rotation.
U.S. Stock Market volatility just spiked to levels well above 20 – levels not seen since October/November 2018, when the markets fell nearly 20% before the end of 2018. The potential for increased price volatility over the next 12+ months seems rather high with all of the foreign positioning and expectations that are milling around. It seems like the next 16+ months could be filled with incredibly high volatility, price rotation and opportunity for skilled traders.
Our primary concern is that the continued trade war between the U.S. and China spills over into other global markets as a constricted price range based trading environment. Most of the rest of the world is still trying to spark some increased levels of economic growth after the 2008-09 market crisis. The current market environment does not settle well for investor confidence, growth, and future success. The combination of a highly contested U.S. Presidential election, US/China trade issues, a struggling general foreign market, currency fluctuations attempting to mitigate capital risks and other issues, it seems the global stock markets are poised for a very big increase in volatility and price rotation over the next 2 years or so.
Our first focus is on the Hang Seng Index. This Weekly chart shows just how dramatic the current price rotation has been over the past few weeks and how a defined price channel could be setting up in the HSI to prompt a much larger downside objective. Should continue trade issues persist and should China, through the course of negotiating with the U.S., expose any element of risk perceived by the rest of the world, the potential for further price contraction is very real. China is walking a very fine line right now as Trump is pushing issues (trade issues and IP/Technology issues) to the forefront of the trade negotiations. In our opinion, the very last thing China wants is their dirty laundry, shady deals and political leadership strewn across the global news cycles over the next 24+ months.
The DAX Weekly Index is showing a similar price pattern. A very clear upper price trend channel which translates into a very clear downside price objective is price continues lower. Although the DAX is not related directly to the US/China trade negotiations, the global markets are far more interconnected now than ever before. Any rotation lower in China will likely result in a moderate price decrease in many of the major global market indexes.
As we’ve suggested within our earlier research posts, U.S. election cycles tend to prompt massive price rotations when the election cycles are intense. In our next post PART II of this report, we talk about what happened in the past election cycles reviewing the monthly charts and weekly SP500 index charts which are very telling in what could be about to happen next for the stock market from an investors standpoint.
For active swing traders, you are going to love our daily trading analysis. On May 1st we talked about the old saying goes, “Sell in May and Go Away!” and that is exactly what is happening now right on queue. In fact, we closed out our SDS position on Thursday for a quick 3.9% profit and our other new trade started Thursday is up 18% already.
Second, my birthday is only three days away and I think it's time I open the doors for a once a year opportunity for everyone to get a gift that could have some considerable value in the future.
Right now I am going to give away and shipping out silver rounds to anyone who buys a 1-year, or 2-year subscription to my Wealth Trading Newsletter. I only have 7 left as they are going fast so be sure to upgrade your membership to a longer term subscription or if you are new, join one of these two plans, and you will receive:
Chris Vermeulen
Stay tuned for PART II next!

This suggests the past 6+ months of trade talks have completely broken down and that this trade issue will likely become a market driver over the next 12+ months. The global markets had anticipated a deal to be reached by the end of March 2019. At that time, Trump announced that he was extending talks with China without installing any new tariffs. The intent was to show commitment with China to reach a deal at that time – quickly.
It appears that China had different plans – the intention to delay and ignore U.S. requests. It is very likely that China has worked to secure some type of “plan B” type of scenario over the past 6+ months and they may feel they are negotiating from a position of power at this time. Our assumption is that both the U.S. and China feel their interests are best served by holding their cards close to their chests while pushing the other side to breakdown through prolonged negotiations.
Our observations are that an economic shift is continuing to take place throughout the globe that may see these US/China trade issues become the forefront issue over the next 12 to 24 months – possibly lasting well past the November 2020 US Presidential election cycle. It seems obvious that China is digging in for a prolonged negotiation process while attempting to hold off another round of tariffs from the US. Additionally, China is dealing with an internal process of trying to shift away from “shadow banking” to eliminate the risks associated with unreported corporate and private debt issues.
The limited, yet still valid, resources we have from within China are suggesting that layoffs are very common right now and that companies are not hiring as they were just a few months ago. One of our friends/sources suggested the company he worked for has been laying off employees for over 30 days now and he just found out he was laid off last week. He works in the financial field.
We believe the long term complications resulting from a prolonged U.S./China trade war may create a foundational shift within the global markets over the next 16 to 24+ months headed into the November 2020 U.S. Elections. We’ve already authored articles about how the prior 24 months headed into major U.S. elections tend to be filled with price rotation while an initial downside price move is common within about 16+ months of a major US election event. This year may turn out to prompt an even bigger price rotation.
U.S. Stock Market volatility just spiked to levels well above 20 – levels not seen since October/November 2018, when the markets fell nearly 20% before the end of 2018. The potential for increased price volatility over the next 12+ months seems rather high with all of the foreign positioning and expectations that are milling around. It seems like the next 16+ months could be filled with incredibly high volatility, price rotation and opportunity for skilled traders.
Our primary concern is that the continued trade war between the U.S. and China spills over into other global markets as a constricted price range based trading environment. Most of the rest of the world is still trying to spark some increased levels of economic growth after the 2008-09 market crisis. The current market environment does not settle well for investor confidence, growth, and future success. The combination of a highly contested U.S. Presidential election, US/China trade issues, a struggling general foreign market, currency fluctuations attempting to mitigate capital risks and other issues, it seems the global stock markets are poised for a very big increase in volatility and price rotation over the next 2 years or so.
Our first focus is on the Hang Seng Index. This Weekly chart shows just how dramatic the current price rotation has been over the past few weeks and how a defined price channel could be setting up in the HSI to prompt a much larger downside objective. Should continue trade issues persist and should China, through the course of negotiating with the U.S., expose any element of risk perceived by the rest of the world, the potential for further price contraction is very real. China is walking a very fine line right now as Trump is pushing issues (trade issues and IP/Technology issues) to the forefront of the trade negotiations. In our opinion, the very last thing China wants is their dirty laundry, shady deals and political leadership strewn across the global news cycles over the next 24+ months.
The DAX Weekly Index is showing a similar price pattern. A very clear upper price trend channel which translates into a very clear downside price objective is price continues lower. Although the DAX is not related directly to the US/China trade negotiations, the global markets are far more interconnected now than ever before. Any rotation lower in China will likely result in a moderate price decrease in many of the major global market indexes.
As we’ve suggested within our earlier research posts, U.S. election cycles tend to prompt massive price rotations when the election cycles are intense. In our next post PART II of this report, we talk about what happened in the past election cycles reviewing the monthly charts and weekly SP500 index charts which are very telling in what could be about to happen next for the stock market from an investors standpoint.
For active swing traders, you are going to love our daily trading analysis. On May 1st we talked about the old saying goes, “Sell in May and Go Away!” and that is exactly what is happening now right on queue. In fact, we closed out our SDS position on Thursday for a quick 3.9% profit and our other new trade started Thursday is up 18% already.
Second, my birthday is only three days away and I think it's time I open the doors for a once a year opportunity for everyone to get a gift that could have some considerable value in the future.
Right now I am going to give away and shipping out silver rounds to anyone who buys a 1-year, or 2-year subscription to my Wealth Trading Newsletter. I only have 7 left as they are going fast so be sure to upgrade your membership to a longer term subscription or if you are new, join one of these two plans, and you will receive:
One Year Subscription Gets One 1oz Silver Round FREE
(Could be worth hundreds of dollars)
Two Year Subscription Gets TWO 1oz Silver Rounds FREE
(Could be worth a lot in the future)
I only have 13 more silver rounds I’m giving away
so upgrade or join now before it's too late!
Happy May Everyone!
Stay tuned for PART II next!
Labels:
china,
Chris Vermeulen,
crisis,
CYB,
Hang Seng Index,
SDS,
stocks,
Technology,
trade,
Trump,
US,
Volatility
Wednesday, June 20, 2018
Are the Global Markets Shifting Away from U.S. Price Correlation?
Well over a month ago we warned our followers of a “capital market shift” that was taking place in the global markets. Nearly 3 months before that time, we warned that China’s economy was about to enter a sustained economic down trend cycle that could be dangerous to the global markets. Today, we offer further evidence that the global markets are, in fact, shifting away from a price correlation to the U.S. stock market and this move could be a warning sign that emerging markets and global markets could lead the world into an extended stagflation cycle.
Think about this for a minute, as we briefly discussed in our last article, what would happen if the U.S. markets continued to rally on a strong economy with strong consumer participation while the U.S. Fed was slow to raise interest rates while supporting a transitional shift of the US economy towards more manufacturing, technology, and expectations? How would the world’s economies react to such a shift given their current economic cycles and opportunities? Would they be able to keep up with the U.S. or would they start to trail further and further behind the U.S.?
It is our belief that any continued strengthening of the U.S. economy could, in fact, present real dangers for many of the world’s economies simply because they may fall completely out of sync with the U.S. stock market as their currencies, economies and consumer expectations fail to keep up with the U.S. capabilities. How all of this will play out over the next few months/years is our concern. We know it will result in some tremendous trading opportunities for investors, but it could also create a new class of undervalued assets that could present some real long term opportunity over the next 20+ years.
Let’s start by taking a look at our China/Asia custom index to show how the past 60+ days have more clearly shown this price disconnect happening. When you look at this chart, pay attention to how closely this custom index (the candles) have moved in relation to the SPY (the blue area chart overlaid onto the candles). Notice how the moves in the SPY were relatively closely mirrored by the custom index. This is a direct price correlation to the SPY over an extended period of time.
Now, focus on the last 6 - 9 bars on this chart and take a really close look at how the SPY has rallied higher while this custom index has stayed flat to lower over the same time frame. The only answer for this type of price disconnect is that a global capital shift could be underway that is driving capital out of certain markets and away from risk and danger. In other words, it is our opinion that the China/Asia markets are starting to be perceived as riskier and more dangerous in relation to the U.S. market and other more mature markets.
Now, let’s take a look at the BRICS custom index. YIKES!! What happened here? Through most of 2017, a price correlation can be seen where the BRICS index moved somewhat in unison with the SPY price activity – although in some cases a bit delayed. Yet, after March 2018, something dramatic happened. When the SPY rotated lower in late March 2018, the BRICS index stayed relatively flat near the highs. Then in May 2018, a price disconnect became very evident as the SPY began to rally while the BRICS index began to sell off – very dramatically. The BRICS index also broke through the BLUE price channel recently which is another sign that price trends/activities have shifted.
You should now be starting to see what we have been warning you about for months – the global capital market shift that is taking place. This is happening because mature nations and economies are capable of achieving great economic growth and stability than many foreign markets and because many foreign markets have squandered the last 10+ years attempting to expand externally and not support their fundamental economic needs. As we have used this example before, a flower only has two modes of operation – flower mode (expand) or survive (keep the core plant alive). We believe these foreign markets have been in “flower mode” for the past 10+ years and have failed to support the core elements of their economies.
Now, onto more examples, this time Western Europe. Again, this custom index is weighted with the SPY, so it should reflect some of the price support of the recent uptrend. Yet, we see the most recent few weeks of this chart have shown a dramatic downtrend? This would indicate that the European markets/currencies are disconnecting from the US majors at a much more dramatic pace, recently, that they have been over the past few years. Yikes!
What about India & SE Asia? Our custom India index has shown relatively FLAT recent price activity compared to the SPY. Overall, our opinion is that India has yet to completely diverge from the U.S. majors and we urge all investors to be aware that any further price breakdown in this India custom index will warn that the Indian/SE Asian economies are losing their battle to stay correlated to the U.S. markets going forward. Right now, there is evidence of weakness in the India custom index – yet there are limited signs of a broken correlation to the U.S. markets. It certainly shows that this price disconnect could be happening and likely is happening – yet we don’t have clear signs that this custom index is breaking to new lows (yet).
Lastly, let's take a look at our Russia/Eastern Europe custom index for signs of a price disconnect. This chart is somewhat similar to the India chart (above). There are signs of weakness and downside price rotation while the SPY has been rallying, yet there is not massive disconnect evident on the right edge of the chart. We believe the recent downside price rotation within this custom index are the early warning signs of a price disconnect in the early stages of setting up (just like in the India chart). We believe these charts clearly show that the US market (and other mature economies) are advancing beyond the functional capabilities of many emerging and foreign markets. What will come from this, if it continues to play out as we expect, is a huge number of opportunities for traders and investors.
The next 3 to 5 years are likely to be very interesting and exciting for traders and investors. These types of moves don’t happen too often and should these markets continue to rotate as we are expecting, we could see some very big currency and foreign market moves over the next few months and years. You owe it to yourself to stay ahead of this move and learn how to profits from the extended volatility that will likely result from this price disconnect.
We believe we have nailed this analysis as we have correctly called the weakness in China/Asia as well as the global capital shift that is starting to play out in the global markets. We already know what will likely move and when we should expect these opportunities to set up. We are preparing our valued subscribers for this move and protecting them by providing them even more detailed research and analysis than you are seeing here.
Visit The Technical Traders to learn how this could be the biggest opportunity of your trading and investing life and how you need a qualified and dedicated team of researchers to help you stay ahead of these moves over the next 2+ years with our long term discounted subscription plan and Save 39%. There will come a time when you will be wishing you had access to our proprietary research and member only trade alerts and investment positions. Become a technical trader today [just visit here] and prosper with us!
Chris Vermeulen
Technical Traders Ltd.
Labels:
Asia,
china,
currencies,
economic,
Fed,
Gas,
long term,
Oil,
SPY,
Technology,
The Technical Traders
Friday, December 1, 2017
Capital Repositioning Driving Volatility Higher
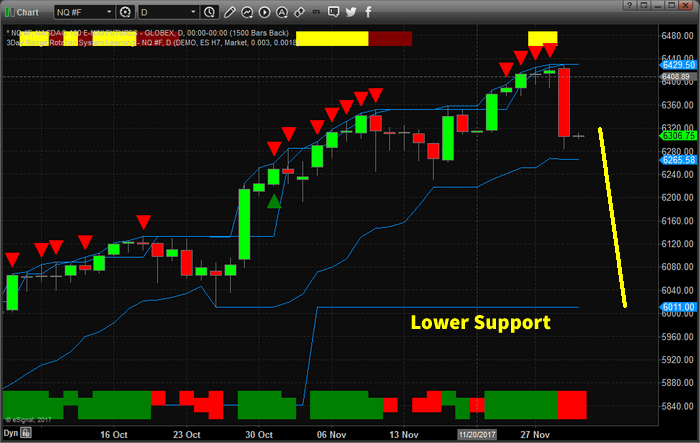
Recent moves in the FANG stocks shows that capital is starting to reposition within the global market. As the end of the year approaches, expect more of this type of capital control to drive greater volatility within the markets. At this time of year, especially after such a fantastic bullish run, it is not uncommon to see capital move out of high flying equities and into cash or other investments.
The recent move lower in the NQ has taken many by surprise, but the bullish run in the FANG stocks has been tremendous. Facebook was higher +59% for 2017 (600% 2016 levels). Amazon was up +61% for 2017 (550% 2016 levels). Netflix was up +64.75% for 2017 (600% 2016 levels) and Google was higher by +37% for 2017 (1000% 2016 levels). These are huge increases in capital valuation.
In early 2017, we authored an article about how capital works and always seeks out the best returns in any environment. It was obvious from the moves this year that capital rushed into the US markets with the President Trump’s win and is now concerned that the end of the year may be cause to pull away from the current environment.
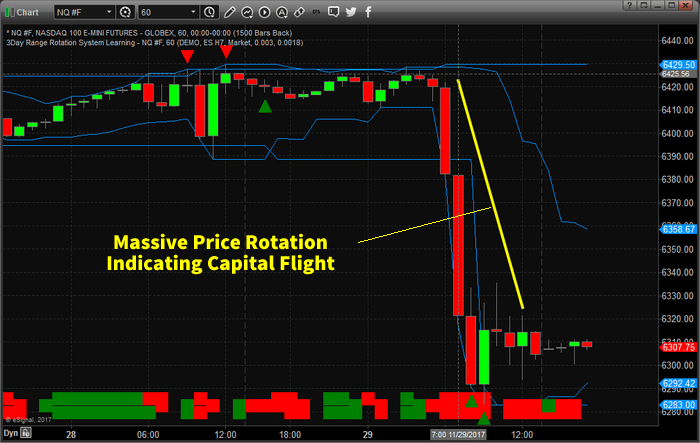
The current decline in the NQ, -2.25% so far, is not a huge decline in price yet. Lower price support is found near the $6000 level. Should this “Price Flight” continue in the NASDAQ, we could be looking at a 6~8% decline, or greater, going into the end of this year.

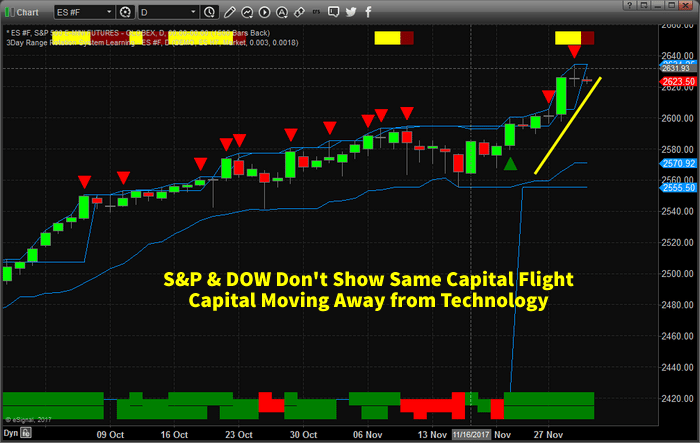
The price swing, this week, was very fast and aggressive. In terms of capital, this was a massive price rotation away from Technology. While the S&P and DOW Industrials continue higher, this presents a cause for concern with regards to the end of year expectations.

Will capital continue to rush into the US markets and specifically Technology stocks? Or will capital rush out of these equities and into other sources of “safety” as technology melts down into the end of 2017? Has the 40~60%+ price rally of 2017 been enough for investors to take their profits and run?

It is quite possible that capital will move to the sidelines through the end of this year and reenter the markets early next year as investors find a better footing for the markets. The facts are, currently, that financials and transportation seem to be doing much better than the FANG stocks. If this continues, we could be looking at a broader shift in the global markets – almost like a second technology bubble burst.
If you want to learn more about how we can assist you with your investment needs, visit The Technical Traders Here to learn more. Our researchers are dedicated to assisting you and in helping you learn to profit from these moves. 2018 is certain to be a dynamic trading year – so don’t miss out.
Labels:
Amazon,
Bullish,
capital,
equities,
Gas,
investment,
NASDAQ,
Oil,
President Trump,
profit,
Technology,
trading
Tuesday, April 16, 2013
The Gold Meltdown – What Happened?
In today’s Trade School video, we’re going to be looking into what caused the recent meltdown in gold prices. How could gold drop so precipitously in such a short time, given what’s going on in the world? Did it have anything to do with the ETF GLD or was a country forced to sell its precious metals to satisfy creditors?
We will share with you how you could have systematically made money in gold using our Trade Triangle technology, which has produced some very positive results over the years.
Since 1975, there have been 13 bear markets with an average drop around 14%. This would put gold below the $1,300 level, around $1,280.
In this short 4 minute video on gold, we will illustrate the importance of having a solid game plan and a market proven approach. We will go through each trade in gold and share with you the results of using our Trade Triangle approach from the beginning of the year.
This approach is not for everyone, but we think you will agree that the results certainly speak for themselves.
For more information on the tools we use in this video just click here to > visit The MarketClub
Labels:
bear,
GLD,
Gold,
MarketClub,
Markets,
Technology,
Trade Triangle
Tuesday, March 1, 2011
Two Stocks That Appear to be Ready to Rocket Higher
Today Adam Hewison shows us two stocks that have popped up on his radar screen thanks to our Trade Triangle technology.
In this short video you will see exactly how to best use our Trade Triangles and with just a few clicks, you'll be spotting winning trades in minutes.
Some of you may have heard of these two stocks, but the chances are that they have been flying under the radar for the other 99% of traders. The good news is that our Trade Triangle technology is programmed to spot big moves when they begin, not months later after the market has moved and you are kicking yourself for not getting in sooner.
Today's educational video shares with you how to get the most out of the markets in the least amount of time. As always our videos are free to watch and there are no registration requirements. Please feel free to leave a comment about what you think of the video and these two stocks.
Share
Labels:
Adam Hewison,
stocks,
Technology,
Trade Triangles,
video
Tuesday, February 2, 2010
New Video: Crude Oil…What Does the Chart Say?

It appears as though crude oil has an amazing cyclic quality that can be timed quite accurately with MarketClub’s “Triangle” technology. In this new short video, I showcase this cycle and how you can take advantage of it.
Just click here to watch the new video and as always our videos are free to watch and there are no registration requirements. All we ask for is that you comment on this video if you find it interesting and informative.
Enjoy the video and let us know what you think.
Crude Oil....What Does the Chart Say?
Share
Labels:
Crude Oil,
MarketClub,
Technology,
Trade Triangle,
video
Wednesday, August 26, 2009
Imagine Not Having Access to Any Financial News

Could you imagine not having access to any kind of financial news stories. The only information you have about the market is the market itself.
Would you be a better trader or a less successful trader?
I think you would be a better trader. I have often said that the market is the best news provider in the world. It’s up to the minute and it reflects both domestic and international issues. The success of our “Trade Triangle” technology is based upon market action.
In our new short video, we’ll take a big look at the S&P 500 market and where we expect it will head in the months to come.
We all need to be prepared for what lies ahead, and this video is worth watching for that very reason.
Labels:
financial,
Technology,
Trade Triangle,
trader,
video
Wednesday, July 22, 2009
New Video......Apple’s Earnings

Apple has been on an upward trend for most of the year based on some very solid products that it has brought to market.
In today’s video we will be examining, with the help of our “Trade Triangle” Technology, how we see the future of Apple’s stock value.
Just Click Here To Watch The Video
You can watch this video with our compliments and there is no registration requirements. We would love to get your feedback about this video so please feel free to leave a comment here on our blog.
Wednesday, July 1, 2009
New Video: S&P 500 Update

How are you trading the S&P 500 right now? In this new video you will get a chance to see how the Market Club technology works and see just exactly how we are trading this market. As always, the video is free with no registration.
Please feel free to leave a comment to let us know what you think of the video and how you are trading the SP 500 right now.
Just Click Here To Watch The Video
Labels:
inventories,
Market Club,
SP 500,
Stochastics,
Technology
Subscribe to:
Posts (Atom)