Showing posts with label SP 500. Show all posts

Sunday, December 28, 2014

Gold Still In Bear Cycle?

Well, not a merry Christmas for Gold buyers just yet. We have said in our TMTF forecast service to watch 1190 as KEY support and 1241 would also need to be taken out on a closing basis before we could confirm a new uptrend in Gold and the end to the 5 wave bear cycle. Not quite yet, and in fact in my stock service we have avoided Gold stocks entirely even with the recent temptations to get long because Gold to us is key.

If we are not over 1241 then we are not buyers of Gold equities, plain and simple. With 5000 stocks to choose from, why not stick with the sectors that are in the stronger uptrends and avoid those mired in the mud like Gold? For example you could be looking at Security stocks given all the cyber attacks worldwide that are only getting worse. Gold is money as we all know, but a downtrend is a downtrend. Trust what you see, not what you think for best results.

So right now the problem is we just gave up the 1190 support and the 30 week MA line on the weekly chart is your guide for key resistance to take out. We remain in the sidelines until its taken out. The chart below shows the blue line with the 30 week Moving average resistance, and you can use this same chart for the uptrend in the SP 500 which we have used recently for our subscribers as well. Don’t suffer from history bias and the hay days of Gold stocks and Gold, which ended in 2011…wait for the next Hay days to arrive, watch the 30 week moving average line before acting.

tmtf gold 1223

The SP 500 meanwhile is in wave 3 up from 1973 38% shallow wave 2 lows. That was a quick correction and the waves now are likely to be faster and shorter as we are in Primary wave 5 of this bull cycle, the last stages of the Bull if I’m right. 2131-2138 is your bogey ahead for first Fibonacci pivot resistance on the way to the 2181 target I had out over a month or so ago.

Join us with a 33% holiday discount at Market Trend Forecast

The Gold ETF Trader


Get out latest FREE eBooK "Understanding Options"....Just Click Here


Wednesday, October 1, 2014

Everything You Need to Know About the SP 500 Until Christmas

By Andrey Dashkov

When I need to clear my mind, I put on my beat up Saucony sneakers and drive to nearby Deer Lake Park in Burnaby, British Columbia. After a couple of miles, though, as my body gets into a rhythm, my mind wanders back to the thought that occupy it for hours each day: where will this market go next?

And I’ve thought a lot about what went on this summer. Since June 1st:

•  S&P 500 is up 2.7%, having set a new record high in September;
•  MSCI World index is down 0.5%;
•  10 year Treasury yield is down from 2.54% to 2.50%;
•  Brent Crude 0il is down 12.8%; and

•  Gold is down 2.2%.

The Bureau of Economic Analysis reported that the U.S. economy expanded by 4.6% year on year in the second quarter, up sharply from the first quarter’s disappointing 2.1% annual decline. Consensus estimates for annual GDP growth in the third and fourth quarters of this year are about 3%.

The stage seems to be set for the fifth straight year of positive economic growth in the US; however, we’re always cautious about government supplied information, especially during an election cycle.

At the moment, macro developments seem closely intertwined with stock market performance. Instead of slumping, the market was rather vibrant this summer. The S&P 500 showed resilience, reaching higher highs after a dip in late July and early August that coincided with increased uncertainty surrounding the Ukrainian crisis.

Geopolitics aside, the market was supported by GDP growth, which in turn was underpinned by strong corporate profits and margins. In fact, in the second quarter, the S&P 500 set a new record for profit margins: 9.1%. So much for “sell in May and go away.”

Expanding earnings and margins are great news on the fundamental front. Of the trends we observed this summer, at least two will benefit S&P 500 companies’ profitability. Cheaper oil may keep energy costs down, while consumers are more than willing to swipe their debit and credit cards. In August, consumer confidence jumped to its highest level since October 2007, having increased for four months in a row.

Loose Money Helping Stocks in the Short Term


The Fed has done its part, too. Long-term effects of its prolonged loose monetary policy aside, it’s hard to argue that it hasn’t helped stocks in the short term. With Treasury rates still low, debt options abound, and companies can obtain cheap funding for things like capital expenditures and buying back shares.

In the first quarter, 290 companies from the S&P 500 bought back shares at a cost of $159.3 billion, 59% more than a year ago. Dividends are up as well: in the first quarter, S&P 500 companies spent a record $241.2 billion on dividends and repurchases together, according to Standard & Poor’s.

Second quarter share repurchases were estimated at $106 billion, according to Financial Post. That’s much lower than first-quarter repurchases (though the official numbers aren’t out yet) and down 10% year on year.

Buyback Frenzy Is a Net Positive for Share Prices


However, the most important takeaway is that the cumulative effect of the recent buyback frenzy was positive for share prices and dividends. With fewer shares, it’s easier for companies to maintain dividend payments. Higher share prices may drive down dividend yields, but companies tend to increase dividends over time, which makes up for that in part. And despite the S&P 500’s significant growth over the past five years, dividend yields have not decreased as much as one would expect.

The chart below tracks the S&P 500’s median dividend yield since the first quarter of 2009.


The median dividend yield decreased just slightly over this period: from 1.9% in 1Q09 to 1.7% in 2Q14, and it’s held relatively steady over the past three years.

The good news is that S&P companies aren’t stretching their balance sheets too thin to cover these dividend payments—these payments are backed by earnings. The median dividend payout ratio (the ratio of dividends paid to net income), although up from five years ago, still looks solid.


S&P companies can successfully cover their dividends with earnings, so there’s no reason to fear that they’ll have to borrow to keep paying them. However, a lot of investors worry about leverage. On one hand, financial leverage boosts return on equity (ROE), and prudent borrowing can be a positive for investors. On the other hand, large amounts of leverage leads to volatility in earnings, a less stable balance sheet, and risk that affects valuations.

Debt and Cash Both Up


These are legitimate concerns, but our next chart shows that in the past five years, S&P companies have increased debt while also accumulating a lot of cash on their balance sheets.


Debt and cash grew at about the same pace during the last couple of years. There were many reasons for this trend, but two interrelated ones stand out: the abundance of cheap debt that S&P companies took advantage of (why spend your own cash when you can finance on such great terms and pay it back over a long period?); and the desire to keep interest on that debt as low as possible by making credit rating agencies happy and holding a lot of cash in the bank.

If a correction is in the cards for the near term, this cash, increased earnings, and the support coming from share buybacks will provide some cushion for these companies’ valuations.

Why We’re Not “Permabears”


So what’s ahead? I wish I knew. There are a lot of market bears out there who say this rally will come to a halt sooner rather than later, and the S&P will fall off a cliff. I stay away from calling tops and bottoms and wonder how many pundits actually have any skin in the game. Going short the market requires timing; so any “permabear” who puts money where his mouth is may lose a lot if his timing is wrong.
I’m not saying the rising market is somehow “wrong.” There are solid company level fundamentals and positive macro-level data points here and there that support a significant part of its growth.

Your Plan to Profit


We’re pragmatists at Miller’s Money. Quantitative easing and basement-level interest rates have flooded the market with dollars and eroded yields, but you should use these circumstances to capture some of the benefits they’ve created. No, you can’t earn much on CDs. No, dividend yields might not beat inflation (at least not all of them, and certainly not every estimate of inflation). And yes, the current rally will eventually end, one way or another. We just don’t know when or how. No one does.

What matters is that even in this situation you can protect your financial well being by sticking to our core strategy: diversify geographically and across sectors; and invest in assets that provide robust yield relative to risk and have the potential to rise in price. You can learn more about the Miller’s Money Forever core strategy here—a time-tested plan designed for seniors, savers and like-minded conservative investors.


Make sure to get our latest FREE eBook "Understanding Options"....Just Click Here!

Tuesday, April 1, 2014

SP500 ETF Trading Strategies & Plan of Attack for This Week

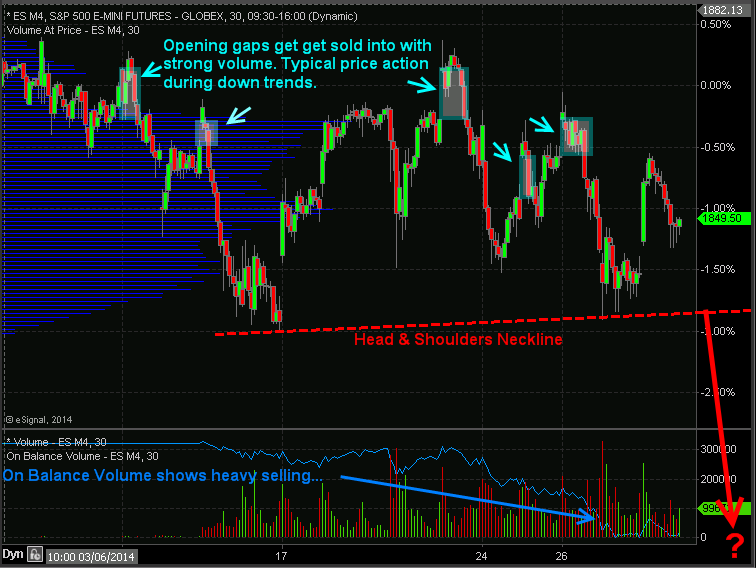
Index ETF Trading Strategies: Stocks have kick started this week with a 0.85% pop in price but the big question is if the market can hold up. Last week stocks repeatedly gap higher and sold off with strong volume telling us that institutions are slowing phasing out of stocks (distribution selling) unloading shares into strength and passing them onto the a average investor to be left holding bag.

I want to show you a couple charts which show the price action, volume and money flow of the SP500 so you have a visual of what I am talking about.

30 Minute Intraday SP500 Chart – ETF Trading Strategies

In the chart below you can see the price gaps followed by selling. Why is this important? It is important because during a down trend the market makers and big money plays who have the money and tools to manipulate the markets will allow the market drift higher or they will run price up in overnight or premarket trading when volume is light. Once the 9:30am ET opening bell rings volume and liquidity spike which allows the big money player to sell remaining long positions and or add to short positions they have.

If you look at the blue on balance volume line at the bottom of the chart you can clearly see that more contracts are being sold than bought which is typically an early warning sign that the market is about to fall farther.

ETF Trading Strategies
 

Automated Trading System – 30 Minute ES Futures Chart


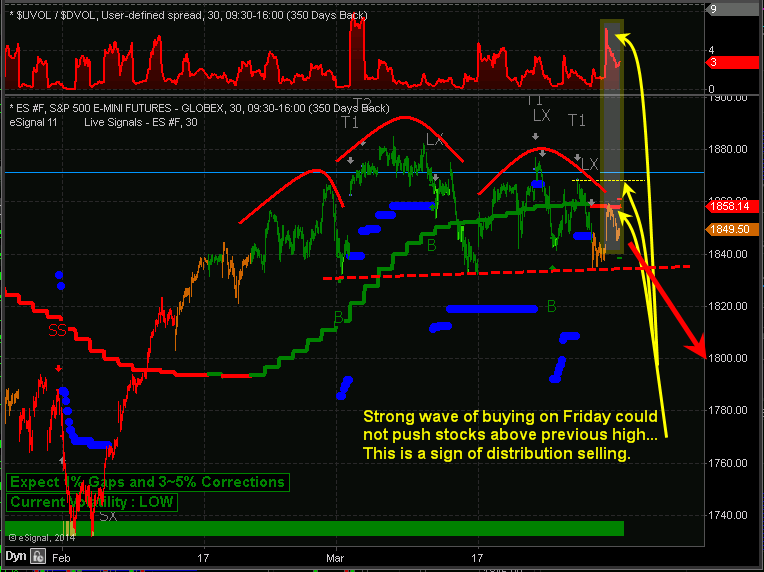
Below is a marked up screen shot of my automated trading system which I use for timing both futures and ETF trading strategies. The color coded bars tell you the market trend along with the strength of buyers and sellers.

When you couple market cycles, trends, volume/money flow, along with chart patterns we can forecast and trade markets with a high degree of accuracy in terms of market direction and timing.

Automated Trading Systems
 
My Index ETF Trading Strategies Conclusion:
 
Just to be clear on the current market trend and my overall outlook let me explain a little more. Overall, the broad stock market remains in an uptrend. Thursday and Friday of last week we started getting orange bars on the chart telling us that cycles, volume, and momentum are now neutral. It’s 50/50 on which way the market will go from here, so until the market internals (cycles, volume, breadth) push the odds in our favor enough for a short sell trade or a new long entry we will not add new positions to our portfolio.

It is important to understand that nearly 75% of stocks/investments move with the broad market. So we don’t want to add more long positions when the odds are not in favor of higher prices. Trading in general is not hard to do, but creating, following, executing properly money and position management is. If you have trouble with following or creating an ETF trading strategy you can have my ETF trading system for rising, falling and sideways markets traded automatically in your trading account.

Learn more here about my Automated Trading Systems

See you in the market! 
Chris Vermeulen


Sign up for one of our Free Trading Webinars....Just Click Here!


Friday, February 7, 2014

SP 500 Elliott Wave Forecast Unfolding As We Projected, What Is Next?

Back on January 15th we wrote an article and also a elliott wave forecast for both the public and our subscribers showing a likely top at a maximum of 1868 on the SP 500.  We said that Elliott Wave Major 3 of Primary Wave 3 would top no higher than that level.  In fact, we can go back to September 4th 2013 and we projected a Major 3 high as 1822-1829.  Turns out we were only about 1% off 4 months in advance of projecting that high, and once again we are on track here with Major 4 commencing from Major 3 highs.

Below is the Major 3 chart we sent out on September 12th in public articles and private reports

Elliott Wave Forecasts

We simply use Fibonacci analysis of wave patterns which are based on human behavioural tendencies that go back centuries. Elliott Wave Theory is often hard to put into practice, so sometimes it gets a bad name.  However, a bad steak at a restaurant doesn’t mean you never have steak again right? The practitioner must hone his or her skills over time and work to improve accuracy.

Our view is pretty simple in that the Major wave 3 was 583 points going from 1267 to 1850, the double top.
Below is the chart we did on January 15th in advance of this top:

Elliott Wave Analysis

We now know in hindsight that we topped out at 1850.  So what we want to do is simply take the 583 point rally of 1267 to 1850 (major 2 lows to Major 3 highs) and compute a retracement.  We use 23.6%, 31.2%, and 38% Fibonacci figures to come up with estimates. Those come in at 1713 on the shallow end of a correction (wave 4) and 1628 on the lower end.  (See chart below)

Elliott Wave Theory

Now, assuming we are on track… once this Major 3 completes we will see a Major wave 5 of Primary wave 3 taking us to all-time highs. This will then complete Primary wave 3 of this 5 primary wave bull cycle and then larger Primary wave 4 corrections will ensue from those highs.  We will know we are wrong in our degrees of wave counts if we pierce the 1628 level on the downside. That would indicate Primary 3 topped out 1850 and we are in Primary 4, which is not our current view.

Join us to stay up to date on a daily basis
Save $100 at www.MarketTrendsForecast.com


Tuesday, February 4, 2014

Is February a Risk On or Risk Off Trade: Equities or Gold & Bonds

Recent price action in the stock market has many traders on edge. With the market closing below our key support trend line last week, the market has now technically starting a down trend.

While trend lines are a great tool for identifying a weakening trend and reversals in the market, I do not put a lot of my analysis weighting on them.

Most of my timing and trading is based around what I call INNER-Market Analysis (Market Stages, Cycles, Momentum and Sentiment). Using these data we can diagnose the overall health of the market. Knowing the strength of the market we can then forecast short term trend reversals before they happen with a high degree of accuracy.

In this report I keep things clean and simple using just trend lines. During the last three weeks we have seen the price of stocks pullback. And because 2013 was such a strong year for stocks most participants are expecting a sharp market correction to take place anytime now.

So with the recent price correction fear is starting to enter the market and money is rotating out of stocks and into the Risk Off assets like gold and bonds.

Stocks tend to fall in times of economic uncertainty or fear. These same factors push investors towards the safety trades (Risk Off) high quality bonds and precious metals. As more money goes from risk on to risk off, stocks will continue to fall and the safety trades will rise. The move by investors to select the safety of gold and bonds compared to the volatility of stocks will result in these risk plays to moving in opposite directions.

Let’s take a look at the chart below for a visual of what looks to be unfolding…...

Gold Trading Newsletter


How to Trade These Markets:


While these markets look to be starting to reverse trends, it is critical that we understand how the market moves during reversals and understand position/money management.

Getting short stocks and long precious metals in the long run could work out very well, but if you understand the price action that typically happens during reversals you know that the stock market will become choppy and we could see the recent highs tested or possibly even a new high made before price actually starts a down trend. And the opposite situation for gold and bonds. Drawdowns can be huge when investing and why I don’t just change position directions when the first sign of a trend change shows up on the chart.

Price reversals are a process, not an event. So it is important to follow along using a short term time frame like the daily chart and play the intermediate trends that last 4-12 weeks in length. By doing this, you are trading in the direction of the most active cycle in the stock market and positioned properly as new a trend starts.

What I am looking for in the next week or two:


1. Stocks to trade sideways or drift higher for 3-6 days, then I will be looking to get short. Again, cycle, sentiment, and momentum analysis must remain down for me to short the market. If they turn back up I will remain in cash until a setup for another short or long entry forms.

2. Gold remains in a down trend but is starting to breakout to the upside. I do have concerns with the daily chart patterns for both gold and silver, so next week will be critical for them. We will be using some ETF Trading Strategies to take advantage of these moves.

3. Bond prices (not yields) look to be forming a bottom “W” pattern. They have had a big run in the last few weeks and are now testing resistance. I think a long bond position is slowly starting to unfold but if we look at the futures price charts for both bonds and gold, they have not yet broken to the upside and have more work to do. As mentioned before ETFs are not really the best tool for charting but I show them because they what the masses follow and trade.

Get these reports every week free at: The Gold & Oil Guy.com

Chris Vermeulen


Get our "Gold and Crude Oil Trade Ideas"


Monday, February 3, 2014

Mondays Market Summary - Gold, Crude Oil, Natural Gas, SP 500 and Coffee

The DOW closed sharply lower on Monday as it extends the decline off January's high. Today's sell off was triggered by a sharp decline in telephone stocks, disappointment over auto sales by Ford and General Motors and reports that Jos. A. Bank Clothiers will not enter into takeover talks.

Are you one of the "New Millionaires"

The SP500 closed sharply lower [March contract] on Monday and below the 2012-2013 uptrend line crossing near 1744.00 confirming that am intermediate trend change is taking place. The low range close sets the stage for a steady to lower opening when Tuesday's night session begins trading. Stochastics and the RSI are oversold but remain neutral to bearish signaling that additional weakness is possible near term. If March extends this year's decline, the 25% retracement level of the 25% retracement level of 2012's rally crossing at 1692.03 is the next downside target. Closes above the 20 day moving average crossing at 1811.38 are needed to confirm that a short term low has been posted. First resistance is the 10 day moving average crossing at 1791.33. Second resistance is the 20 day moving average crossing at 1811.38. First support is today's low crossing at 1735.50. Second support is the 25% retracement level of 2012's rally crossing at 1692.03.


Get our Gold, Crude Oil& Index ETF Trading Analysis Newsletter

Crude oil closed lower due to profit taking on Monday as it consolidated some of the rally off January's low. Today's low range close sets the stage for a steady to lower opening when Tuesday's night session begins. Stochastics and the RSI are overbought but are turning neutral to bearish hinting that a short term top might be in or is near. Closes below the 20 day moving average crossing at 95.00 would confirm that a short term top has been posted. If March extends the aforementioned rally, the 87% retracement level of the December-January decline crossing at 99.58 is the next upside target. First resistance is the 75% retracement level of the December-January decline crossing at 98.47. Second resistance is the 87% retracement level of the December-January decline crossing at 99.58. First support is today's low crossing at 96.26. Second support is the 20 day moving average crossing at 95.06.

We are offering INO TV for FREE right now!

Natural gas [March contract] closed lower on Monday. The high range close sets the stage for a steady to higher opening on Tuesday. Stochastics and the RSI are bearish hinting that a pause in the rally is possible or that a short term top has been posted. Closes below the 20 day moving average crossing at 4.528 would confirm that a short term top has been posted. If March renews this winter's rally, monthly resistance crossing at 6.108 is the next upside target. First resistance is last Wednesday's high crossing at 5.486. Second resistance is monthly resistance crossing at 6.108. First support is the 10 day moving average crossing at 4.843. Second support is the 20 day moving average crossing at 4.528.

Here's detailed analysis on the March Natural Gas contract

Gold closed higher [April contract] on Monday. The mid range close sets the stage for a steady opening when Tuesday's night session begins trading. Stochastics and the RSI are neutral to bearish signaling that sideways to lower prices are possible near term. If April extends last week's decline, the reaction low crossing at 1215.30 is the next downside target. If April renews the rally off December's low, the 50% retracement level of the August-December decline crossing at 1306.20 is the next upside target. First resistance is last Monday's high crossing at 1280.10. Second resistance is the 50% retracement level of the August-December decline crossing at 1306.20. First support is the reaction low crossing at 1230.80. Second support is the reaction low crossing at 1215.30.

Here's our complete FREE trading webinar schedule, courtesy of Premier Trader University

Coffee closed sharply higher on Monday [March contract] as it extends this rally off November's low. The high range close set the stage for a steady to higher opening on Tuesday. Stochastics and the RSI are bullish signaling that sideways to higher prices are possible near term. If March extends the rally off November's low, last July's high crossing at 13.80 is the next upside target. Closes below the 10 day moving average crossing at 11.87 would confirm that a short term top has been posted.

Get our "Gold and Crude Oil Trade Ideas"


Wednesday, January 15, 2014

Using 3X ETF's....Maybe this is now Possible

For years we have resisted using the 3X ETF's for our near term and day trading. These can potentially cut your head off over night. The main reason we have not been willing to use these tickers is that our traditional research including the resistance, support and pivot numbers just don't work.

But our friend and trading partner Chris Vermeulen is trying to convince us that he has it figured out. He has been telling us this for years but now he has created a program that....well, in all honesty looks like he was right.

Check out Chris new AlgoTrades Program

Here is his most recent trade using the ES Mini futures contract.....

On Jan 13th 2014 our algorithmic trading system took a long position in the SP500 futures trading contact. In less than 24 hours our algorithm system was able to identify resistance in the market the following session. This invisible overbought market condition which only our algorithmic trading system identified automatically sold 1/3rd of our long position for a quick $1100 profit and adjusted the protective stop to breakeven on the balance of the position.

Quick note: While this trade was executed on the ES mini futures contract using our futures trading system, we do have a 3x automated trading system for ETFs. We know the most of our followers and the general public prefer ETF trading because they understand them more and have less risk. So we built this 3x automated trading system using the 3 times leveraged exchange traded funds.

As of today (Jan 15th) we are sitting with a risk free trade, $1100 in realized gains, and another $2400 in gains on the remainder of our position. This type of trade setup has happened twice in the past 10 days. The first trade took $500 in profit and was stopped out the next day and now this trade.

Click here to read Chris' entire article and check out his chart work on this trade.


Don't miss Chris' 7 Steps to win with Logic


Thursday, December 26, 2013

Bear Market Cycle Bottom Forming in Gold and Gold Stocks Right Now!

Today our trading partner David Banister takes a look at the Bullish Percent Index chart relative to Gold’s cycle and Gold Stocks.

Essentially it tells you what percentage of Gold sector stocks are at or above a moving average, which normally would be 50 days. When 70% or more are above a 50 day moving average, sectors can be peaking out. If you look at our chart at the bottom, we have labeled various incidents with A, B, C, and D.

A. The precious metal as we all know peaked in the fall of 2011 at $1923 per ounce, and the Bullish percent index was at 80%! Usually at 30% or so, they are bottoming out in most cases.

B. We saw a rare case in the summer of 2013 where the Bullish percent index for Gold stocks was at 0%, yes that is not a miss-print.

C. Gold bottomed at 1181 in late June 2013, and then rallied up to 1434 and we saw Gold stocks rally 40-80% in individual cases and the Bullish percent index rallied up to 55%.

D. If we fast forward to December 2013, we have Gold pulling back in the final 5th wave down from the Bull cycle highs in August 2011 at $1923. The Bullish percent index is back to 10% and heading towards 0 or close once again. At the same time, the Gold miners index ETF (GDX) is at 5 year lows and even lower than June-July 2013 lows.

These types of indicators are coming to a pivot point where Gold is testing the summer 1181 lows and may go a bit lower to the 1090 ranges. At the same time, we see bottoming 5th wave patterns combining with public sentiment, bullish percent indexes, and 5 year lows in Gold stocks. This is how bottom in Bear cycles form and you are witnessing the makings of a huge bottom between now and early February 2014 if we are right.

The time to buy Gold and Gold stocks is now during the next 4 - 5 weeks just as we were recommending stocks in late February 2009 with public articles that nobody paid attention to. This is the time to start accumulating quality gold miner and also the precious metals themselves as the bear cycle winds down and the spring comes back to Gold and Silver in 2014.


Click here to join us at Market Trend Forecast for regular updates on Gold, Silver, and The SP 500 Index.


Thursday, November 28, 2013

Elliott Wave Forecast: Bull Market Nearing Interim Peak on SP500

Back on September 12th with the SP 500 at 1689 we forecasted a run in the SP 500 to 1829, a very specific number. We use Elliott Wave Theory and Analysis in part to come up with projected pivots for the SP 500 and this was our projection.

Elliott Wave Analysis is based largely on Human Behavioral patterns that repeat over and over again throughout time. It’s really crowd behavior or herd mentality as applied to the broader stock markets. This can also apply to individual stocks, precious metals and more. At the end of the day, an individual stock is worth what investors believe it is worth, and it won’t necessarily reflect what a private valuation may accord it.

With that in mind, the stock market as a basket of 500 stocks can pretty easily be patterned out and then we can apply our Elliott Wave Theory to that pattern and predict outcomes. Back in mid-September, we believed we were in a 3rd wave up of the bull market as part of what we call Primary wave 3. The primary waves are 1-5 and Primary 3 is usually the most bullish of the 5 primary waves with 2 and 4 being corrective. Well, within Primary wave 3 you have 5 major waves… and we projected that Major wave 3 would be running to about 1829.

This projection was based on the 1267 pivot for Major wave 2 of Primary Wave Pattern 3 which was a corrective wave. We then simply applied a Fibonacci ratio to the Major wave 1 and assumed that Major wave 3 would be 161% of Major 1. That brings us to about 1822-1829… and here we are a few months later heading into Thanksgiving with the SP 500 hitting 1807 and getting close to our projection.

What will happen afterwards should be a Major wave 4 correction. We expect this to be about 130 points on the shallow side of corrections, and as much as 212 points.

So the Bull Market is not over, but Major Wave Pattern 3 of Primary 3 is coming to an end as we are in a seasonally strong period for the market. We would not be shocked to see a strong January 2014 correction in the markets as part of Major wave 4.

Here is our September 14th elliott wave forecast chart we sent to our subscribers and you can see we continue now along the same path.....Read "Elliott Wave Forecast: Bull Market Nearing Interim Peak on SP500"


Tuesdays Free webinar: How to Boost Your Returns With One Secret ETF Strategy


Tuesday, November 5, 2013

This Has Been Working for 100 Years

When you look forward to the next 12 months, do you want your trading results to be different than they are now? In fact, most traders today are feeling frustrated and disappointed with their trading performance.

But truthfully, it’s not your fault…

You see, most of the popular trading strategies of the 80s and 90s are not working today. In fact, they stopped working in the year 2000.

And surprisingly, many trading educators are still teaching them (and too many traders are still using them!) Why? Because they don't know where else to turn.

However, there’s a small community of traders who did find a way to achieve consistent profits in these markets and they're doing it by using a secret trading methodology that ís been proven to work for over 100 years!

Amazing when you really think about it, the only difference between now and then is the revealing way in which they've perfected the methodology for reduced risk, increased profitability, and more consistency.

Watch the proof here. Watch "PowerStock Strategies....are you Ready?

Wednesday, August 28, 2013

Precious Metals & Miners Flash Short-Sell Signal

It has been a bumpy ride for precious metal investors over the past couple of years and unfortunately we do not think its over just yet. But we feel fortunate to have our trading partner Chris Vermeulen on our team walking us through this.

Today Chris is telling us that the good news is that the bottom has likely been put in for gold, silver and gold miners BUT the recent rally in these metals and miner looks to be coming to an end. While we could see another pop in price over the next week or so the price, volume and momentum seem to be stalling out.

What does this mean? It means we should expect short term weakness and lower prices over the next month or two.

Here are three charts Chris posted several months. Their forecast were based off simple technical analysis using cycles, Fibonacci and price patterns. As you can see we are not trading at our key pivot level which we expect selling pressure to start to increase and eventually overpower the buyers sending the prices lower.....Click here to see Chris' complete chart work and article.


Monday, August 12, 2013

The SP500 Enters Major Correction Period

Our trading partner David A. Banister of Market Trends Forecast releases his call that the SP 500 is close to confirming new correction. Says 1685 support is the key. Here's the details based on his Elliot Wave research.

The SP 500 has been on a tear since late 2012 with the SP 500 bottoming at 1266. The rally though we have been charting out as part of a “Primary wave 3″ uptrend for this Bull market cycle from March 2009, and we are likely entering a Major correction or what we would label “Major wave 4″. Since the 1266 lows, we have had Major Wave 1, 2, and now 3 completed at 1710. We are entering Major wave 4 which should correct 23-38% of the entirety of Major wave 3, which was 444 points.

This correction will be confirmed with any close below 1674 and nails in the coffin begin with any close below 1685 on the SP 500 index. Primary wave 1 of this super bull cycle ended at 1370, a 704 point rally. Primary wave 3 will likely be larger than Primary wave 1 and I am projecting a top between 1900-2000 on the SP 500 before it’s completed. The current correction is Major wave 4 of Primary wave 3, which has 5 Major waves required. With that said, our projections are for 1605 on the shallow side and 1540 on the deeper side for Major wave 4 of Primary wave 3.

Now it is possible that we may extend a bit higher yet in Major wave 3 to 1736-1772, but only if we hold the 1685 support lines which the market is basing around currently. In any event, at our Trading service we have been aggressively taking profits in the past two weeks on multiple positions while still holding a few open at this time.

Below is a chart showing our projected correction pivots of 1605 and 1540, subscribers will be updated on a regular basis. Just click here to join Banister with a 33% discount on his trading service and also receive Precious Metals (GOLD) forecasts on a regular basis every week.

812 SP 500


John Carter releases DVD version of "Spread Trading Strategies for any size Account"....Click Here to get your copy!


Monday, June 17, 2013

SP 500 Extends Rally Off Thursdays Low

The September S&P 500 closed higher on Monday as it extends the rally off last Thursday's low. The mid range close sets the stage for a steady opening when Tuesday's night session begins trading.

Stochastics and the RSI are diverging but have turned neutral to bullish signaling that sideways to higher prices are possible near term. Closes above the 20 day moving average crossing at 1633.22 would confirm that a short term low has been posted. If September renews the decline off May's high, the 38% retracement level of the November-May rally crossing at 1545.59 is the next downside target.

First resistance is the 20 day moving average crossing at 1633.22. Second resistance is May's high crossing at 1678.00. First support is the 25% retracement level of the November-May rally crossing at 1591.35. Second support is the 38% retracement level of the November-May rally crossing at 1545.59.

Make sure to check out "Options Income Access" it's now LIVE!

Monday, May 27, 2013

Precious Metals & Miners Start Bottoming Process

Precious metals and their related mining stocks continue to under perform the broad market. This year’s heavy volume breakdown below key support has many investors and trader’s spooked creating to a steady stream of selling pressure for gold and silver bullion and mining stocks.

While the technical charts are telling me prices are trying to bottom we must be willing to wait for price to provide low risk entry points before getting involved. Precious metals are like any other investment in respect to trading and investing in them. There are times when you should be long, times to be in cash and times to be short (benefit from falling prices). Right now and for the last twelve months when looking at precious metals cash has been king.

Since 2011 when gold and silver started to correct the best position has been to move to cash or to sell/write options until the next trend resumes. This is something I have been doing with my trading partner who focuses solely on Options Trading who closed three winning positions last week for big gains.

In 2008 we had a similar breakdown in price washing the market clean of investors who were long precious metals. If you compare the last two breakdowns they look very similar. If price holds true then we will see higher prices unfold at the end of 2013.

The key here is for the price to move and hold above the major resistance line. A breakout would trigger a rally in gold to $2600 – $3500 per ounce. With that being said gold and silver may be starting a bear market. Depending what the price does when the major resistance zone is touched, my outlook may change from bullish to bearish. Remember, no one can predict the market with 100% accuracy and each day, week and month that passes changes the outlook going forward.

The chart below is on I drew up on May 3rd. I was going to get a fresh chart and put my analysis on it but to be honest my price forecast/analysis has been spot on thus far and there is no need to update.

LongTermWeeklyGold


Gold Daily Technical Chart Showing Bottoming Process:

Major technical damage has been done to the chart of gold. Gold is trying to put in a bottom but still needs more time. I feel gold will make a new low in the coming month then bottom as drawn on the chart below.

Gold27


Silver Daily Technical Chart Showing Bottoming Process:

Silver is in a similar as gold. The major difference between gold and silver is that silver dropped 10% early one morning this month which had very light volume. The fact that silver hit my $20 per ounce level and it was on light volume has me thinking silver has now bottomed.

But, silver may flounder at these prices or near the recent lows until its big sister (gold) puts in a bottom.

SIlver27

Gold Mining Stocks Monthly Investing Zone Chart:

Gold mining stocks broke down a couple months ago and continue to sell off on strong volume. If precious metals continue to move lower then mining stocks will continue their journey lower.

This updated chart which I originally drew in February warning of a breakdown below the green support trend lines would signal a collapse in stock prices, which is exactly what has/is taking place. While I do not try to pick bottoms (catch falling knives) I do like to watch for them so I am prepared for new positions when the time and chart turn bullish or provide a low risk probing entry point.

While we focus more on analysis, forecasts and ETF trading another one of my trading partners who focuses on Trading Stocks and 3x Leveraged ETF’s has been cleaning up with gold miners.

GDX27


Gold, Silver and Mining Stocks Conclusion:

Precious metals continue to be trending down and while they look to be trying to bottom it is important to remember that some of the biggest percent moves take place in the last 10% of a trend. So we may be close to a bottom on the time scale but there could be sharply lower prices yet.

The time will come when another major signal forms and when it does we will be getting involved. The exciting this is that it could be just around the corner. So if you want to keep current and take advantage of the next major moves in the market be sure to join our newsletters.

From our trading partner Chris Vermeulen


 Join our FREE Newsletter Today and check out our Memorial Day Special


The Bible for Commodity Traders....Get our free eBook now!

Sunday, May 12, 2013

Correction near but Bull Market has LONG waves to Go!

From guest blogger David Banister at Market Trend Forecast.....

The SP 500 has been on a tear as we all know especially since the SP 500 bottomed at 1343 several months ago. My work centers around forecasting using Elliott Wave Theory along with other technical indicators. This helps with projecting the short, intermediate, and longer term paths in the stock market and also precious metals. This larger picture Bull Cycle started in March of 2009 interestingly after an exact 61.8% Fibonacci retracement of the entire move from 1974 to 2000 lows to highs. At 666, we had completed a major cycle bottom with about 9 years of movement to retrace 26 years of overall bull cycle. That was a major set of 3 waves (Corrective patterns in Elliott Wave Theory) from the 2000 highs to 2002-3 lows, then 2007 highs to 2009 lows. Once that completed its work, we were free to have a huge new bull market cycle off extreme sentiment and generational lows.

It’s important to understand where we were at in March of 2009 just as much as it is today with the market at all time highs. Is this the time to bail out of stocks or do we have a lot more upside yet to go? Our short answer is there is quite a bit more upside left in the indexes, but there are multiple patterns that must take place along the way. We will try to lay those out for you here as best we can.

Elliott Wave theory in general calls for 5 full wave cycles in a Bull pattern, with 1, 3, and 5 bullish and 2 and 4 corrective. We are currently in what is often the most bullish of all the patterns, a 3rd of a 3rd of a 3rd. In English, we are in Primary wave 3 of this bull cycle which will be 5 total primary waves. We are in Major wave 3 of that Primary 3, and in the Intermediate wave 3 of Major wave 3. That is why the market continues its relentless climb. This primary wave 3 still has lots of work to do because Major wave 3 still has a 4th wave down and a 5th wave up to finish, then we need a major 4, then a major 5.

That will complete primary wave 3. This will then be followed by a Primary wave 4 cycle correction that probably lasts several months, and then a Primary wave 5 cycle to finish this part of the bull market from March 2009 generational lows… and all of that work is going to take time. Once that entire process from March 2009 has completed, then we should see a much deeper and uglier correction pattern, but we think that is at least 12 months or more away.

What everyone wants to know then is where are we at right now and what are some likely areas for pivot highs and lows ahead? We should complete this 3rd of a 3rd of a 3rd here shortly and have a wave 4 correction working off what will likely be almost 300 points of upside from SP 500 1343. We could see as much as 90-120 points of correction in the major index once this wave completes. Loosely we see 1528-1534 as a possible top and if not then maybe another 30 or so points above that maximum into early June. This should then trigger that 90-120 point correction, and then be followed by yet another run to highs.

We could go on but then we will lose our readers here for sure, and as it is… this is all projections and postulations, so it’s best to keep the forecast to the next many weeks or few months. Below is a chart we have put together showing the structure of Major wave 3 of Primary 3 since the 1343 lows. Once that Major wave 3 tops out (see the blue 3) then we will have Major 4, then Major 5 to complete Primary wave 3 since the 1074 SP 500 lows. Whew!

TMTF

Join us to get daily updates on nearer term directions of the SP 500 and Gold


Thursday, March 28, 2013

Gold vs. S&P 500 – Where is the Value?

This past week we received the final 4th Quarter GDP number which came in at 0.39%. The total 4th Quarter growth was terrible, plain and simple. Based on the performance in the equity markets that we have seen thus far in the 1st Quarter of 2013 investors would expect strong GDP growth. However, the only thing spurring stock market growth is the constant humming of Ben Bernanke’s printing press.

The real economy and the stock market are no longer strongly correlated. Essentially, they are meaningless. How do you evaluate risk when Treasury linked interest rates are artificially being held down by the Federal Reserve? How do you evaluate earnings growth estimates when most government based statistics are manipulated or “smoothed” to perfection?

My final argument to anyone who is a true believer that the stock market is representative of the economy is a very simple premise. If the stock market is the economy, how does the stock market evaluate small business earnings growth when most small businesses are not publicly traded? It is a simple question, but I have yet to find a sell side analyst that can work around it with facts......Read More.


Get our Free Trading Videos, Lessons and eBook today!

Wednesday, March 6, 2013

Final Stages of the Advance on SP 500....The Wave Pattern

Our trading partner David Banister has been projecting a potential rally pivot at 1552-1576 for many weeks now. The recent drop to 1485 although harrowing, was a normal fibonacci retracement of the last major rally leg to 1531 pivot highs. Banister believes that this 5 wave advance 1343 pivot lows is nearing an end based on mathematics and relationships to prior waves 1-3.

At 1569 the SP 500 would mark a perfect fibonacci relationships to waves 1-3 for this final 5th wave to the upside. In the big picture, we are still working higher off the 1010 pivot lows on the SP 500, and this rally takes 5 full waves to complete. He thinks we are near wave 3 highs, and wave 4 correction would be up next, followed by another thrust to highs if all goes well this year.

That all said, a multi-week correction and consolidation wave 4 pattern is likely once we pivot at 1552-1576. We should expect this correction to retrace anywhere from 80 -100 points on the SP 500, but one week at a time.

Click here to see his updated pattern views and sign up for free reports.


Get our Free Trading Videos, Lessons and eBook today!

Friday, March 1, 2013

How to Trade POMO Manipulation

This week I talked about how the uptrend is to be the focus of trading positions until a down trend is actually confirmed via price and volume action. The SP500 was very close to reversing down this week but with the POMO’s (permanent open market operations) scheduled largest injection of money for February of over $5 billion dollars sent stocks soaring jamming stocks back up into its uptrend.

Take a look at the normal daily injections and then look at Feb 27th’s....

pomo2

SP500 Futures 10 Minute Chart Zoomed Back 48 Hours....

MarketPomoPush

SP500 Trend – Green, Orange, Red candles indicate trend direction....

PomomSavesUpTrend

Short Term Trading Conclusion:

Following the bigger underlying trend of the market along with the big money will keep you on the right side of the market more times than not. My trading strategy which is now programmed into my trading system clearly tells me the current market trend, entry signals, profit taking, stop adjustments and exit prices.

Creating a proven trading strategy which works in all market conditions and having it programmed to do 95% of the analysis for you keep my trading emotions in check, saves me time and money and keeps things simple which is the key for long term success. So keep your eye on the POMO’s injection schedule each month for days to focus on long day trades or entry points for swing trades.

Receive Free Weekly Reports, Trading Tips and my Book at The Gold & Oil Guy.com

Chris Vermeulen
 

Get our Free Trading Videos, Lessons and eBook today!

Tuesday, February 26, 2013

Gold, Copper, and Crude Oil Forecasted the Recent Selloff in the S&P 500

Nobody better in the industry at understanding herd mentality then the staff at The Technical Traders. And of course they have been telling us it would be like this.....you just have to know which herd to watch and when.....

For the past several weeks, everywhere I looked all I could find was bullish articles. After the fiscal cliff was patched at the last second, prices surged into the 2013 and have since climbed higher all the way into late February.

I warned members of my service that this runaway move to the upside which was characterized by a slow grinding move higher on excessively low volume and low volatility would eventually end violently. I do not have a crystal ball, this is just based on my experience as a trader over the years.

Unfortunately when markets run higher for a long period of time and just keep grinding shorts what typically follows is a violent selloff. I warned members that when the selloff showed up, it was likely that weeks of positive returns would be destroyed in a matter of days.

The price action in the S&P 500 Index since February 20th has erased most of the gains that were created in the entire month of February already and lower prices are possible, if not likely. However, there are opportunities to learn from this recent price action.

There were several warning signs over the past few weeks that were indicating that a risk-off type of environment was around the corner. As a trader, I am constantly monitoring the price action in a variety of futures contracts in equities, currencies, metals, energy, and agriculture to name a few.

Besides looking for trading opportunities, it is important to monitor the price action in commodities even if you only trade equities. In many cases, commodity volatility will occur immediately prior to equity volatility. Ultimately the recent rally was no different.

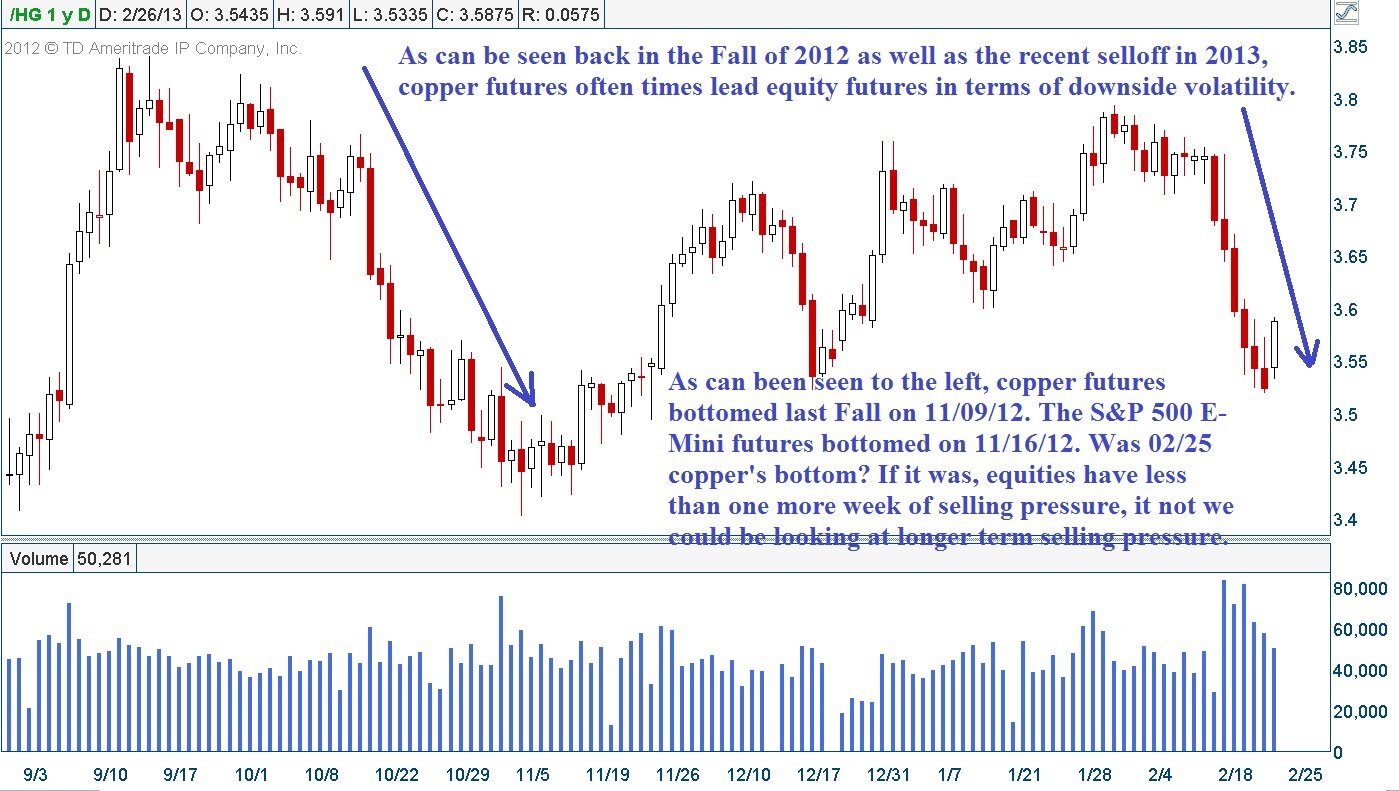
As an example, metals were showing major weakness overall with both gold and silver selling off violently. However, what caught my eye even further was the dramatic selloff in copper futures which is shown below.

Copper Futures Daily Chart

Chart1

As can be seen above, copper futures had rallied along with equities since the lows back in November. However, prices peaked in copper at the beginning of February and a move lower from 3.7845 on 02/04 down to recent lows around 3.5195 on 02/25 resulted in roughly a 7% decline in copper prices over a 3 week period.

As stated above, commodity volatility often precedes equity volatility. As can be seen above, copper futures appear to be reversing during the action today and many times commodities will bottom ahead of equities.

I want to be clear in stating that equities will not necessarily mirror the action in commodities or copper specifically, but some major volatility was seen in several commodity contracts besides just metals. Oil futures were also coming under selling pressure as well.

Crude Oil Futures Daily Chart

Chart2

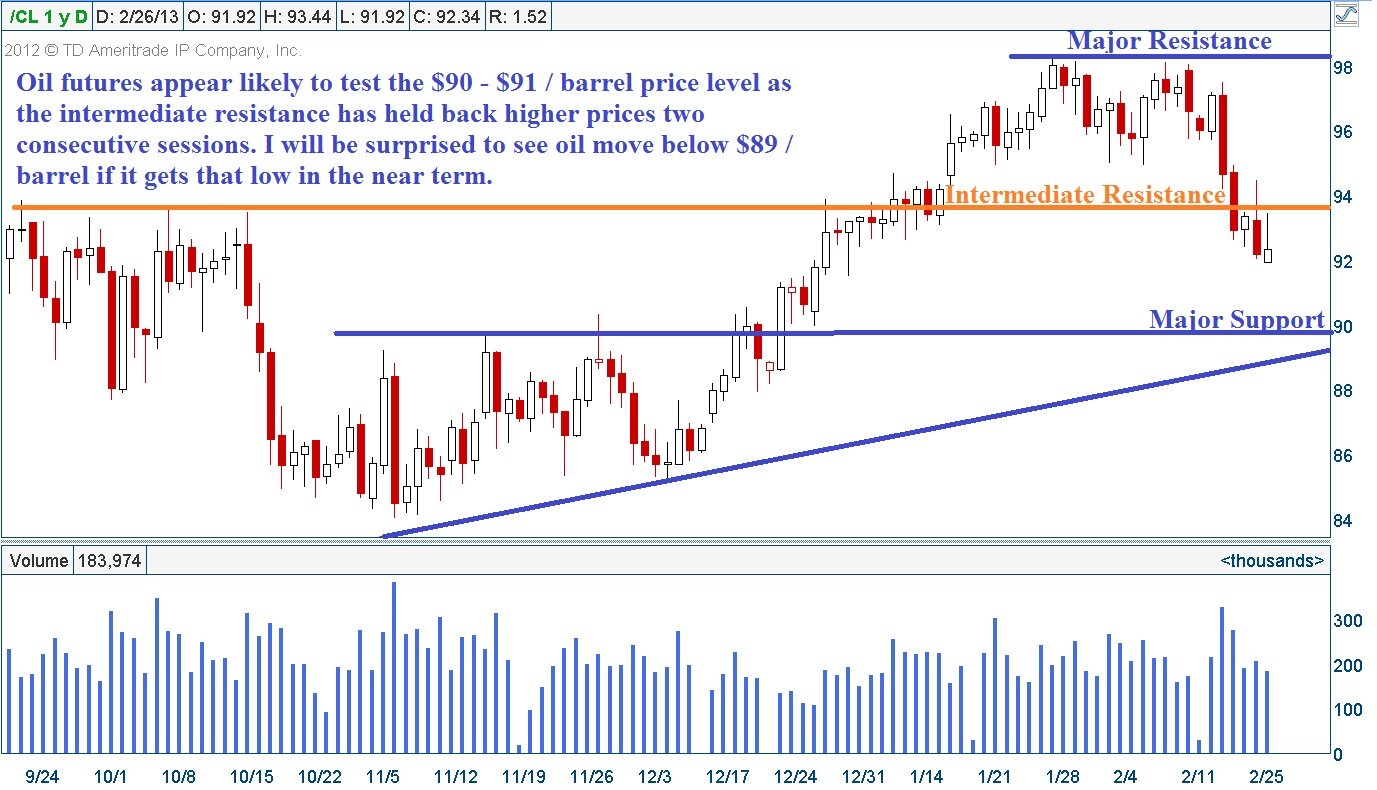
As can be seen above, oil futures topped right at the end of January and then sold off briefly only to selloff sharply lower a few weeks later. Oil futures gave back roughly 6% – 7% as well which is quite similar to copper’s recent correction. I have simply highlighted some key support / resistance levels on the oil futures chart for future reference and for possible price targets.

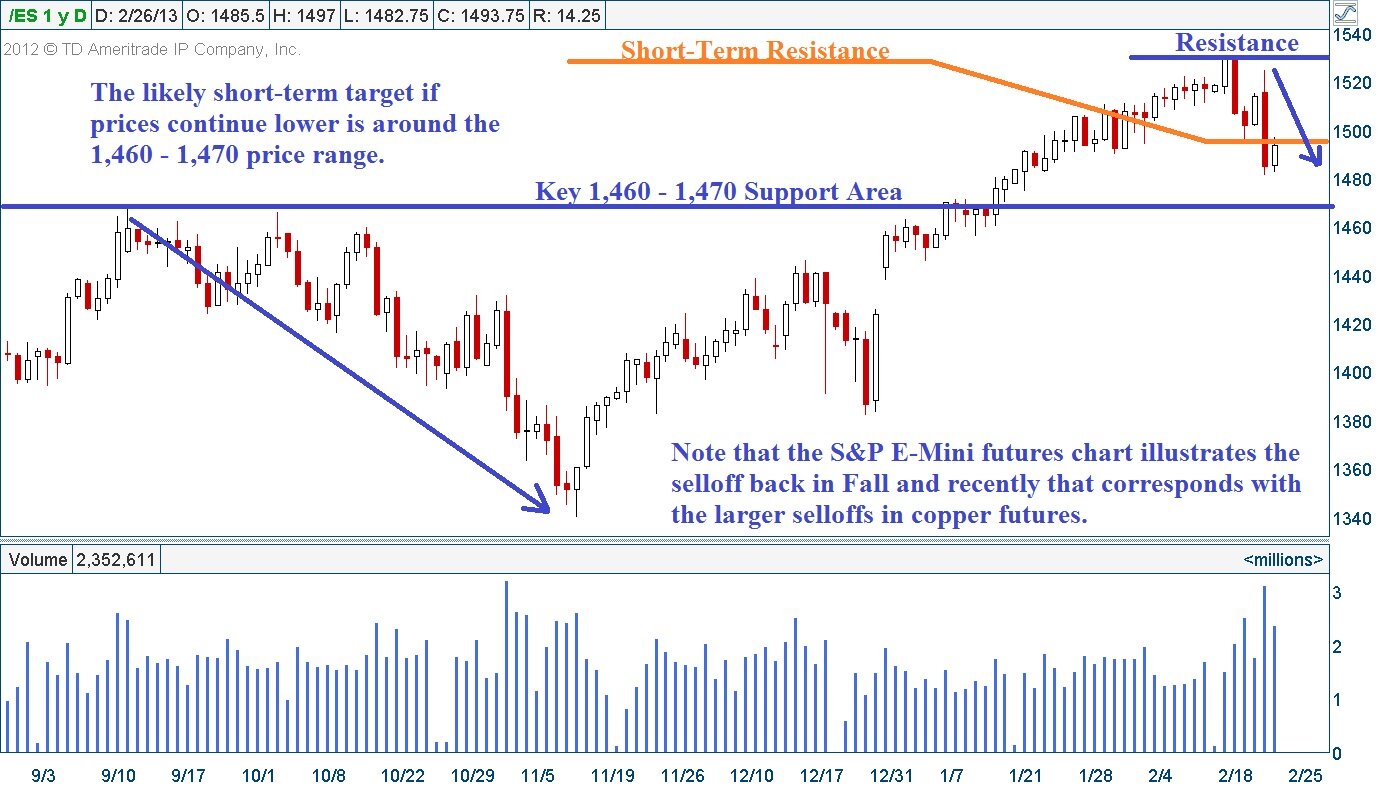
In equity terms, since February 20th the S&P 500 futures have sold off from a high of around 1,529 to Monday’s low of 1481.75. Thus far we are seeing a move lower of about 3.10% since 02/20 in the S&P 500 E-Mini futures contract. While I am not calling for perfect correlation with commodities, I do believe that a 5% correction here not only makes sense, but actually would be healthy for equities.

S&P 500 E-Mini Futures Daily Chart

Chart3

If we assume the S&P 500 E-Mini contracts were to lose 5% from their recent highs, the price that would correspond with that type of move would be around 1,453.

As shown above, while 1,453 does represent a consolidation zone in the S&P 500 which occurred in the beginning of January of 2013, there is a major support level that corresponds with the 1,460 – 1,470 price range.

I am expecting to see the S&P 500 test the 1,460 – 1,470 price range in the futures contract, however the outcome at that support level will be important for future price action. If that level holds, I think we likely reverse and move higher and we could even take out recent highs potentially. In contrast, if we see a major breakdown below 1,460 I believe things could get interesting quickly for the bears.

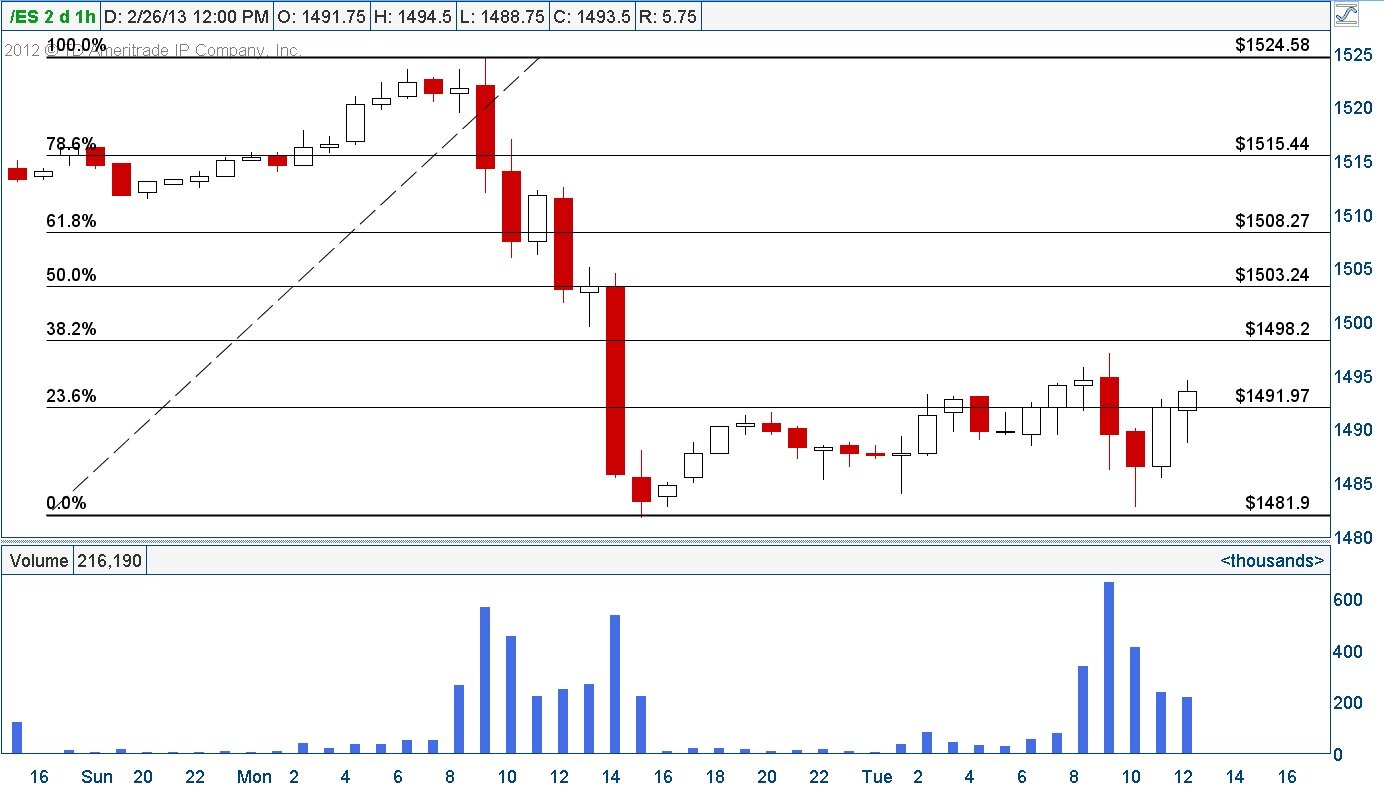
I am watching the price action today closely as I am interested in what kind of retracement we will get based on yesterday’s large bullish engulfing candlestick on the daily chart of the S&P 500 futures.

Ultimately if the retracement remains below the .500 Fibonacci Retracement area into the bell we could see some stronger selling pressure setting in later this week. The Fibonacci retracement of the 02/25 candlestick can be seen below.

S&P 500 E-Mini Futures Hourly Chart

Chart4

So far today we have not been able to crack the 0.382 Fibonacci retracement area. This is generally considered a relatively weak retracement and can precede a strong reversal which in this case would be to the downside in coming days.

It is always possible to see strength on Wednesday and a move up to the .500 retracement level. As long as price stays under the .500 Fibonacci retracement level, I think the bears will remain in control in the short-term. However, should we see the highs from 02/25 taken out in the near term the bulls will be in complete control again.

Right now I think it is early to be getting long unless a trader is looking to scale in on the way down. I think the more logical price level to watch carefully is down around 1,460 – 1,470 on the S&P 500. If that level is tested, the resulting price action will be critical in shaping the intermediate and long-term price action in the broad equity indexes.

If you have to trade, keep position sizes small and define your risk. Risk is elevated at this time.

If you would like to get our detailed trading videos each week and know what is just around the corner test out here:

Risk FREE 30 Day Trial only $1 for the first 30 days!

Chris Vermeulen & JW Jones
The "Traders Video Playbook"


Get our Free Trading Videos, Lessons and eBook today!

Tuesday, August 14, 2012

SP 500 “E Wave” ready to rally to Bull Market Highs

From guest analyst David Banister at Market Trends Forecast.com.......

In recent updates I have been projecting a series of ABCDE waves to take the Bull market to post March 2009 highs in the 1425-1445 ranges. The recent pullback was expected as what I was calling a “D wave” pullback, with an E wave to come. These final 5th waves or E waves can be extension waves or relatively benign, hence causing difficulty in forecasting the upper ranges.

In the case of the SP 500 index, we have had a strong rally from the 1267 lows in early June to 1409 highs so far (The C wave highs) and recently a pullback into the 1390’s (The D wave). This next leg up should carry the market indices towards the 1440 2008 interim highs which begat the last 5 wave down leg of the Bear cycle that ended at 666 on the SP 500. A case of down the mountain and up the mountain if you will since the 2008 highs to current pricing conditions at 1404.

Once this E wave completes in the 1425-1445 ranges (With an outside shot at an extension blast to 1495) we should expect a fairly significant correction of the entire move from March of 2009. This final rally leg could top anytime between Aug 13th and August 22nd as I last updated, with potential to spill over into early September.

A close over 1409 will confirm the “E wave” has begun in earnest and you may want to buckle up, as it could be the final blast before some rains begin to pour in the fall.

If you’d like to be up to date on the daily and weekly views of the SP 500 and GOLD and Silver, get a discount at Market Trends Forecast.com or sign up for our free weekly reports.