Showing posts with label Fibonacci. Show all posts

Sunday, February 7, 2021

Mid-Caps & Transportation Show Upside Targets For Next Rally

An important technical conclusion stemming from the recent volatility spike is that prices must continue to push higher, above previous highs, in order to confirm the continued upside price expectations. 

The recent volatility spike and downside rotation in the US major stock market were big enough to reset many trending systems and prompt new upside price targets. In this research article, I will share our targets on the Mid-Caps and the Transportation ETFs to show you want we expect from the potential rally.

IWM Breakout Above $218.35 Suggest Rally is Just Starting

The IWM, the Ishares Russell 2000 ETF, Daily chart highlights the recent rotation in price and shows a Fibonacci price extension range from the late December 2020 lows to the recent late January 2021 highs. I use these Fibonacci price extensions as a means of measuring potential upside or downside price targets, which seem to be fairly accurate. Watching what happens near the 61.8% level on the chart will guide us in determining if the 100% target level will be reached quickly or after a bit of consolidation....Read More Here.


Saturday, October 3, 2020

Massive Dark Cloud Cover Pattern Above Critical Support - Will It Hold?

Research Highlights.... 
  • A Dark Cloud Cover pattern is a Japanese Candlestick Pattern that is typically associated with major top setups.
  • Critical Support on the SPY highlighted by multiple technical analysis strategies suggests 335~335.25 is acting as a major support level.
  • If price stays below the $339.95 level, then we interpret the trend as being Bearish. If price moves above the $343.55 level, it is Bullish.
Critical Support on the SPY (SPDR S&P500 ETF) highlighted by multiple technical analysis strategies suggests 335 - 335.25 is acting as a major support level. The rally in the markets that started late Sunday and carried forward into early trading on Monday, September 28, 2020, suggests the market is attempting to rally above this support level to establish a potential momentum base. 

My advanced price modeling systems and Fibonacci Price Amplitude Arcs (originating from the 2009 bottom) have clearly identified this area as a critical resistance/support zone....Continue Reading Here


Stock & ETF Trading Signals

Monday, September 7, 2020

Traders Dreams Come True - Big Technical Price Swings Pending on the SP500

Research Highlights....

* A potentially critical price inflection point and technical
   pattern setup that has nearly completed and validated over
   the past few days, weeks, and months.

* Potential flag/pennant formation on our Custom Valuations
   Index Weekly Chart shows a possible 11% to 16% 9 or  
   more) downside price correction in SPY.

* Fibonacci Price Modeling system’s projects SPY downside
   target level near $284.50 before a bounce.

Over the past few weeks and months, my team and I have published a series of research articles suggesting the continued market melt up was driven by speculation and the U.S. Fed’s policies and support for the markets. We’ve also highlighted a number of technical patterns that have setup within various symbols that have generated strong warnings of a potential price reversal over the past few weeks. The biggest pattern has been the Head-and-Shoulders price patterns. The sudden downside price move in the NASDAQ, and other markets, last week caught many traders/investors off-guard. One day after a very strong rally in the US stock markets, the price reversed and sold-off nearly 6% – a shocking reversal of trend. Red Skys in the mornings – Sailors Take Warning....Continue Reading Here.


Stock & ETF Trading Signals

Friday, June 5, 2020

Gold & Silver “Washout” - Get Ready for a Big Move Higher

Gold and Silver moved lower early on June 2nd and 3rd. Our research team believes this is a “Washout Low” price rotation following a technical pattern that will prompt a much higher rally in precious metals. This type of washout price rotation is fairly common before very big moves after Pennant/Flag formations or just after reaching major price trigger levels.

With Gold, a sideways Pennant/Flag formation has been setting up near our GREEN Fibonacci Price Amplitude Resistance Arc. We believe the downward price rotation recently is a perfect setup for skilled technical traders to take advantage of lower entry price levels. The GREEN Fibonacci Price Amplitude Arc will very likely be breached over the next 5 to 10 trading days and the price of Gold should rally well above $1850 in the process. We believe this Washout Rotation is a process of running through the Long Stops just below recent price activity that will end with a defined upside price rally over the next 2 to 5+ weeks.

Before we continue, be sure to opt-in to our free market trend signals 
 before closing this page, so you don’t miss our next special report!


Silver has set up a completely different type of price pattern – a true Double-Top pattern. The downward price rotation recently in Silver is indicative of a weaker reaction to this massive resistance pattern and Double-Top. The likelihood that Silver will find support above $17 and mount a further upside price rally over the next 2 to 5+ weeks is still very strong. After the deep downward price collapse in Silver took place, just like what happened in 2009 and 2010, the upside potential for Silver is still massive – likely targeting $65 per ounce of higher.


This current Gold to Silver Ratio Monthly chart highlights the recent collapse in the ratio level as Silver rallied from near $12 towards current levels near $18. A similar spike in the Gold to Silver Ratio took place in 2008-09 – just before the broader market collapse in the US and Global markets took place. This happens as the initial reaction to risk in the global markets pushes Gold prices a bit higher while Silver, the often overlooked store of value, typically declines in value.

Once the price of Silver starts to rally, pushing the Gold to Silver ratio below 60 typically, both Gold and Silver start to align in price and begin to rally together. The current level of the Gold to Silver ratio is 94.9. This suggests that both Gold and Silver have quite a way to go in terms of reaching the “alignment phase”. Our researchers believe Gold will rally above $2100 to $2400 and Silver will rally above $40 to $50 before the two metals align and begin to rally together in almost equal strength.


Concluding Thoughts

Pay attention to what happens to precious metals over the next 10 to 15+ days. If our research is correct, both Gold and Silver will rally higher by about 7.5% to 14% – setting up new price highs for both metals. When the washout pattern completes, usually a fairly aggressive price trend begins where new price highs are established fairly quickly. Get ready, this should be a really nice upside price swing in precious metals over the next 6+ months or longer.

The next few years are going to be full of incredible opportunities for skilled traders and investors. Huge price swings, incredible revaluation events, and, eventually, an incredible upside rally will start again.

I’ve been trading since 1997 and I’ve lived through numerous market events. The one thing I teach my members is that risk is always a big part of trading and that’s why I structure all of my research and trading signals around “finding profits while reducing overall risks”. Sure, there are fast profits to be made in these wild market swings, but those types of trades are extremely risky for most people – and I don’t know of anyone that wants to risk 50 or 60% of their assets on a few wild trades.

I’m offering you the chance to learn to profit, as I do with my own money, from market trends that I hand-pick for my own trading. These are not wild, crazy trades – these are simple, effective, and slower types of trades that consistently build wealth. I issue about 4 to 8+ trades a month for my members and adjust trade allocation based on my proprietary allocation algo – the objective is to gain profits while managing overall risks.

You don’t have to spend days or weeks trying to learn my system. You don’t have to try to learn to make these decisions on your own or follow the markets 24/7 – I do that for you. All you have to do is follow my research and trading signals and start benefiting from my research and trades. My new mobile app makes it simple – download the app, sign in and everything is delivered to your phone, tablet, or desktop.

I offer membership services for active traders, long term investors, and wealth/asset managers. Each of these services is driven by my own experience and my proprietary trading systems and modeling systems. I have a small team of dedicated researchers and developers that do nothing but research and find trading signals for my members. Our objective is to help you protect and grow your wealth.

Please take a moment to visit The Technical Traders to learn more. I can’t say it any better than this… I want to help you create success while helping you protect and preserve your wealth – it’s that simple.

Chris Vermeulen
Chief Market Strategist
Founder of the Technical Traders 


Friday, November 29, 2019

100% Measured Moves May Signal a Top

One type of Fibonacci price structure we use to attempt to measure price trends and identify potential tops/bottoms is the “100% Measured Move” structure. This is a price structure where a previous price move is almost perfectly replicated in a subsequent price trend after a brief period of retracement or price correction. These types of patterns happen all the time in various forms across multitudes of symbols to create very solid trading signals for those that are capable of identifying trends and opportunities using this technique. If you want my daily analysis and trade ideas, be sure to get my updates by joining my free trend signals email list.

The first thing we look for is a strong price trend or the initially confirmed reversal of a price trend. We find that these trending price ranges and initial “impulse trends” tend to prompt 100% measured moves fairly accurately. The explosive middle trend is where one can’t assume any type of Fibonacci 100% measured move will happen. Those explosive moves in a trend that tend to happen in the middle of a price trend are what we call the “expansion wave” of a trend and will typically be 160% or more the size of the initial impulse trend.

These trade setups we call the “100% measured moves” are naturally occurring price rotations that skilled traders can use to identify strong trade potential setups. They are more common in rotating markets where a moderate trend bias is in place (for example in the current YM or ES chart).

First, let’s take a look at this YM Weekly Chart to highlight the most recent 100% Measured Move. The original upside price move between June 2019 and July 2019 resulted in a 2787 point price rally that replicated between August 2019 and November 2019 – after a brief price retracement. Currently, price is rotating near the peak of this 100% measured price move near 27,875 while attempting to set up a new price trend.


In this ES Weekly example chart, we see a 100% Measured Move that originated in June 2019 and ended in July 2019 – just like on the YM chart. Although the completion of the 100% measured move didn’t originate until the low that formed before price rallied to take out the previous high near 3029.50. Remember, the other facets of Fibonacci price theory are also still at play in the markets while these 100% Measured Moves are taking place. Thus, rotation between a previous price peak and valley (without establishing any new price highs or new price low) are considered “price rotation” – not trending. The 100% Measured Move that did take place recently did complete a full 100% advancement and is now stalling near the 3040 level peak.


If you are not familiar with some of my forecasting and trading strategies for trading the S&P 500, or my gold trading signals be sure to click those links to see some pretty interesting charts like these.

SP500 Index Trend Identification and Trade Signal System


Cycle and Price Prediction System


Concluding Thoughts

Once these 100% measured moves complete, price usually attempts to stall or wash out a bit before attempting to establish a new price trend. At this point, given the examples we’ve illustrated, we believe the US market will enter a period of rotation and moderate volatility as these 100% measured moves have completed the upside price advance for now. Some level of price rotation after these 100% measured moves have completed will potentially allow for another attempt at a future 100% price advance after setting up a new price leg.

These techniques don’t always work, we recently got stopped out on a TVIX (vix/volatility trade for a loss) but we just close out our thirst natural gas trade for a quick 7% profit. The previous UGAZ trade netted 20%, and the one before that was 7.95%.

I can tell you that huge moves are about to start unfolding not only in metals, but stocks, and currencies. Some of these supercycles are going to last years. Brad Matheny goes into great detail with his simple to understand charts and guide about this. His financial market research is one of a kind and a real eye-opener. PDF guide: 2020 Cycles – The Greatest Opportunity Of Your Lifetime

As a technical analysis and trader since 1997, I have been through a few bull/bear market cycles. I believe I have a good pulse on the market and timing key turning points for both short term swing trading and long term investment capital. The opportunities are massive/life changing if handled properly.

I urge you to visit my Wealth Building Newsletter and if you like what I offer, join me with the 1 or 2 year subscription to lock in the lowest rate possible with our BLACK FRIDAY offer, PLUS get a FREE BAR OF GOLD and ride my coattails as I navigate these financial markets and build wealth while others lose nearly everything they own during the next set of crisis’.

Chris Vermeulen
The Technical Traders


Stock & ETF Trading Signals

Sunday, September 8, 2019

Can Crude Oil Stay Above $50 to Support Producers Expectations

Recent news suggests that oil producers are attempting to increase production levels after failing to attempt to push prices higher by cutting production levels. Globally, oil producers want to see oil prices rise above $65 ppb in an effort to support profit and production cost expectations. The real issue for the nation/states that rely on oil production/sales is that the global economy may not cooperate with their expectations over the next 24+ months.

On August 6th, 2019, we posted this article suggesting that Natural Gas and Crude Oil were setting up diverging trades.

August 6th, 2019: Natural Gas and Crude Oil – Diverging Setups for Technical Traders

At that time, we wrote that we expected Crude oil to break lower from the $62 ppb level and target $55, then $49 based on our original Crude Oil research from May 21, 2019.

Additionally, on July 29, 2019, we authored and posted this article suggesting that Crude Oil would begin a downside move from $55 to levels near $50 :

All of this research was related to our Adaptive Dynamic Learning (ADL) research post from July 10, 2019: Predictive Modeling Suggest Oil Headed Much Lower by Early 2020

This incredible predictive modeling research suggested that Oil would move dramatically lower towards the $50 level, then stall near $50 to $55+ through September and October. Ultimately breaking lower in late October/November to levels near or below $40.

Crude Oil Daily Chart Analysis

Our researchers believe Crude Oil could become very volatile as price nears the apex of the Pennant/Flag formation that is setting up. This Daily chart highlights the attempted “scouting party” price rotation above the price resistance channel. The news over the past holiday weekend suggests the global economy may not see any real bump in activity over the next 12+ months and we believe this aligns with our longer-term research that Oil should target the sub $40 price level before the end of 2019 and potentially fall to levels below $30 in early 2020.


Crude Oil Weekly Chart Analysis

We believe the key to all of this price rotation is the $50.50 level and what price does over the next 30 to 60+ days. There is a potential that price may attempt a brief upside move over this span of time, but the true intent of price is to move lower based on our ADL price modeling system. Therefore, we believe the downside potential is the most opportunistic for traders. The next price target based on our Fibonacci bearish price trigger level is the $45 price range.


Concluding Thoughts

This move could take place quickly, over the next 2 to 3 weeks on a breakdown move, or over many months. Watch the $50.50 level as that is the key. If the price falls to any level below $50.50, then we could be moving towards the $45 level or even the $40 on a big move related to global economic expectations. Otherwise, expect the price to move towards the $50.50 level over the next few weeks as this support level is key to all future moves.

As we wait for the next leg to start to move prices lower, pay attention to any upside price activity as that may present a very clear entry point for skilled technical traders.

We believe our super-cycle research and other proprietary modeling systems are suggesting that price weakness will dominate the markets for the next few months. Ride my coattails as I navigate these financial market and build wealth while others lose nearly everything they own during the next financial crisis and recession.

In short, you should be starting to get a feel of where commodities and asset class is headed for the next 8+ months. The next step is knowing when and what to buy and sell as these turning points take place, and this is the hard part. If you want someone to guide you through the next 12-24 months complete with detailed market analysis and trade alerts (entry, targets and exit price levels) join my ETF Trading Newsletter.

Free Gold or Silver with Subscription!


Chris Vermeulen
The Technical Traders


Stock & ETF Trading Signals

Sunday, June 23, 2019

How to Time Market Tops and Bottoms

On this first full weekend of Summer, we thought we would revisit our June 3, 2019 research post regarding a price pattern we love to trade – the Fibonacci Extension Bounce. This pattern sets up fairly often and the key to understanding this pattern and where these trades present real opportunity is in understanding the price dynamics behind these extensions. There are many instances where a Fibonacci price extension level will fail to promote a price bounce or rebound – and the price will just keep trending higher or lower past the extension level.

You can read our original research post here that clearly shows the bottom and our price targets.

Pay very close attention to the price levels and setups of the charts within that June 3, 2019 post. These setups are based on what we term a “100% Fibonacci Extension” from a previous trend reversal (peak or valley). The concept of this trading pattern is that the initial “impulse” price move sets up the first leg of a move. The retracement price move sets up the entry trigger for the second price leg – the next 100% price leg. The bottom, in this case, of the second 100% price leg sets up the “end of the move” and the potential for a price rotation in the opposite direction (likely resulting in a 38% to 61%+ retracement move).

In both instances of our June 3 calls, Crude Oil and the ES followed through exactly as we predicted.

This first chart of Crude Oil shows how price bottomed near $52 and has recently advanced to levels near $58 after reaching the 100% Fibonacci extension levels. As this move higher extends to levels near the ORANGE moving average line on this chart and/or beyond the $58 to $59 target level we originally drew on our June 3rd charts, we would consider the upside price move “completed” based on our expectations. Yes, these types of trend could extend even further beyond our expectations. But our objective, as skilled traders, is to target and profit from the highest probability objectives – which was the move from $52 to near current price levels.

Follow the MAGENTA lines on these charts to see the Fibonacci Extension Pattern Setup. They are not hard to see on the charts when your eyes are trained to identify them.


This ES Daily chart shows the incredible +230 point rally that took place after our June 3 research post and after the Fibonacci extension pattern completed. It is really hard to miss the opportunity with a move like this. Again, follow the MAGENTA lines on this chart to see the Fibonacci Extension pattern setup.

At this point on the ES chart, the upside price rally has resulted in a 161% (roughly) upside price advance of the previous Fibonacci Extension pattern (last leg). This upside price leg range, 161%, suggests the upside price move should be close to ending soon. There is a possibility that price could advance to levels near 200% of the previous price leg range, but traders would be chasing a 25% further upside advance that may only be a low probability outcome.


Our advice for skilled traders is to pare back existing open long trade positions near these new all-time highs. The price advance appears to have reached levels that suggest the upside advance may be nearing an end point for the US stock markets. After such a big upside price leg, we have to be cautious near these new all-time highs that further price rotation may become a concern.

Oil, on the other hand, could continue to rally because it has only advanced 61% of the last Fibonacci 100% price leg. The global concerns regarding Iran and the US, as well as global economic concerns, could push Oil back up to the $60 to $62 level before reaching a peak.

Over the past 21+ months, we’ve highlighted some of the best tools and techniques we use to find great trading signals. This one technique, the Fibonacci 100% Price Expansion Leg, is just one of the tools we use to find trades and targets for our trade alerts for members.

The more one understands how price works and how the markets operate as a Symphony of price actions, one can find opportunities for great trades almost all the time. Skill and experience make the difference when deciding when to trade and what to trade and that’s what we provide.


We’ve now shown you two different price setups using Fibonacci price theory and the only thing we have to do is wait for a technical price confirmation before finding our entry trade. We’ll see how this plays out over the next few days and weeks. Remember, we are not proposing these as “major price bottoms”. They are “upside pullback trades” (bounces) at this point. A bullish price pullback in a downtrend.


Stock & ETF Trading Signals

Tuesday, May 7, 2019

U.S. Stock Markets Could Rally Beyond Expectations

Late Sunday afternoon, President Trump surprised the global markets with the announcement of increased trade tariffs with China relating to the ongoing trade negotiations and delayed trade talks between the two global superpowers. The global markets reacted immediately upon the open Sunday night (Asian open). The VIX short position puts quite a bit of professional traders at risk of big losses today while those of us that were prepared for an increase in volatility and price rotation is poised for some incredible opportunities.

The U.S. stock market is set up for a price move that will likely make many people very wealthy while frustrating many others over the next few months. We’ve recently posted many articles regarding the 2020 U.S. Presidential election cycle and the fear cycle that comes from these major political events. In November 2016, we remember watching Gold rally $60 early in the election night, then fall $100 as news began reporting the surprise winner. There is so much capital, and future capital expectations that ride on these election cycles – it can actually drive the markets in one direction or another.

Get Our Free Market Research Right Here

Right now, we have two things we want to alert you to regarding our proprietary Fibonacci price modeling utility. First, the current trend is Bullish and the chance of a downside price move is still valid. Remember, one of the primary price rules within Fibonacci price theory is that price must ALWAYS attempt to seek out new highs and new lows – at all times. This means that once price establishes new price highs, any failure to continue establishing new price highs, through standard price rotation, will result in its price attempting to establish new price lows.

So, as we continue with our expectations, remember that any failure of price to continue the push higher means it WILL rotate lower and attempt to establish new price lows.

Taking a look at this IWM Monthly chart shows a very clear price rotation near the end of 2018 and that the current price has yet to rally above the October 2018 highs. In this instance, we have a FAILURE to establish new price highs within the current price move. We also have a new price low established in December 2018. This high and low sets up the range of $173.99 and $125.80. Fibonacci price theory tells us that PRICE WILL attempt to establish a new price high or new price low from within this range. Therefore, the price WILL either continue to rally higher and break the $173.99 level or price WILL reverse lower, without reaching the $173.99 level and target the $125.80 level.

Our modeling system is currently telling us that price and trend is bullish and that the current price level has clearly rallied above the Fibonacci price trigger levels near $143.50. Should price rotate lower and breach these Fibonacci price trigger levels, then we would expect the price to move much lower. Right now, we don’t expect that to happen based on a strong U.S. economy, employment and earnings.


This Monthly SPX chart shows a similar setup – yet the main difference is that the current HIGH PRICES are clearly above the October 2018 previous highs. Thus, in this instance the SPX has reached “new price highs” as a component of Fibonacci price theory and, because of this fact, must continue to strive for new price highs or risk failing and rotating lower to establish new price lows.

In fact, the past three trading sessions are proprietary SP500 index trading system issued two quick winning trades for members. The two trades pulled 2.5% and 2% out of the market in less than 24 hours from the entry prices. This momentum and trend trading system are going to be a new trading weapon for us to follow and trade the markets once we implement this into the member’s area for viewing the charts and signals at any time.

Take a look at last weeks trade and today’s trade which both hit T1 (Target 1).


Take a look at the chart below then consider what that last statement really means. It suggests that we have already reached into new price high territory. Fibonacci theory suggests that “once new price highs are established, the trend MUST continue to attempt to establish new higher price highs – OR FAIL and attempt to establish a new price low. Well, a failure at this level could mean a price move all the way back towards recent lows near December 2018 – near $2346.58. Therefore, it is critical that we see other markets, like the IWM, continue to push higher in an attempt to support this broader upside price move for all the U.S. major stocks.

The most important factor going forward is to be prepared to think and react very quickly to price rotations, news, and the election cycle process. Take a look at how volatile the market has become over the past 12 months and consider the fact that we could continue to see this type of volatility in the markets for the next 15+ months – at least through the election cycle process.

Remember also that the US economy is operating on very strong fundamentals, employment, and outputs. Disruption of future expectations could lead to a massive displacement of capital in the global markets. Watch crude oil, gold, silver and other commodities for any signs of weakness. And pay attention to the levels we are suggesting in this research post. If the SPX falls below $2600 – be prepared. If the IWM falls below $142 – be prepared. Price is always seeking out new price highs and new price lows. If it can’t get one side, it will attempt to get the other.


The global market “Shake out” that we wrote about weeks ago is just starting. Our expectations are that an increase in price volatility, as well as a minor price rotation, will take place in the U.S. markets before a continued upside price bias will drive prices higher again. There are two main drivers that will become leaders of any bigger rotation in the global markets – Metals and Commodities. If we begin to see a collapse in commodity prices, pretty much across the board, while metals breakout into a rally, then we are setting up for a bigger downside price move. Until that happens, continue to expect an upside price bias to continue in the U.S. stock market.

Secondly, should a massive currency revaluation event take place, where global currencies weaken as the U.S. Dollar stays strong, then we could be setting up for a “slow unraveling” of foreign debt markets and foreign equity markets. This would be almost like a “slow bleed out” as a currency devaluation event prompt incredible pricing pressures on local foreign governments to support their economies. These devaluation events, if they happen, could prompt a hyper inflation type of event that could disrupt weaker nations to such a degree that they could weaken world leading economies that have exposure to these foreign nations – Think China/Russia.

Our advice continues to be to look for opportunities as the volatility increases and continue to expect an upside price bias in the U.S. stock market – at least until we have any strong evidence that price trend has changed. Don’t buy into the doom-sayers just yet. In our opinion, this U.S. upside price move is not over yet.

If you want to become a technical trader and pull money from the markets during times when most others cannot be sure to join the Wealth Trading Newsletter today. Plus, for a few days only I’m giving away and shipping Free Silver Rounds to subscribers who join our select membership levels.

Chris Vermeulen @ The Technical Traders


Stock & ETF Trading Signals

Wednesday, May 1, 2019

How Close are the Markets from Topping?

Now that most of the U.S. Major Indexes have breached new all time price highs, which we called over 5+ months ago, and many traders are starting to become concerned about how and where the markets may find resistance or begin to top, we are going to try to paint a very clear picture of the upside potential for the markets and why we believe volatility and price rotation may become a very big concern over the next few months. Our objective is to try to help you stay informed of pending market rotation and to alert you that we may be nearing a period within the US markets where increased volatility is very likely.

Longer term, many years into the future, our predictive modeling systems are suggesting this upside price swing is far from over. Our models suggest that price rotation will become a major factor over the next 12 to 15+ months – headed into the U.S. Presidential election cycle of November 2020. Our models are suggesting that the second half of this year could present an incredible opportunity for skilled investors as price volatility/rotation provide bigger price swings. Additionally, our models suggest that early 2020 will provide even more opportunity for skilled traders who are able to understand the true price structure of the markets. Get ready, thing are about to get really interesting and if you are not following our research or a member of our services, you might want to think about joining soon.

We are focusing this research post on the NQ, ES and YM futures charts (Daily). We will include a longer term YM chart near the end to highlight longer-term expectations. Let’s start with the NQ Daily chart.

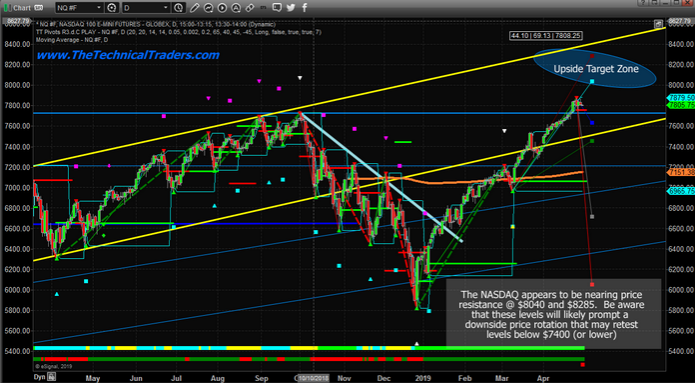
The NQ Daily chart, below, highlights our ongoing research, shows the 2018 deep price rotational low and the incredible rally to new all time highs recently. The most important aspect of this chart is the “Upside Target Zone” near the $8040 level and the fact that any rally to near these levels would represent an extended upside price rally near the upper range of the YELLOW price channel lines. We believe any immediate price rotation may end near the $7500 level (between the two Fibonacci Target levels near $7400 & $7600) and could represent a pretty big increase in price volatility.


This ES Daily chart highlights the different in capabilities between the NQ and the ES. While the NQ is already pushing into fairly stronger new price highs, the ES is struggling to get above the Sept/Oct 2018 highs and this is because very strong resistance is found between $2,872 and $2,928. It is very likely that the price volatility will increase near these highs as price becomes more active in an attempt to break through this resistance. It is also very likely that a downside price rotation may happen where price attempts to retest the $2,835 level (or lower) before finally pushing into a bigger upside price trend. The Upside Target Zone highs are just below $3,000. Therefore, we believe any move above $2,960 could represent an exhaustion top type of price formation.


This YM chart is set up very similarly to the ES chart. Historical price highs are acting as a very strong price ceiling. While the NQ is already pushing into fairly stronger new price highs, the YM continues to struggle to get above the Sept/Oct 2018 highs and this is because very strong resistance is found between 25,750 and 27,000. Please take notice of the very narrow resistance channel (BOX) on this chart that highlights where we believe true price support/resistance is located. We believe it is likely that a downside price rotation may happen where price attempts to retest the $26,000 level (or lower) before finally pushing into a bigger upside price trend.


As you can tell from our recent posts and this research, we believe price volatility is about to skyrocket higher as price rotates downward. Our predictive modeling systems are suggesting that we are nearing the end of this current upside move where a downward price move will establish a new price base and allow price to, eventually, push much higher – well above current all-time high levels.

We’ve issued research posts regarding Presidential election cycles and how, generally, stock market prices decline 6 to 24 months before any US Presidential election. We believe this pattern will continue this year and we are warning our followers to be prepared at this stage of the game. No, it will not be a massive market crash like 2008-09. It will be a downside price rotation that will present incredible opportunities for skilled traders. If you want more of our specialized insight and analysis, then please visit The Technical Traders to learn how we help our members find success.

Lastly, we’ve included this Weekly YM chart to show you just how volatile the markets are right now. Pay very close attention to the Fibonacci Target Levels that are being drawn on this chart. The downside target levels range from $16,000 to $21,060. The upside target levels range from $30,000 to $32,435. Top to bottom, The Fibonacci price modeling system is suggesting a total volatility range of over $16,000 for the YM Weekly chart and this usually suggests we are about to enter a period of bigger price rotation and much higher price volatility.


Right now, we suggest that you review some of our most recent posts to see how we’ve been calling these market moves, visit The Technical Traders Free Research. It is important for all of our followers to understand the risks of being complacent right now. The markets are about to enter a period of about 24+ months where incredible opportunities will become evident for skilled traders. If you know what is going to happen, you can find opportunities everywhere. If not, you are going to be on the wrong side of some very big moves.

Chris Vermeulen


Stock & ETF Trading Signals

Wednesday, April 17, 2019

Watch the Financial Sector for the Next Topping Pattern

A very interesting price pattern is setting up in the financial sector that could lead to a very big move in the US & Global markets. Remember how in 2008-09, the Financial sector and Insurance sector were some of the biggest hit stock sectors to prompt a global market crisis? Well, the next few weeks and months for the financial sector are setting up to be critical for our future expectations of the US stock market and global economy.

Right now, many of the financial sector stocks are poised near an upper price channel that must be breached/broken before any further upside price advance can take place. The current trend has been bullish as prices have rallied off the December 2018 lows. Yet, we are acutely aware of the bigger price channels that could become critical to our future decision making. If there is any price weakness near these upper price channel levels and any downside price rotation, the downside potential for the price is massive and could lead to bigger concerns.

Let’s start off by taking a look at these Monthly charts

This first Monthly Bank Of America chart is best at showing the price channel (in YELLOW) as well as a key Fibonacci price level (highlighted by the MAGENTA line). We’ve also highlighted a price zone with a green shaded box that we believe is key support/resistance for the current price trend.

As you can see from this chart, since early February 2018, the overall trend has shifted into a sideways bearish trend. The price recovery from December 2018 was impressive, yes, but it is still rotating within this sideways/bearish price channel. Our belief is that this YELLOW upper price channel level MUST be broken in order for the price to continue higher at this point. Any failure to accomplish this will result in a price reversal that could precipitate a 30% price decline in the value of BAC. In other words, “it is do-or-die time – again”.


This Monthly JPM chart shows a similar pattern, yet the price channel is a bit more narrow visually. We have almost the same setup in JPM as we do in BAC. The same channels, the same type of Fibonacci price support level, the same type of sideways price support zone (the shaded box) and the same overall setup. As traders, we have to watch for these types of setup and be aware of the risks that could unfold with a collapse of the financial sector over the next few weeks.

We believe the next few weeks could be critical for the financial sector and for the overall markets. If weakness hits the financial sector as global growth continues to stagnate we could enter a period where the global perception of the future 12~24 months may change. Right now, perception has been relatively optimistic in the global stock markets. Most traders have been optimistic that the markets will recover and a US/China trade deal will get settled. The biggest concern has been the EU and the growth of the European countries.

What if that suddenly changed?


We are not saying it will or that we know anything special about this setup. We are just suggesting that the Monthly charts, above, are suggesting that price will either break above this upper price channel or fail to break this level and move lower. We are suggesting that, as skilled traders, we need to be acutely aware of the risks within the financial sector right now and prepare for either outcome.

This last chart, a Weekly FAS chart, shows a more detailed view of this same price rotation and sideways expanding wedge/channel formation. Pay very close attention to the shaded support channel shown with the GREEN BOX on this chart. Any price rotation within this level should be considered “within a support channel” and not a real risk initially. We want to see price break above the upper price channel fairly quickly, within the next 2 to 5+ weeks, and we can to see it establish a new high (above $78 on this chart) to confirm a new bullish price trend. Once this happens, we’ll be watching for further price rotation and setups. If it fails to happen, then the RED DOWN ARROW is the most likely outcome given the current price setup.


Any downside price move in the Financial sector would have to be associated with some decreased future expectations by investors. Thus, our bigger concern is that something is lurking just below the surface right now that could pull the floor out from under this sector. Is it a surprise Fed rate increase? Is it some news from the EU? Is it a sudden increase in credit defaults? What is the “other shoe” – so to say.

Be prepared. If all goes well, then we’ll know within a few more weeks if the upside price rally will continue or if we need to start digging for clues as to why the support for the financial sector is eroding. This really is a “do or die” setup in the financial sector and we urge all traders to pay very close attention to this sector going forward. We believe it will be the leading sector for any major price weakness across the global markets.

Do you want to find a team of dedicated researchers and traders that can help you find and execute better trades in 2019 and beyond? Please visit The Technical Traders to learn how we can help you prepare for the big moves in the global markets and find better opportunities for greater success in the future. Our team of researchers and traders continue to scan the markets for new trades and incredible research for all our members and followers.

Chris Vermeulen

Monday, February 18, 2019

Here We Go - Get Ready for the Breakout Pattern Setup

We are writing this post today with a few forward-looking expectations while attempting to warn traders that some extended rotation is likely to enter the markets over the next 30+ days. If you’ve been following our research, you’ll know that we’ve been calling these move months in advance of other researchers and analysts. Our September 17, 2018 research post highlighting our Adaptive Dynamic Learning predictive modeling system suggested the U.S. stock markets were poised for a massive price rotation followed by a very unique price setup that we are experiencing now.

Currently, the YM (Dow Futures Contracts) are leading the pack on a dramatic upside breakout move. This is likely a result of the US government spending bill that is recently working its way towards approval and the fact that this new spending bill clears the way for at least 8+ months of uninterrupted market optimism (or at least we hope). This 300+ point upside move clearly breaks price highs and puts the U.S. stock market, at least the Dow/Blue-Chips, back into “new high trending mode”. As many of you are likely aware, our Fibonacci price study teaches us that price must ALWAYS seek to establish new price highs or new price lows AT ALL TIMES. Thus, these new price highs are a very strong indication that the upside trend is dominant and should continue for a while.


Additionally, we want to highlight what we believe will be a similar price pattern to 2015/2016 in the U.S. markets – a multiple Price Wedge formation that could ultimately set up another price leg (which we believe will be higher, to the upside, at this time).

In the next article “PART II” pay close attention to the charts and images as we are attempting to clearly illustrate how and why price rotation is about to hit the US markets and why you need to be prepared for this move.

We continue to read that large amounts of capital are sitting on the sidelines or have been pulled from the markets over the past 12+ months. We understand this as the rotation in early 2018 frightened many investors and the continued sideways price action, global market concerns and geopolitical issues have caused international investors to want to protect their investments from risk – thus they move their capital into cash. We get it. But we also believe the next breakout in the U.S. markets will be a great opportunity for skilled traders to identify and prepare for an incredible profit potential no matter which way the market breaks up or down because technical analysis allows us to closely follow the direction of the market.

The amount of capital that is sitting on OUTSIDE the markets, currently, represents a massive amount of resources that could re-enter the markets when traders/investors decide the timing is right. We’ve termed this a “Capital Shift”.

In simple terms, it reflects capital/cash moving from one market to another or from actively invested to cash, then back to actively invested. Our belief is that capital operates in a manner to always protect itself from risk while attempting to identify suitable returns. The best environment for capital is always a relatively safe investment with protective values and a high probability of decent returns. Therefore, this massive amount of capital not being deployed in the global markets will, at some time, re-enter the markets and will likely increase pricing valuations.

How and when will this capital re-enter the markets? What will price activity look like and how will we know when the timing is right for our own strategic deployment of our trading capital? Continue reading to learn why we believe we are only 30~45 days away from an incredible trading setup. You won’t want to miss this one.

Please take a minute to visit The Technical Traders to learn how we can help you find and execute better trade in 2019 and stay ahead of these market moves. We are confident that you will find our Daily Video, Detailed Market Research, Proprietary Research Tools and Detailed Trading Signals will help you make 2019 an incredibly successful year.

Chris Vermeulen
Technical Traders Ltd.


Stock & ETF Trading Signals

Wednesday, January 2, 2019

Silver Starts a Breakout Move Higher

Watch Silver, folks. This quiet shiny metal is starting a move that could be very foretelling of global market concerns and risks. Early on December 26, 2018, Silver broke through recent resistance, to the upside, with a relatively large 2.8%+ upside move. Why is this so important to traders? Because Silver is the “sleeper metal” that is typically the last to react to global economic concerns. Once Silver starts to move to the upside with a renewed bullish trend, we believe this move would indicate that bigger players are starting to accumulate Silver as a safe haven for future economic concerns/crisis events.

This Daily chart of Silver shows the December 26 upside breakout move. We can clearly see the breakout above $15.00 and the historical resistance just below $15.00. This move is extremely important in the context of the total risk play that has recently played out through the past two months. Take a look as how quiet the Silver market has been over the past few months. Take a look at how Silver reacted only moderately to the recent market selloff and Fed statements. There was no real “fear” exhibited in the metals markets or in Silver over the past 60+ days. Yet, today, there is some real fear that is playing out in the price of Silver.


This next Weekly Silver chart helps us to understand the total scope of this move and what we could expect to see as an immediate upside price target. Our Adaptive Fibonacci Price modeling system is suggesting that $16.00 is an immediate upside price target and is showing us the current trend is bullish and that price volatility is increasing. Overall, we could see a move well above $17.00 on an extended run in the metals.


Watch how this “sleeper metal” plays out over the next few weeks and months. This upside breakout is very important to investors for the simple reason that it indicates a renewed level of “fear” is entering the markets and we could be starting a very big upside move in the metals markets again. The last time Silver entered a massive bullish phase it shot up over 400%. If a similar move happens again in the near future, Silver could reach a price level near $60-65 per ounce.

Want to know how to position your investments to take advantage of these types of moves and learn how to capture greater opportunities in the markets? 2019 is setting up to be an incredible year for traders with the skills and insight to find and execute these types of trades. We have already been positioning our members for this move and we believe 2019 will provide incredible opportunities for all skilled traders. Take a minute to visit The Technical Traders to learn how we can help you in 2019 and join our other members in finding greater success.


Check Out Our Trading Strategy Mastery 3 Hour Video Course....Right Here


Stock & ETF Trading Signals

Tuesday, January 1, 2019

What to Expect Within the First 3 to 5 Months of 2019

As we put an end to 2018 we watched the incredible price rotation in the U.S. stock market. Now it is time for traders to take stock of the incredible opportunities that are set up for early 2019 and beyond. Our research team, at The Technical Traders, has put together some truly incredible longer term Adaptive Dynamic Learning (ADL) predictive price modeling system charts that will help you understand and identify incredible opportunities that should play out in early 2019. We know you will not find this type of analysis anywhere else on the planet and we know just how valuable these charts are too skilled traders. So, get ready for some incredible moves – as impossible as they may seem.

Let’s get started with crude oil. This Monthly chart of Crude showing our ADL price modeling system is clearly indicating the first few months of 2019 will include increased price volatility. One thing to pay attention to as we review these charts are the BLUE TRIANGLES, which is where we asked the ADL predictive modeling system for a detailed analysis, and the CYAN, YELLOW, and WHITE DASHED LINES, which is where the ADL system is showing us the highest probability price outcome into the future. On this chart, we can see that the predicted price levels of the past have been relatively close to where the price has closed on each monthly price bar.

Going into the future, we can see 3 to 4 months of price volatility between $50 and $65 (roughly) with rotating higher/lower price objectives. We interpret this as greatly increased price volatility with the potential of supply events disrupting global expectations in oil. These could be intermediate term price rotations that keep the price within our $50-65 price range, or they could be large range, very dramatic price rotations as a result of massive global supply events.

What we can suggest to you, today, is that early 2019 should provide some very interesting short to intermediate term price triggers in oil before price settles back below $50 near June or July 2019.


Next, the Financials/Banks appear to be setting up a very deep “price anomaly” pattern that could become one of the biggest price reversals of early 2019. It is not very often that a 90%+ price move sets up in the markets and this could be just such an event. The ADL predictive price modeling system identifies the highest probability price outcomes by mapping and tracking price and technical setups. You can see from this chart we are asking the ADL modeling system to show us what to expect from the February 2018 price bar.

This price bar is critical because it was a wide range price rotation setup that should be very unique in the ADL DNA mapping. This bar only had 5 similar DNA markers and projected some of the predicted price level, the ones drawn in WHITE, as 50/50 outcomes. The last few outcomes, drawn in YELLOW, reported as 100% probabilities for these predicted target price levels. Therefore, we consider this a very high probability outcome of a very deep “price anomaly” setup that should result in some incredible upside opportunities for skilled traders.

Additionally, if this analysis is correct, the U.S. stock market may, very quickly, rally to attempt to establish new all time highs again in early 2019. This move could happen well before May or June 2019. Be prepared for this move because, currently, there are a bunch of shorts that are predicting a 1929 style market crash. Those shorts are going to get crushed in a massive short squeeze if our ADL predictive modeling results are accurate.


Next, we’ll review the SPY Monthly chart. And, as you can likely see, this chart is similar to the FAS chart above with a very deep price anomaly setup. In fact, you are going to see a few of these types of price anomaly trigger setups in this research post because the very deep downside price move, recently, has prompted these types of price triggers. One thing to consider about price rotation and the recent downside price move is that these types of price swings are very healthy for the overall markets. They act as a method of re-confirming value, support and future expectations by devaluing/deleveraging over extended price levels and shaking up the markets. We think of these types of moves as a “healthy price rotation” that allows the markets to re-establish value and future expectations vs. a type of crisis event.

In addition to this being a very healthy price rotation, we also believe, fundamentally, very little has changed in the past 4+ months in regards to global market events. Europe and China/Asia are still working through their own issues. Credit cycles and global market valuations have been decreasing since early 2018. Overall, the global markets have decreased in value by over 27% since January 2018.

What many traders have failed to understand is that the U.S. markets broke lower on a reaction to the U.S. Fed’s recent rate raises while the rest of the global markets had already experienced a 24% valuation decline. In other words, the U.S. markets broke lower in “capitulation” of expectations that the U.S. Fed may have pushed rates beyond expected boundaries. Now that the U.S. markets have revalued near these recent lows and 2019 is about to start, new expectations are settling into traders minds regarding the current market values and future expectations.

Back to our ADL chart of the SPY, you can see the predicted levels of the ADL system matching with price bars fairly accurately. The current bar, the big red one, is reported as a “neutral probability” (WHITE) target price level which means the ADL system could not determine any viable probability for this price target. The following YELLOW price targets range from 57% probability to 94% probability going out 8+ months. Our interpretation of this is that the current price bar, being a neutral price target near $279.60 reports as a “basis price” in the range of previous price rotation. We believe this level, $279.60, will quickly be recovered in early 2019 before a continued rally pushes prices above $300 sometime around April or May 2019.


Next, one of our favorite charts to gauge the markets and the future expectations of market sectors, the Transportation Index. And, again, you can see a similar price anomaly setup on this chart. The one thing that is very interesting on this chart is that the current price target level for the December 2018 bar has a relatively high ADL probability (68.373%) and the next targeted price level (Jan 2019, near 11,210) has a very high 88.25% probability.

It is our opinion that the Transportation Index will rocket higher in early 2019 and reach levels above 10,800 before the end of March 2019 (possibly much earlier). The ADL predictive modeling system is suggesting that the Transportation Index will stay near 11,500 for much of 2019 and we believe the U.S. stock market and major indexes will reach new all time highs near the start of Q2 2019 and continue to push a bit higher through the middle of 2019.

It is very likely that the U.S. market continues to outperform many other global markets throughout much of 2019 and beyond. We’ve read many expectations that the U.S. markets may fall into some level of “complacency” in 2019, but we are not seeing that in our research. We are seeing the US markets continue to report pricing strength in comparison to other global markets and we believe the US economy will continue to stay strong throughout at least the first 2 to 3 quarters of 2019 – possibly much longer.

Again, this incredible opportunity for skilled traders is showing a potential +23% upside rally that should start in early 2019. Be prepared for some great trades in 2019.


Lastly, the US Dollar. With so many people expecting the US markets to push lower in 2019 and the resulting pressures on the U.S. Dollar (as some analysts expect the Yuan to strengthen while the US Dollar weakens), our ADL predictive modeling systems is suggesting that the US Dollar is currently undervalued by nearly 8%. The early 2019 ADL price targets are near or above $27.50 with the current price being near $25.50. This represents a 7.8% to 8.3% upside price anomaly if our ADL predictive price targets are accurate. This ADL trigger bar, where the BLUE TRIANGLES are on this chart, was a fairly rare price/technical pattern, or DNA marker. It is predicting a 100% probability of these price levels being accurate based on this rare DNA marker. We interpret that outcome as a breakout above $26 in UUP would help to confirm this ADL analysis and the potential that $27.50 to $28.00 is a viable longer term price objective.

Overall, we don’t see any reason to be bearish the U.S. Dollar at the moment. Our ADL predictive modeling system is suggesting the U.S. Dollar is currently undervalued by about 8% and is predicting early 2019 upside potential which indicates the potential for greater global currency volatility in the Euro, the Yuan, and other widely held currencies. If out ADL predictive pricing levels are accurate, it would indicate that we are going to see global currency pricing pressures hit many global currencies fairly early in 2019. Possibly, this could be related to some geopolitical event or some type of isolated credit market event (Italy, Spain, EU, China, Asia). Again, we don’t know what the event will be, but we can assure you that our ADL predictive modeling system is suggesting the U.S. Dollar will increase in value by about 8% in early 2019.


These incredible setups and opportunities for skilled traders can only be found with our proprietary Adaptive Dynamic Learning (ADL) predictive modeling tool. Call it a New Year’s gift or whatever you want to call it. Within this research article, we’ve shown you what we believe are some of the most incredible trading setups to start 2019 and we’re confident in our model’s ability to accurately find and call these moves. Want to learn what other setups our predictive cycle, Fibonacci and ADL systems are showing us? Want to know what the metals are going to do in 2019? Want to know which sectors are going to move and when? Visit The Technical Traders to learn how we help our members find and execute better trades.

Visit The Technical Traders Free Research to review some of our earlier research posts and to see how we’ve been calling these moves accurately for months.

Want to make 2019 a great year with incredible opportunities for success? Join our other members at The Technical Traders today and make 2019 an incredibly successful year.

Chris Vermeulen


Stock & ETF Trading Signals