Showing posts with label bonds. Show all posts

Thursday, February 25, 2021

Bonds And Stimulus Are Driving Big Sector Trends And Shifting Capital

Falling Bonds and rising yields are creating a condition in the global markets where capital is shifting away from Technology, Communication Services and Discretionary stocks have suddenly fallen out of favor, and Financials, Energy, Real Estate, and Metals/Miners are gaining strength. The rise in yields presents an opportunity for Banks and Lenders to profit from increased yield rates. In addition, historically low interest rates have pushed the Real Estate sector, including commodities towards new highs.

We also note Miners and Metals have shown strong support recently as the US Dollar and Bonds continue to collapse. The way the markets are shifting right now is suggesting that we may be close to a technology peak, similar to the DOT COM peak, where capital rushes away from recently high flying technology firms into other sectors (such as Banks, Financials, Real Estate, and Energy).

The deep dive in Bonds and the US Dollar aligns with the research we conducted near the end of 2020, which suggested a market peak may set up in late February. We also suggested the markets may continue to trade in a sideways (rounded top) type of structure until late March or early April 2021. Our tools and research help us to make these predictions nearly 4 to 5+ months before the markets attempt to make these moves....You Can Read This Research Here.


Friday, July 3, 2020

Wild Volatility Continues as U.S. Markets Attempt to Establish New Trend

We’ve continued to attempt to warn investors of the risks ahead for the U.S. and global markets by generating these research posts and by providing very clear data supporting our conclusions. Throughout the entire months of May and June, we’ve seen various economic data points report very mixed results – and in some cases, surprise numbers as a result of the deep economic collapse related to the COVID-19 virus event. This research post should help to clear things up going forward for most traders/investors.

As technical traders, we attempt to digest these economic data factors into technical and price analysis while determining where and what to trade. We attempt to identify the “Best Asset Now” (BAN) for trading based on our proprietary technical analysis and predictive modeling tools. We also attempt to stay away from excessive risks in the markets. The reason we adopt this strategy is to help protect assets and to attempt to assist our clients and followers in avoiding sometimes foolish trading decisions that can destroy your account and future.....Read More Here


Stock & ETF Trading Signals

Tuesday, May 5, 2020

I Truly Think This is the Best $149 You Will Ever Spend

If you have been following me for a while, then you know my analysis and trades are the real deal. You also would know that I made over $1.9 million from the financial markets during the 2008 crash and recover into 2010. I have been semi-retired since the age of 27. I continue to follow, predict, and trade the markets because its the ultimate business and my passion.

A bear market and its recovery can make your rich in a very short period. I believe this is about to happen again, so why not follow my super simple SP500 ETF investing strategy? Trade with your investment account and become a stock market success with me!

I'm offering my investing signals for the next few years to those who want to know their investment capital is in the asset. Let face it, there is a time to be 100% long stocks, to own an inverse fund, and when to sit in cash. Your financial advisor would NEVER recommend a cash position, why because he is not allowed, he and his firm will not make money. Instead, they will keep you long stocks, with some bonds, and you will have to ride out the bear market rollercoaster again.

During the March Market crash, the BEST position was cash for short term trades. EVERY asset fell in value (stocks, bonds, gold, commodities) two months ago. Only one asset rallied, guess what it was? The USD dollar (CASH), moving to USD cash, gained a whopping 11% while most indexes and sectors fell 35-80+%. All you had to do was close all positions in your portfolio, and you would have looked like a hero, and that's what I did with my account and members of my swing trading newsletter.

Follow me to success. Trade my most simple single ETF strategy and know when to own stocks, when to own an inverse ETF, or be in cash. For only $149 you can have the keys to the kingdom during a time when we are going to experience more historical price swings. This is as good as it gets, in my opinion.

Even if we don't enter a new bear market this year, my investing signals will still nail the bull market and make you a ton of money. This is the most affordable insurance plan for your retirement account, so you don't lose it - Period!


Sincerely,
Chris Vermeulen
Founder of The Technical Traders 


Stock & ETF Trading Signals

Monday, June 11, 2018

Here’s Why We See the G7, Central Banks and U.S. Fed Will Drive Stock Prices this Week

After last weeks closing bell for stocks and the early signs of the Capital Market Shift which we mentioned previously was taking place are now clearly evident. We wanted to alert all of our followers that this week could be very dramatic with a number of key events playing into global expectations.

Our research team at Technical Traders Ltd. have been combing through the charts trying to find hints of what may happen and what to expect in terms of price volatility next week. We know our ADL price modeling system is telling us that certain price weakness will continue in certain sectors and strength in others – but we are searching for the next opportunities for great trades.

One of the key elements of the G7 meeting is the continued communication regarding global participation in key infrastructure projects and national cooperation in regards to economic stability.

Over the past 8+ years, the bulk of the global recovery has been based on the US economic stability and recovery. US interest rates allowed for a global “carry trade” that supported a large component of the economic bias in foreign countries. Additionally, the deeply discounted U.S. bonds provided a “fire sale” opportunity for many countries to secure U.S. Treasuries at a time when global central banks were printing cash to support failing economies. Overall, the economic conditions from 2009 to 2015 were such that every opportunity was provided to the global markets to make it easier to attempt a proper recovery.

Some nations were able to capitalize on this environment while others squandered the opportunity to create future growth, capabilities and new opportunities for success. Given the current global market environment, we expect some harsh comments to come from the G7 meeting as well as some wishful thinking comments. Overall, we believe the outcome of the G7 meeting will become a defining moment for the remainder of the year in terms of global economic expectations and forward intent. It will certainly be interesting to see how these leaders decide to operate within the constructs of the ever changing global market liabilities to say the least.

Right now, a lot of concern has been directed towards the Emerging Markets and what appears to be a near term market collapse. Debt spreads and global indexes have been moving in a pattern that clearly illustrates the Central Banks problems in containing the diverse economic conditions throughout the globe. Infrastructure projects, social/political shifts and currency valuations are complicating matters by creating extended pressures in many global economies recently. All of this centers around the strength of the U.S. economy and the US dollar as related to expectations and valuations of other foreign economies and currencies.

Almost like a double edged sword, as the U.S. economy/dollar continues to strengthen, foreign capital will migrate into these US assets because of the inherent protection and gains provided by the strength and growth of these markets. While at the same time, the exodus of capital from these foreign markets create a vacuum of value/capability that results in a continued decline in asset valuations and more.

Almost like the 1994 Asian Currency Crisis, the more the US economy strengthens, the more pressures the global markets feel as valuations and assets become more risky to investors. As investors flee this risk, they search for safe returns and value that is found in the US economy/Dollar – driving US equities higher and strengthening the US Dollar. It is a cycle that will likely continue until some equilibrium point is reached in the future.

The US markets are on a terror rally because global capital is searching and seeking the greatest returns possible – and the only place on the planet, right now, that is offering this type of return is the US economy and the US equities market. Our recent research shows that the NASDAQ indexes may stall and rotate over the next few months as price valuations have accelerated quite far and because the blue chips are relatively undervalued at the moment. This means, capital will likely continue to pour into the S&P and DOW heavyweights as this capital shift continues to play out.

The G7 meeting, in Toronto, this week will likely present some interesting outcomes. Early talk is that the G6 nations (minus the US) may enact some deal that they believe would be suitable for these nations going forward. Our concern is not the deal or the threat of these nations trying to engage in some deal without the US – far from it. Our concern is that their wishes may be grandiose and ill timed given these currency and valuation issues.

Imagine, for a second, the G6 nations engage in some grand scheme to engage in something to spite the USA. Some plan that seems big and bold and over the top. Yet, 5 months from now, debt issues plague these nations, currency valuations have destroyed any advantage they may have perceived they had and the member nations are beginning to feel the pressures of their own entrapment. What then? The USA to the rescue....again?

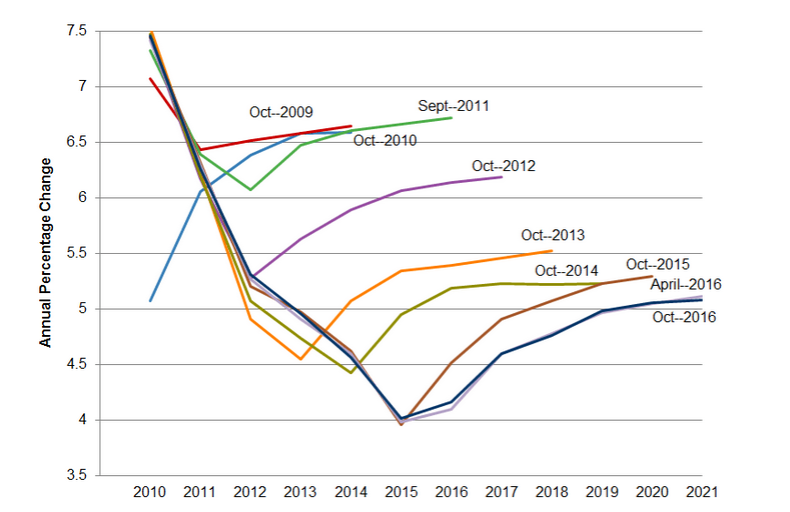
Recently, Ben Bernanke, a Senior Fellow at The Brookings Institute, warned that Donald Trump’s economy was like a Wile E. Coyote going over a cliff. Everything seems well and fine till the road ends and the cliff begins. I would like to remind all of our readers that The Brookings Institute does not have a stellar record of predicting much of anything over the past 10+ years. Take a look at this graph showing the economic expectations and predictions from The Brookings Institute over the past decade or so. Do these people seem capable of accurately predicting anything regarding the U.S. or global economy?


Now, ignoring all of the what if scenarios that are being presented by different people. The bottom line is that the next 6+ months are going to be very exciting for traders and investors. There are huge issues that are unfolding in the global economy right now. Currency levels are about to be shaken even further and the G6 nations, by the time they complete their high priced dinners and evening events, will walk out of the G7 meeting staring down a greater global debt/currency/economic beast of their own creation.

SE Asia is in the process or rewriting and resolving issues of the past 10+ years (see Malaysia / Singapore).


China is in the midst of a massive debt cycle that is about to play out over the next 18+ months (totaling about 1.8 Trillion Yuan).


The Brasil Bovespa Index has rotated into new BEARISH territory.


The Mexican iShares (EWW) ETF is about to break multi-year lows.


The Hang Seng Index is setting up a possible topping pattern that could break down given state and corporate debt concerns.


The iShares Turkey (EURONEXT) index has already broken to new multi-year lows.


The G6 better have some rabbits in their hats that they can magically transform into big bullish projects over the next 12 months or the economic functions that are at play in the world already are likely to steamroll over the top of any news that originates from the G7 meeting.

The U.S. markets are setup for a continued bullish rally with a bit of Summer capital shifts. Our recent research called the rotation out of the tech heavy NASDAQ and a renewed capital shift into the S&P and the DOW leaders. This rotation is likely to continue for many weeks or months as global investors realize the earnings capabilities and dividends values within the U.S. blue chips are of far greater long term value than the risks associated with technology and bio-tech firms. Because of this, we believe the S&P and DOW/Transports are setting up for a massive price rally to break recent all time market highs.

Here is a Daily chart of the YM futures contract showing the recent price breakout and rally. Our expectation is that 26,000 will be breached within 30 days or so and that a large capital shift will drive a continued advance through the end of 2018 – possibly further.


Here is a Daily $TRANS chart showing a similar bullish move. Although the Transportation Index has not broken to new highs yet, we believe this upside move is just beginning and we believe the continued improvements in the US economy will drive the Transportation index to near 11,450 or higher before the end of this year.


Our opinion continues to support the hypothesis that the US markets are the only game on the planet (at the moment) and that a great capital shift is underway in terms of investment in, purchases of and generally opportunistic investment opportunities for US equities and markets going forward. Until something changes where the US dollar strength, foreign economic weakness and foreign debt cycles are abated or resolved, we believe the great capital shift that we have been warning of will continue which will put continued pressures on certain foreign markets and expand debt burdens of at risk nations over time.

Smart traders will be able to identify these opportunities and capitalize on them. They will see this shift taking place and take advantage of the opportunities that arise for quick and easy profits. If you like our research and our understanding of the global markets, be sure to join our premium research and Trade Alert Wealth Building Newsletter. Our valued members stay with us because we have continually proven to be ahead of nearly every market move this year – in many cases many months ahead of the global markets. So, with all of this playing out over the next 6+ months, we suggest you consider joining The Technical Traders to learn how we can help to keep you out of trouble and ahead of the markets for greater success.


Stock & ETF Trading Signals

Friday, December 29, 2017

2018 First Quarter Technical Analysis Price Forecast

As 2017 draws to a close, our analysis shows the first Quarter of 2018 should start off with a solid rally. Our researchers use our proprietary modeling and technical analysis systems to assist our members with detailed market analysis and timing triggers from expected intraday price action to a multi-month outlook.

These tools help us to keep our members informed of market trends, reversals, and big moves. Today, we are going to share some of our predictive modelings with you to show you why we believe the first three months of 2018 should continue higher.

One of our most impressive and predictive modeling systems is the Adaptive Dynamic Learning system. This system allows us to ask the market what will be the highest possible outcome of recent trading activity projected into the future. It accomplishes this by identifying Genetic Price/Pattern markers in the past and recording them into a Genome Map of price activity and probable outcomes.

This way, when we ask it to show us what it thinks will be the highest probable outcome for the future, it looks into this Genome Map, finds the closest relative Genetic Price/Pattern marker and then shows us what this Genome marker predicts as the more likely outcome.

This current Weekly chart of the SPY is showing us that the next few Weeks and Months of price activity should produce a minimum of a $5 – $7 rally. This means that we could see a continued 2~5% rally in US Equities early in 2018.


Additionally, the ES (S&P E-mini futures) is confirming this move in early 2018 with its own predictive analysis. The ADL modeling system is showing us that the ES is likely to move +100 pts from current levels before the end of the first Quarter 2018 equating to a +3.5% move (or higher). We can see from this analysis that a period of congestion or consolidation is expected near the end of January or early February 2018 – which would be a great entry opportunity.


The trends for both of these charts is strongly Bullish and the current ADL price predictions allow investors to understand the opportunities and expectations for the first three months of 2018. Imagine being able to know or understand that a predictive modeling system can assist you in making decisions regarding the next two to three months as well as assist you in planning and protecting your investments? How powerful would that technology be to you?

Our job at Technical Traders Ltd. is to assist our members in finding and executing profitable trades and to assist them in understanding market trends, reversals, and key movers. We offer a variety of analysis types within our service to support any level of a trader from novice to expert, and short term to long term investors.

Our specialized modeling systems allow us to provide one of a kind research and details that are not available anywhere else. Our team of researchers and traders are dedicated to helping us all find great success with our trading.

So, now that you know what to expect from the SPY and ES for the next few months, do you want to know what is going to happen in Gold, Silver, Bonds, FANGs, the US Dollar, Bitcoin, and more?

Join The Technical Traders Right Here to gain this insight and knowledge today.

Chris Vermeulen

Stock & ETF Trading Signals

Saturday, November 11, 2017

Utility Tokens and Cryptos Finally Properly Explained

We have asked our trading partner Teeka Tiwari to explain to us what crypto currencies are and the difference in a crypto currency and the many tokens being offered in the ICO markets right now. Please take a few minutes to read his entire response, when you are done you will have a complete grasp of cryptos and utility tokens....

Cryptos are a brand new asset class. They're completely different from stocks, bonds, and traditional currencies. But that was over 18 months ago. Since then, Bitcoin has risen 1,600% and ether (the coin for the Ethereum network) is up 2,563%.

Perhaps you feel that crypto assets aren't assets at all. Perhaps you've missed out on this incredible run and think it's too late to get in. I want to show you why cryptocurrencies are not like the Dutch Tulip Craze. In fact, we're still in the early days of the cryptocurrency boom.

According to billionaire hedge fund manager Mike Novogratz, the entire crypto market is set to become 25 times larger in the next 5 years. That would be a 2,400+% rise from today. And he's putting his money where his mouth is. Novogratz recently put 10% of his net worth into crypto assets.

That means this asset class still has plenty of room to run and there's still time for you to join the ride. What I'm about to share with you could be very valuable. Like the internet before them, cryptocurrencies have the potential to reshape the economy and they offer a rare opportunity for ordinary individuals to make life changing gains.

The Cryptocurrency Ecosystem
To kick off your education, you need to understand there are two types of crypto assets: cryptocurrencies and utility coins (also called app coins). Think of cryptocurrencies as the digital equivalent of traditional fiat currencies such as dollars, euros, and pounds.

You can use them as a medium of exchange or to store value. The only difference is they're exchanged over the blockchain. Think of utility coins as crypto equities. They're like buying shares in IBM, Walmart, or Apple. Instead, you're buying a stake in a blockchain venture.

Cryptocurrencies and utility coins are similar in that they both operate on a blockchain. The blockchain is like an online public ledger. It's used to track cryptocurrency transactions [Blockchain is a public ledger of all cryptocurrency transactions executed. It's a shared network that can move value around and represent property ownership.]

Now that you know the two types of crypto assets, let me explain how each works.

A New Form of Money
Cryptocurrencies are the crypto asset that most folks are familiar with. So, we'll dive into this one first. The most common cryptocurrencies is Bitcoin. It was created to act as alternatives to fiat (paper) money. Two frequent questions we get are why would anyone buy a cryptocurrency that's backed by nothing and can be created by anyone.

These aren't only fair questions, but smart ones. Here's the thing to remember about money: It's whatever people mutually agree it is. In the past, beads, cowrie shells, silver, gold, and of course paper, have all been used as money. You'll notice that none of them have any intrinsic value.

At the end of the day, a sack of flour has more practical value than a $100 bill or even a bar of gold.
And yet, we value both far more than a sack of flour. That's the mutual agreement we've all come to.
When you think about it, it's not that rational. How does a piece of green paper or a bar of yellow metal hold more value to a human than a sack of flour that can be used to feed a family for weeks?

Because we all agree it does.

In my opinion, paper currency may be the most irrational form of money in human history. At least you can decorate yourself with gold, silver, beads, and cowrie shells. Not only that there's a limit to how much gold, silver, and shells that can be found. There's no limit on the amount of paper money that can be created.

The closest thing to true money (outside of food) is gold. Gold meets several historical rules that we use to judge value. It's prized for its beauty. It's difficult to find. It's expensive to extract. It's also a scarce resource. But there are problems with gold, too. We have to trust that the refineries that certify the gold's purity are telling the truth.

Gold is also difficult to transfer (think of carrying around bags of gold coins or chests of gold bars). And that makes it virtually useless as a practical medium of exchange in daily life. What I mean is you can't buy a new car, house, or even a book with gold bars.

Here's How Cryptocurrencies Are Creating Value
Well designed cryptocurrencies have many features that humans look for when measuring value. Let's talk about them now.

Pre-Programed Scarcity
Cryptocurrencies like Bitcoin are pre programmed to create a set amount of coins. Once this limit is reached, no new coins will be created. This creates scarcity. For instance, the algorithm that governs Bitcoin will create no more than 21 million Bitcoins.

Think about this, there are 35 million millionaires in the world. That means if every millionaire wanted to own an entire Bitcoin, they wouldn't be able to. There literally is not enough to go around. Contrast that with paper money.

With paper money, there's no limit to how much can be created. However, gold is finite. That limits how much new gold can be refined each year. You can see that cryptocurrencies actually have more in common with gold than with paper money.

Difficult to Counterfeit
Cryptocurrencies rely on a technology called the "blockchain." This blockchain uses cryptography to secure transactions. These complex mathematical algorithms make counterfeiting cryptocurrencies almost impossible. Now, compare that to cash. It's estimated that almost a quarter billion dollars of counterfeit paper money sloshes around the U.S. every year.

What about gold? Fake gold will never fool an expert. But counterfeit gold could be passed off to someone with an untrained eye. Cryptocurrencies share two important criteria that give value to traditional assets: scarcity and irreproducibility (hard to counterfeit). These are necessary to create value. But you need something else, too.

A Final Criterion
For a thing to have value, it needs one final thing: Some form of utility. Even art (which some will argue is worth little more than the sum of its parts), creates massive utility by stirring deep emotions in the hearts of people that can appreciate it. That emotional response is a very valuable form of utility. It's the reason people spend billions on art annually. So, what type of utility do cryptocurrencies provide?

Rapid Transfer of Funds
Unlike the transfer of gold or even cash, cryptocurrencies can transfer value almost instantly. And they can do it at very low costs. On the Bitcoin network, you can send $50,000 for about $3. The receiver will get it in about 10 minutes.

Compare that to a traditional wire transfer. The fastest I've seen a wire hit is 24 hours. The cost to send a domestic wire can vary from $35 to $70. International wires can eat up 1%-15% of the total amount of money sent. As far as sending gold, it takes 3-14 days domestically and is very expensive. So, being able to quickly send money anywhere in the world is a very valuable utility that cryptocurrencies possess.

Free from Government Control
Over the years, both gold and cash have been either confiscated or severely restricted through capital controls. Capital controls are government restrictions on your ability to access or move your money.
Even here in the U.S., we have capital controls. For instance, you can't just stroll through airport security with more than $10,000 in cash.

Unless you declare it, you're breaking the law. Even though it's our money, the government insists we report when and where we're moving it. This is an outrageous demand that we accept because there are no alternatives. That is until cryptocurrencies came around.

With cryptocurrencies, we are in complete control of our own funds. We can store them on our own devices free from government intervention. If you store your cryptocurrencies properly, it is impossible for the government to confiscate or control them. This is a truly liberating utility that is very valuable.

Highly Secure Decentralized Payment Network
One common criticism of cryptocurrencies is that anyone can make one. How can something have value if you can create a currency with just a few lines of code? This criticism is spot on.

But remember, anyone can buy a printing press and start making his or her own paper money. What stops people is that no one would use it. The same is true in crypto. Only currencies that gain widespread adoption actually take off.

One of the ways we measure this widespread adoption is by looking at the number of computers that are in a cryptocurrency network. For instance, more than 7,000 separate computers are running the Bitcoin blockchain.

That widespread adoption is a vote of confidence by the market. It's a way for us to objectively identify "good" cryptocurrencies from bad ones. As the network of users grows, so does the volume of cryptocurrency being transacted. This in turn creates a network effect that snowballs.

For instance, $143 million per day of Bitcoin changed hands in 2016. Today, it's over $4 billion per day. The widespread use of this currency is giving it value. Thousands of people are coming together and agreeing to exchange goods and services for Bitcoin.

That is the true test for any currency. Are people accepting it? The answer is a resounding yes. For these reasons, we believe you'll see more people continue to adopt cryptocurrencies like Bitcoin. They offer utility that neither cash nor gold can. Just a few of those companies already accepting Bitcoin or other cryptocurrencies are....Overstock.comMicrosoftIntuitPayPalDISH Network and many more.

A Second Type of Crypto Asset
Earlier, I told you there are two types of crypto assets. The first is cryptocurrencies (which I've just explained to you). The second type of crypto asset goes by several names. Some folks call them "application coins" others call them "utility coins."

The terms are interchangeable. So, what is a utility coin? A utility coin is a crypto asset that is used to secure or deliver a service. Our biggest gains have come from investing in utility coins.

That's why I want to spend the rest of this email talking about them. If you can understand how utility coins work, you can make a fortune in them. In my Palm Beach Confidential service, I have readers that are transforming $300 investments into six figure windfalls by getting in early on utility coins.

Three Themes Driving the Value of Utility Coins
Over 2017, I've been to conferences in Silicon Valley, Boston, Austin, Las Vegas, New York City, Berlin, London, and Copenhagen. During these conferences, I've met with hundreds of people. I've met crypto project founders, venture capitalists, government regulators, central bankers, Fortune 500 executives, hedge fund managers, and digital currency miners.

These are the three primary themes that are driving their research, development, and investment decisions:

  • Fat protocols
  • Interoperability
  • Scaling
If you don't know what these terms mean, don't worry. I'll explain each for you right now.

Theme 1: Fat Protocols
What is a "fat protocol"? I had to ask myself the same question. I stumbled upon this theme at the Consensus 2017 event in New York City in late May. And I heard about fat protocols in more detail in Berlin. Let's start with protocol. In the technology world, a protocol is a set of rules.

For instance, the internet is governed by two protocols: TCP and IP. TCP stands for transmission control protocol. This is a set of rules that governs the exchange of packets of data over the internet. IP stands for internet protocol. This is a set of rules that governs sending and receiving data at the internet address level.

IP by itself is something like the postal system. It allows you to address a package and drop it in the system, but there's no direct link between you and the recipient. TCP/IP, on the other hand, establishes a connection between two hosts, so they can send messages back and forth for a period of time.
Nobody owns TCP/IP. But imagine if someone did. How valuable would the protocols be?

Think about this. According to a Harvard Business Review article, more than half the world's most valuable public companies have built business models on TCP/IP. That's $5.4 trillion dollars in value traced right back to TCP/IP. Think of the biggest names in the internet space: Amazon, Google, Facebook, Priceline, eBay, Netflix, Uber, etc... They are applications, not protocols.

In short: Applications (or "apps") are computer programs that run specific tasks. They include simple desktop apps like calculators, clocks, and word processors to mobile apps like media players, games, instant messengers, and maps. Google's YouTube, Facebook's Messenger, and Microsoft Word are examples of popular web applications. Companies own their applications.

Protocols are the rules computers use to communicate with each other. TCP and IP are examples of widely used protocols. Unlike applications, no one owns computer or internet protocols. For instance, the Ethereum platform has created a protocol for the issuance of crypto tokens (among many other things).

Ethereum has created rules that make it easy to launch and manage digital tokens. That's why more than 50% of new tokens coming to market are using the Ethereum platform. As more projects are launched on the Ethereum network, the demand for ether tokens increases. Said another way, the more the protocol is used, the more valuable the ether tokens become.

These protocols are called "fat" because most of the economic value and profits will be captured at the protocol level. All the tokens launched on the Ethereum platform are only worth $6.8 billion. But the Ethereum platform itself is now worth $34 billion.

Even as more and more companies go "public" on the Ethereum platform, we think Ethereum will be more valuable than the applications that end up running on it. The reason is that the more the protocol is used, the more demand is generated for the underlying protocol token. That's how utility coins like ether gain their value.

Theme 2: Interoperability
Hundreds of new blockchain ledgers are emerging. On top of that, there are hundreds of established centralized ledgers and payment networks. These established payment channels are used by banks and payment providers. We're talking about giants like JPMorgan, PayPal, Visa, and MasterCard.

As the world migrates from a centralized to a decentralized model, how do you get these different networks to communicate with one another? This is a huge problem. That's why we think the next boom will be in companies that allow different ledgers to "talk" to each other.

Imagine there's an English speaker, German speaker, and French speaker in the same room. And no one speaker understands any other speaker. This is the problem right now with blockchains and payment networks. They all "speak" different languages. But what if somebody could create a technology that would allow these different languages to understand one another? In the tech world, this is called "interoperability."

The Difference Between Financial Ledgers and Blockchain Ledgers
Today's financial system requires a lot of overlap. Financial institutions spend a lot of time and money maintaining their systems and even more time and money making sure their systems agree with other systems on common facts.

This is done so that there is no single point of control or single point of failure. The solution is decentralization. It eliminates single points of failure and the necessity for each institution to duplicate the data. The table below highlights the differences between a traditional ledger and a blockchain ledger.


Imagine a version of eBay or PayPal that can work with virtually any digital or fiat payment system. That's the goal of interoperability. Here's the key takeaway, The utility coins that are building in easy to use interoperability will be the ones that become highly valuable.

Theme 3: Scaling
While in Berlin, I met a group of executives from drug giant Merck. These folks oversee Merck's European innovation group. They are tasked with identifying and getting management "buy in" on implementing innovative technology. They have a terrific grasp of the blockchain. They know it could potentially save Merck millions of dollars in costs.

The problem is none of the current blockchain platforms scale. Meaning they just can't operate at the speed and level of complexity Merck requires. This is a common complaint. I've heard it from executives in London, Boston, Silicon Valley, New York City, and now Berlin.

The two most popular blockchains, Bitcoin and Ethereum, can only handle seven and 15 transactions per second, respectively. Like the old 56k telephone modems of the '90s, that's awful. But it would be a mistake to think that it will stay that way forever.

Just as those modems eventually transformed into the high speed internet we enjoy today, it's only a question of time before Bitcoin and Ethereum crack the scaling problem.

Bringing It All Together
The future for cryptocurrencies and utility coins is bright. As more people look to take control of their money, they'll turn to cryptocurrencies like Bitcoin and others. As I track the developments in fat protocols, interoperability, and scaling, I'm seeing more and more widespread adoption of utility coins like ether and many others.

But remember: These are still very early days. We'll see massive volatility ahead. It's unavoidable. The key to thriving in the chaos of the early days of a new technology is to remain rational. Friends, hear me when I tell you that it is irrational to expect the crypto market to be stable. Any market this new is highly unstable. The way we manage and profit from that instability is to use small position sizes. With crypto assets, we rely on asymmetric risk.

With crypto we can swing for the fences without putting the rest of our existing wealth at risk. This is a rare opportunity for ordinary people to make life changing gains without having to take life changing risk. That means we risk a small amount of money for a massive potential payoff. This strategy is working well for my readers.

The best part is this trend is just beginning. Right now, the entire crypto market is valued at about $195 billion. Novogratz, the hedge fund billionaire I mentioned earlier, sees the entire market growing to $5 trillion. That's 2,400+% upside ahead. That means we have many more opportunities in front of us to make life changing gains. So get out there. At the very least, buy some Bitcoin and Ethereum.

Remember, you don't have to own a whole Bitcoin. You can own just a fraction of a coin.
And as all these developments unfold – along with others like them – I'm confident that one day you'll be grateful you took action.

Let the Game Come to You!
Teeka Tiwari



Stock & ETF Trading Signals

Sunday, May 14, 2017

The Bond King Says "Short U.S. Stock"

Image result for jeffrey gundlachShort the SP500.....That’s not something most investors would consider right now. After all, US stocks have been rallying for eight straight years. At this point, it’s hard to even remember what a down market feels like.

But that’s exactly what Jeff Gundlach thinks you should do. Gundlach, as you may know, is one of the world’s brightest investors. He manages more than $100 billion at his firm DoubleLine Capital.

On Monday, he told a room full of investors at the Sohn Investment Conference in New York to short (bet against) the SPDR S&P 500 ETF (SPY). This fund tracks the S&P 500. It’s the most heavily traded ETF on the planet.

It’s a bold call, to say the least.…
But Gundlach has a history of nailing calls like this. At last year’s Sohn Conference, he told investors to short the Utilities Select Sector SPDR Fund (XLU) and buy the iShares Mortgage Real Estate Capped ETF (REM). If you had taken Gundlach’s advice, you’d be up 40% on this trade today. Gundlach was also one of the few people to predict that Donald Trump would become president of the United States. In June, he told CNBC:
People aren't getting along, they're not happy because of technology taking jobs, and sort of this long, slow grind of a new economy. And so they're looking for change, and I think Trump is going to win on the basis of that.
In other words, it pays to listen to Gundlach.…
But here’s the thing. Gundlach doesn’t think you should get out of stocks completely. Instead, he thinks you should “go long” emerging markets. These are countries that are on their way to becoming “developed” countries like the United States. Brazil, Russia, India, and China (also known as the “BRICs”) are the largest emerging markets.

On Monday, Gundlach told investors at the Sohn Conference to buy the iShares MSCI Emerging Markets ETF (EEM), which tracks over 800 emerging market stocks. It’s one of the safest and most diversified ways to play emerging markets. Of course, you would have already known that if you’ve been reading the Dispatch.

After all, I’ve been pounding the table on emerging market stocks for months.…
In February, I outlined the bullish case for emerging markets. A month later, I told investors to “forget about US stocks” and consider emerging market stocks. I even recommended checking out EEM, just like Gundlach. Not only that, Gundlach likes emerging markets for the same reasons we do. I’ll share those with you in a moment. But let’s first look at why the “Bond King” thinks you should short the S&P 500.

U.S. stocks are incredibly expensive.…
Just look at this chart. It compares the total market value of the S&P 500 with the annual economic output of the United States, as measured by gross domestic product (GDP). This key ratio is now at the highest level since the dot com bubble.


US stocks aren’t just expensive from a historical perspective, either.…
They’re also much more expensive than emerging market stocks. Gundlach explained to CNBC on Monday:
The valuation of emerging markets is half the valuation of the S&P 500 when you look at things like price to sales, price to book, [and] Dr. Shiller’s CAPE ratio.
Dispatch readers know CAPE stands for cyclically adjusted price to earnings. It’s the cousin of the popular price to earnings (P/E) ratio. The only difference is that it uses 10 years’ worth of earnings instead of one. But just like the P/E ratio, a high CAPE ratio means stocks are expensive. You can see below that the CAPE ratio has surged to 29.5. That’s 76% higher than the S&P 500’s historical average. US stocks have only been this expensive two times in history: just before the Great Depression and during the dot com bubble. Meanwhile, the CAPE ratio for EEM is floating around 14, meaning it’s 52% cheaper than SPY.

To be fair, emerging market stocks have been cheaper than US stocks for years.…
And they’ve still underperformed them. But that’s starting to change. Just look at the chart below. It compares the performance of the S&P 500 with EEM. When this line is rising, it means US stocks are doing better than emerging market stocks.


You can see that’s been the case for years. But this key ratio just broke a long term upward trend line.
This tells us that emerging market stocks should outperform US stocks for years to come.

If you haven’t already, I recommend you pick up some emerging market stocks today.…
The easiest way to do this is with EEM or another major emerging market fund. These funds will give you broad exposure to emerging markets. Once you build a core position in emerging markets, you could consider investing in individual emerging markets. Right now, three of our favorite emerging markets are Poland, Colombia, and India.

As for U.S. stocks, I wouldn’t encourage everyday investors to short the S&P 500 like Gundlach recommends. Instead, I suggest you be very selective about what U.S. stocks you own. Avoid stocks trading at nosebleed valuations. Own companies with resilient business models and little debt.

The article “The Bond King” Says Short US Stocks was originally published at caseyresearch.com.


Stock & ETF Trading Signals

Friday, July 8, 2016

This 5,000 Year Low Is Ruining Your Retirement

By Justin Spittler

The global banking system, and your financial future, are at serious risk right now. To understand why, just look at what's going on with the government's latest radical policy. Regular Dispatch readers know we're talking about rock bottom interest rates. According to MarketWatch, global interest rates are at the lowest level in 5,000 years. Credit is cheaper right now than at any point since the First Dynasty of ancient Egypt, around the 32nd century BC. Today, we'll explain what this means and how to protect yourself going forward..…

Interest rates didn’t get this low “naturally.” They’re at record lows because central bankers put them there..…
In 2008, the Federal Reserve dropped its key rate to near zero to fight the financial crisis. It’s kept rates there for eight years to encourage borrowing and spending. Other major central banks did the same thing. According to MarketWatch, there have been more than 650 rate cuts since September 2008. Rates in Canada and England are also near zero. In Europe and Japan, rates are below zero.

As we’ve explained before, negative interest rates basically tax your bank account. Instead of earning interest on the money in your bank account, you pay the bank. Not long ago, negative rates were unheard of. Today, more than $12 trillion worth of government bonds pay negative rates, up from $6 trillion in February. 

They’ve even seeped into the corporate debt market. According to Bloomberg Business, more than $300 billion worth of corporate bonds now “tax” bondholders. Central bankers told us low and negative rates would “stimulate” the economy. But, as you’re about to see, they’ve done far more harm than good.

Central bankers made it much harder to retire..…
That’s because rock bottom rates don’t just make it cheap to borrow money. They make it tough to earn a decent return. From 1962 to 2007, a U.S. 10 year Treasury paid an average annual interest rate of 7.0%. Today, a U.S. 10 year Treasury yields just 1.5%, an all time low. It’s the same story around the world. Last week, 10 year bonds in Ireland, England, Germany, France, and Japan all fell to record lows. In Japan, you actually have to pay the government 0.23% every year you own one of its 10 year bonds.

This is a serious problem for hundreds of millions of people. For decades, retirees could earn a safe, decent return owning these bonds. Some folks even lived off the interest they earned from these bonds. These days, you have to own riskier assets like stocks to have any shot at a decent return. Central bankers have effectively forced retirees to gamble with their life savings. Rock bottom rates are a serious threat to major financial institutions too.

According to U.S. banking giant Citigroup (C), low and negative rates are “poison” to the global financial system..…
They could make pension funds, insurance companies, and banks “no longer viable in the long term.” Business Insider reported last week:
As Citi notes: "Viability in its strong sense means profitability (a rate of return on equity at least equal to the cost of capital). In its weak sense, viability means solvency." Basically, Citi is warning that the negative rates may stop institutions being able to make money, which in turn would hit their ability to pay out on things like pensions and insurance policies.
This is a major risk even if you don’t have a pension or life insurance policy. That’s because pension and insurance companies oversee trillions of dollars. They’re pillars of the global financial system…and negative rates are destroying them.

Rock bottom rates could also put some of the world’s biggest banks out of business..…
You see, banks earn most of their money making loans. When rates are high, they make more on each loan. When rates are at record lows, like they are today, banks often lose money. Business Insider explains how today’s record-low rates are starving banks of income:
Citi points out that: "Banks in large part live off the differentials between lending and borrowing rates or between investment returns and funding rates." Persistently low interest rates could hit these differentials, lowering profitability and seriously harming banks in the long run.
Profits at America’s four biggest banks fell by an average of 13% during the first quarter…
This group includes Citigroup, Wells Fargo (WFC), Bank of America (BAC), and JPMorgan Chase & Co. (JPM). European banks are doing even worse. Swiss bank UBS’s (UBS) profits plunged 64% during the first quarter. Profits at Deutsche Bank (DB), Germany’s biggest lender, fell 58%. Spanish banking giant BBVA’s (BBVA) earnings fell 54%. The CEO of Deutsche Bank warned last month:
In the banking world, we are currently struggling with negative interest rates.
We will struggle more as the effect of those negative interest rates plays out into our deposit books.
Dispatch readers know some of Europe’s most important financial institutions are looking for ways to get around negative rates..…
Commerzbank, one of Germany’s largest banks, said last month that it was thinking of pulling money out of Europe’s banking system to avoid paying negative rates. Other banks have started making riskier loans and buying riskier assets to offset rock-bottom rates. The Financial Times reported in March:
Gonzalo Gortázar, chief executive at Spain’s Caixabank, expressed concerns about a build up of risk in the banking system as a whole. “In a world of low or negative interest rates, that is a possible consequence; you could see banks taking more risk,” he said.
Longtime readers know excessive risk-taking by banks contributed to the 2008 financial crisis. As a result, the S&P 500 plunged 57% from 2007 to 2009. And the U.S. entered its worst economic downturn since the Great Depression.

Bank stocks are already trading like a financial crisis has begun..…
Swiss bank Credit Suisse (CS) has plummeted 63% over the past year. Deutsche Bank is down 60%. Royal Bank of Scotland (RBS) is down 59%. Mitsubishi UFJ Financial Group (MTU), Japan’s biggest bank, is down 39%. These are huge drops in short periods. Remember, these are some of the most important financial institutions on the planet.

We encourage you to take action now..…
Our first recommendation is to avoid bank stocks. Low and negative rates are eating these companies alive right now. And it could be years before governments abandon these failed policies. According to Fed Chair Janet Yellen, low interest rates are the “new normal.” We also encourage you to own physical gold. As we like to remind readers, gold is real money. It’s preserved wealth for centuries because it has a rare set of characteristics: It’s durable, easy to transport, and easily divisible. A gold coin is valuable anywhere in the world.

This year, gold has jumped 26%. It’s trading at its highest price in two years. But Casey Research founder Doug Casey says this rally is just getting started. According to Doug, gold could soar 500% or more in the coming years. If you’re nervous that central bankers will take this interest rate experiment too far, own gold. It’s the best way to protect yourself from desperate governments.

We also encourage you to watch this short presentation. It explains how these failed monetary policies could spark something much worse than a banking crisis. As you’ll see, this is a threat to you even if you don’t a have a single penny in the stock market. Click here to watch this free video.

Chart of the Day

Deutsche Bank is trading like a financial crisis has begun. Today’s chart shows the performance of the German banking giant. You can see its stock is down more than 50% over the past year. Last Thursday, it hit it a new record low. Like other European lenders, low rates are killing Deutsche Bank. Last year, the company lost $7.5 billion. It was its first annual loss since the 2008 financial crisis. And yet, its plunging stock suggests more bad results are on the way.

According to the International Monetary Fund (IMF), Deutsche Bank is the world’s riskiest financial institution. That’s a problem even if you don’t keep money with Deutsche Bank or own its shares. The Wall Street Journal reported last week:
The IMF also said the German banking system poses a higher degree of possible outward contagion compared with the risks it poses internally. “In particular, Germany, France, the U.K. and the U.S. have the highest degree of outward spillovers as measured by the average percentage of capital loss of other banking systems due to banking sector shock in the source country,” the IMF added.
In other words, problems at Deutsche Bank could spread to other banks around the world. It’s another reason why you should avoid bank stocks and own gold right now.


The article This 5,000-Year Low Is Ruining Your Retirement was originally published at caseyresearch.com.


Get our latest FREE eBook "Understanding Options"....Just Click Here!

Stock & ETF Trading Signals

Saturday, February 20, 2016

Is 70 the New 65?

By John Mauldin

As some of us know far too well, forecasting the future with any precision is extremely difficult. There’s at least one exception to the rule, though. Population trends show themselves decades and even centuries in advance. If we know how many people were born in a given year, we can extrapolate what the population will look like far in the future.

On the other hand, demographic forecasting still requires assumptions. At what age will people start having children, and how many will they have? How will new medical advances affect life spans? When will people start working, stop working, and enter retirement? Small changes in any of those assumptions can quickly affect population numbers.

Today’s Outside the Box wrestles with that last question. In the United States we allowed the federal government to set 65 as the retirement age by making Social Security available to most workers at that point in their lives. The retirement age is going up to 67 for the younger members of the Baby Boom generation, but even that may be too “young” to retire in the future.

We Baby Boomers were never big on conformity. Voluntarily or not, a large number of us fully intend to stay in the workforce to age 70 and beyond. If 70 is the new 65, we will see significant changes in the ways people spend their money and the kinds of investments they want.

Matthew Tracey and Joachim Fels of PIMCO outline some of the possibilities in this report. I found it very interesting, and I think you will, too.

Speaking of things changing, the weather in Texas has been nothing like anything in the past. It is mid-February and I’m having to turn the air conditioner on at night. The forecasters tell us it’s going to get into the 80s on Friday. Talking with my long-term Texas friends, none of us can remember weather like this. Cooler than normal summers, milder than normal winters. I guess it’s a good thing it’s not like this every year, because then we’d have a wave of tax refugees showing up from California. Then again, this is Texas. If we wait a bit I’m sure we’ll get our usual ice storms and other nasty stuff. Winter is coming. Maybe.

I am struggling to keep up with the research my 20 some teams are developing for the chapters of The Age of Transformation. Thankfully I have a small team helping me review the research, which is on top of the research I’m doing for the five or so chapters that I’m personally writing. Plus, there’s my regular reading for doing the weekly letters and so forth. It is forcing me to sort through the pile of items in my inbox as to what is must read, what can wait, and what I just don’t have time for. I really am learning to depend on people to make sure the things that I must read get on my radar screen.

I’m going to go ahead and hit the send button, as I have to prepare for an interview with CNBC Asia on Japan and related topics. You have a great week, and I hope that wherever you are, your weather is as good as ours.

Your marveling at the speed of things changing analyst,
John Mauldin

70 Is the New 65: Demographics Still Support 'Lower Rates for Longer'

By Matthew Tracey and Joachim Fels
PIMCO.com, February, 2016

The so-called demographic cliff remains at least a decade away; meanwhile, global demographics should continue fueling the savings glut.

Is global aging about to end the savings glut? Some observers think so. More and more baby boomers are reaching retirement age, and they will soon not only save less but also start to dump their accumulated assets to fund retirement … or so the story goes. If this were true, the consequences for interest rates would be profound. The real long term equilibrium interest rate, which has been on a secular downtrend for decades partly due to strong working age cohorts saving hard for retirement, would start to rise – and what we here at PIMCO call The New Neutral might soon be history.

We strongly disagree with that thesis of an imminent demographics induced savings drought. Rather, we have argued in recent work that the global excess supply of saving over investment, which has been largely responsible for the secular decline in equilibrium interest rates, is not only here to stay but likely to increase further in the coming years for a host of reasons including demographics (see PIMCO Macro Perspectives, No End to the Savings Glut,” September 2015). As a consequence, we continue to expect the fundamental forces of elevated desired saving to keep the equilibrium real rate depressed and to limit the extent to which other (cyclical) factors can drive up market interest rates.

However, given the popularity of the thesis that demographics will soon end the savings glut, we undertook a deep dive into the data to investigate the link among demographics, saving behavior and the demand for fixed income assets – with some surprising results. Here’s what we found.

A ‘demographic reversal?’ Not so fast!

People of the world, we’re getting old. It’s a well-known fact that, after decades of decline, the global dependency ratio – traditionally defined as the ratio of individuals younger than 15 and older than 64 to the working-age population aged 15-64 – is now rising (see Figure 1).


Some financial market observers argue that this demographic trend reversal will begin to drive interest rates higher, and soon. Why? First, a declining share of high-saving workers and a rising share of dissaving elderly will (the argument goes) erode the demand for saving – and drive interest rates higher via the savings-investment equilibrium. Second, these observers argue, a rapidly growing share of retirees will have to consume (i.e., sell down) their financial asset holdings to fund spending in retirement, and these drawdowns will create selling pressure in financial markets that pushes asset prices down and interest rates up.

Our core thesis in a nutshell: Yes, global aging may someday drive U.S. interest rates structurally higher. But “someday” remains at least a decade away – for two reasons. First, we proffer that global saving will remain stronger than many expect, supporting a low global neutral interest rate. (As investors, we care about the neutral rate because it anchors fixed income yields in the market.) Second, U.S. demographic demand for fixed income assets should remain robust until at least 2025 – and in the meantime should continue to put downward pressure on market yields, all else equal. Combine a low global “anchor” and strong domestic fixed income demand, and what do you get? Lower rates for longer in the U.S.

Continuing robust demographic demand for saving

Remember the link between saving and interest rates: In the savings-investment equilibrium, rising demand for saving pushes down the equilibrium (or neutral, or natural) rate of interest, all else equal, and vice-versa. Our task, then, is to assess how demographic changes affect aggregate saving. We find that the traditional “dependency ratio,” used in many other studies on this topic, is flawed.

We suggest two modifications to address those flaws. First, the young, considered “dependents,” contribute very little to global saving and dissaving in dollar terms (they’re “non-savers”). We therefore prefer to focus on the ratio of “Peak Savers” (mature adult workers who earn and save a lot) to “Elderly” (who save less as they age and ultimately consume their savings in retirement). Let’s preliminarily define “Peak Savers” as individuals aged 35 to 64, for two reasons:
  • People 35–64 have generally exhibited much higher savings rates than people in younger and older age groups;
  • People 35–64 earn considerably more income than people younger and older – so for any given savings rate, this age group’s saving behavior will have an outsized effect on saving and investment flows in dollar terms.
Let’s preliminarily define “Elderly” as everyone 65 and older (the traditional definition). Thus, the global Peak Savers versus Elderly ratio in Figure 2 reflects a static 35–64 Peak Saver cohort – and reveals what appears to be a demographic cliff in about year 2010. Those who argue that demographic support for saving will fall sharply in the coming years typically will try to prove their point using a ratio like this one.


But we ask: Is it sensible to define the Peak Saver and Elderly groups by the same static age ranges over long periods of time? Put differently: Might working and saving behavior evolve over time, warranting a dynamically modified dependency ratio? Seniors’ ability to work (and save) later in life should continue to rise; in our increasingly services-based “knowledge economy,” jobs are becoming less physically demanding and often require more experience, while advances in health technology boost functional age in life’s later stages. Seniors’ willingness (and incentives) to work longer also should rise along with their ability.

True, the retirement age, globally, has not kept pace with rising longevity. But policymakers are slowly catching on. In the U.S., the Social Security full benefit retirement age is increasing to 67 and will go higher still – a government incentive telling people to stay in the workforce. Meanwhile, years of low interest rates have left impending retirees playing catch up in retirement saving. More generally, around the world, longer lives must ultimately be supported by longer working lives. Anything less will prove unsustainable. Our colleague Jim Moore summed up the state of affairs (in the U.S.) in a PIMCO Viewpoint from 2012: “Work a little longer. Save a little more. Get by with a little less.1

We think this insight applies abroad as well. In fact, global trends already underway support our argument that people will work later and later in life. In many economically important geographies – notably the U.S., eurozone, UK and Japan – senior (age 65+) labor force participation has been trending higher. And China is contemplating steadily raising its retirement age in the coming years.

However, what matters most for global saving demand are those who earn the most income. Consider the U.S. as an example. Top-income-quintile households control nearly two-thirds of U.S. household income, three-quarters of household wealth and more than 80% of household financial assets. Apart from the major social ramifications of wide (and widening) income and wealth inequality, the implications for aggregate saving are critical: Rather obviously, high earners’ working and saving behavior has an outsized effect on global saving in dollar terms.

If the highest earners are working (and saving) later in life, we should pay attention. Witness the dramatic rise in labor force participation within the top income quintile (Figure 3): Over 60% of top-quintile individuals in the 65–74 age group are employed or seeking work, a 19-percentage-point increase in participation over the 15 years through 2013. 2 Moreover, participation among top-income-quintile seniors 75 and older has more than doubled over the same period.4,/sup>

What about seniors’ late life saving behavior? Consider the top two income quintiles, collectively accounting for about 80% of U.S. personal income. Based on 2014 data from the BLS’s Consumer Expenditure Survey, these high earners exhibit no decline in savings rates as they enter retirement (due in part to a strong bequest motive and high conservatism). In Figure 4, note how high and consistent these top earners’ savings rates remain even in their late 60s and 70s.


(Aside: We find it curious that savings rates, based on the BLS’s Consumer Expenditure Survey, do not become negative for lower income quintile seniors even in their late 70s. We suspect that other data sources may show a negative savings rate for these elderly groups, likely due to methodological differences in data collection. Our focus here, however, is on age-related trends in saving behavior rather than savings rates themselves.)

To recap: The most impactful seniors are working (and saving) later in life as functional age and the duration of retirement both increase.3 Therefore, our preferred measure of the demographic support for saving is a dynamic, not static, ratio that accounts for the trend toward longer working lives. Let’s revisit our Peak Savers versus Elderly ratio from Figure 2. In decades past, age 64 may well have been the sensible upper bound for the Peak Saver group.

But what about the coming decades? In Figure 5, we have added a dynamic ratio (red line) that assumes seniors work roughly five years later in life in 2050 than they did in 2000. In other words, our age definition of “Peak Saver” evolves dynamically from 35–64 in 2000 to 35–69 by 2050, and consequently our definition of “Elderly” evolves dynamically from 65+ to 70+ over the same period.


What a different picture the dynamic ratio paints! It suggests that demographic support for saving could well be as strong a decade from now as it has been in recent decades – and illustrates the extent to which traditional static ratios may be flawed.

We concede that our dynamic ratio forecast is only a guess as to what the future may look like if current trends persist. But there is some method to the madness. For example, the reason we start to phase the 65- to 69 year olds into our Peak Saver group specifically in 2000 is that senior labor force participation began to rise rapidly in that year (after two stagnant decades).

Our five years later in life by 2050 employment assumption is slightly more arbitrary, but reasonable given that, globally, the largest increases in retirement age likely lie ahead of us. And our dynamic ratio does not account for the rising share of seniors 70+ who remain working, introducing an element of conservatism to our assumptions. So while our dynamic ratio embeds some simplifying assumptions, to be more scientific risks missing the forest for the trees.

Almost regardless of the assumptions used, if you define a dependency ratio dynamically – based even loosely on observable trends – you are likely to paint a very different (and more accurate) picture of the future than you will paint using a static ratio.

What about the rest of the world? It appears we’ve made an argument about global demographics supported mainly with U.S. data. However, publicly available data for other economically significant regions does not permit as granular an analysis as we have shown for the U.S. We do have reason to believe similar trends are occurring outside the U.S.: Elderly labor force participation is rising in Europe, the UK and Japan, and some countries – including China – are contemplating raising the retirement age.

In Japan, whose demographic cliff materialized many years ago, senior labor force participation has been trending higher, and as a result the labor force shrank only about 0.8% over the past decade even as the “working-age population” (aged 15 to 64) fell almost 9%. Patterns like this one are likely to repeat in other aging countries as societies adapt to meet their demographic challenges.

Bottom line: The people who move the needle most in saving demand, the highest earners, are the people working and saving later in life. This trend should be a tailwind for saving demand in the years to come that will push the global demographic cliff at least a decade into the future – and support a low global neutral interest rate, per the savings-investment equilibrium. 70 is the new 65!

U.S. household (demographic) demand for fixed income assets: a decade-long tailwind for bonds

We’ve just argued that demographics should help keep the global neutral rate low over the coming decade – which means that market yields in the U.S. should have a low “anchor.” But waves of baby boomers are retiring (albeit, as we have argued above, increasingly later), and many will eventually draw down (i.e., sell) their financial asset holdings to fund late life consumption. Are we fast approaching the point when boomer drawdowns create selling pressure in fixed income markets that pushes interest rates higher? Or might U.S. aging (boomers included) actually bolster the (net) demand for bonds and help maintain a low ceiling for market yields?

Consider two key observations.
  • First, as we should expect, investors generally de-risk away from equities and toward fixed income with age – most aggressively once they reach their 60s (and beyond).5
  • Second, individual asset accumulation and drawdown patterns vary significantly by income level. In the U.S., individuals in the lowest income quintile tend to sell their limited financial assets beginning in their 50s and completely exhaust their assets by, or before, death (relying on social assistance to meet their basic needs in life’s latest stages). Middle-income individuals tend to draw down financial assets beginning in their 60s but not at a rate that would deplete their assets before death. Individuals in the highest income quintile, however, are shown to have rising financial asset balances until roughly age 80 (after which they decline only very gradually). In other words, for top-income-quintile individuals, portfolio drawdowns don’t tend to begin until roughly age 80 (an important point). 

The highest earners have historically been able to fund retirement consumption from income (generally employment income, investment portfolio income and annuitized income), “leaving their financial assets virtually untouched.”6Here’s the key: Top-income-quintile households own over 80% of U.S. household financial assets. Consider how significantly this group’s future asset accumulation and drawdown profile will impact financial markets!

Back to our question about whether U.S. demographics will be a headwind or tailwind for bond flows in the years ahead. For starters, we assess when (demographics-driven) bond buying might peak relative to bond selling. We define “Bond Buyers” as individuals aged 60–74 and “Bond Sellers” as individuals 80 and older.

These age definitions are somewhat arbitrary, but they’re based on the two previously introduced empirical observations about households in the top quintile of the U.S. income distribution (which hold over 80% of U.S. household financial assets):
  1. Bond buying tends to peak during individuals’ 60s and early 70s (aggressive de-risking);
  2. Bond selling tends to peak in the years after age 80 (as individuals sell down their financial assets to fund consumption in retirement).
Figure 6 shows the ratio of Bond Buyers to Bond Sellers, which we use to gauge when net demographic buying demand might theoretically peak. On this metric, U.S. demographic demand for bonds should continue to rise in the next five years or so before peaking and may still be as strong in 2025 as it is today. (Our age definitions are based on patterns observed among U.S. households, so we focus primarily on the blue U.S. line in the figure. We include a global version of the Buyers versus Sellers ratio as well – the green line – which reveals an even later potential peak in global demographic demand for bonds.7


Our interpretation of this Buyers versus Sellers ratio assumes that each buyer exerts about the same influence on markets as each seller, an assumption that may be conservative given high-earning sellers draw down their portfolios only very gradually, whereas buyers likely will be de-risking aggressively in their 60s and early 70s. We “stress test” this assumption and result with scenario analysis in the Appendix.

Next, we explore the demographics of U.S. financial asset ownership at a very high level. Figure 7 shows household financial asset holdings by both age and income.8


The lion’s share of the $31 trillion in U.S. household financial assets9 ($21 trillion, or about 70%) is held within – or over the next 10 years will be held within – age cohorts that typically need to grow their fixed income allocation. This $21 trillion, outlined in green in Figure 7, is expected to remain in an accumulation or de-risking phase and won’t enter a drawdown phase within the next decade (based on the age-related asset drawdown patterns we described earlier). This $21 trillion will likely be a demographic tailwind for bonds over the next decade (especially for municipal bonds given high earners’ need for tax-free income). Conversely, only about $5 trillion (approximately 15%) of household financial assets seems likely to be a headwind for bonds during this period (outlined in red).

One caveat: Many factors other than demographics influence investors’ asset allocation decisions – among them changes in valuations, evolving expectations about future asset returns, individual risk preferences, U.S. investor preference for domestic versus foreign assets, foreign investor preference for U.S. assets, and market disruptions that may trigger significant portfolio rebalancing. Our analysis here focuses only on demographic effects, holding all else equal.

Now let’s go a level deeper. In the Appendix we model the potential demographics-related asset flows we might see over time from the gradual de-risking and drawdown of household financial assets. We analyze 10 unique scenarios in order to test a range of assumptions. Our “baseline” scenario reflects a set of assumptions about de-risking behavior and asset decumulation that we think is realistic (and possibly conservative) based on historical patterns. Our modeling suggests that U.S. demographics driven fixed income inflows are likely to be almost as strong 10 years from now as we project them to be today – and that demographics may not be a material headwind for bonds until the 2030s.

How can we explain these conclusions? In our analysis, for at least the next decade, de-risking flows and rebalancing flows into fixed income more than compensate for seniors’ portfolio drawdowns. In stress testing our baseline assumptions we found it hard to come up with a plausible scenario in which U.S. demographics become a fixed income headwind within 10 years. Yet we found it easy to imagine realistic scenarios in which demographic demand for bonds remains robust for the next 15 years or more.

Consider as an example the high-earning elderly, for whom longevity risk is rising rapidly as life-extending medical technologies proliferate. High earners, historically, have been overly cautious in recalibrating their spending to meet anticipated future needs – a finding that could warrant an even more gradual asset-drawdown trajectory for this next generation of retirees than we have modeled based on historical experience. See the Appendix for our assumptions, baseline scenario modeling and alternative scenarios.

A brief aside: Our focus here has been U.S. demographics and, implicitly, U.S. fixed income. However, U.S. demographics are likely to influence global fixed income markets given U.S. households account for over 40% of global household financial assets. For context, Western Europe and Asia each account for about 25%.10

Finally, a quick note on changes in the composition of household retirement savings. The shift from defined benefit (DB) to defined contribution (DC) plans in the U.S. persists, and in our estimation U.S. DB plans hold a lower allocation to bonds than a market-average glide path suggests is optimal for DC participants.11 In aggregate, therefore, the continued shift toward DC may represent an additional tailwind for bonds in the coming years.

Bottom line on U.S. aging and the demand for bonds: Persistent demographic support for fixed income should, all else equal, drive net flows into bonds and help maintain low yields over the next decade.

‘Speed read’ and key conclusions

Some financial market observers believe in the following dramatic scenario:
  • We’ve just gone over a demographic cliff; globally, the ratio of high-saving adult workers to dissaving elderly is now declining. This demographic reversal will erode the demand for saving.
  • The global savings glut will reverse as the demand for saving falls, pushing the global neutral interest rate higher.
  • Baby boomers in the U.S. will compound the problem as they sell their financial assets (including bonds) to fund retirement consumption, driving U.S. fixed income yields higher.
In this note, we challenge traditional thinking about the timing of the feared “demographic cliff.” A demographics-induced structural rise in U.S. interest rates remains at least a decade away:
  1. Global demand for saving will remain robust, supporting a low global neutral interest rate (the “anchor” for U.S. fixed income yields):
    • Traditional dependency ratios – which use fixed, static age definitions – are flawed because they fail to account for how the world is changing.
    • U.S. elderly, especially the highest earners, are working and saving later in life. High earners matter a lot because they drive the lion’s share of global saving. 70 is the new 65.
    • Similar trends can be observed in economically significant economies outside the U.S.
    • We argue for a dynamic, not static, ratio of mature adults to elderly that does account for how working and saving behaviors are changing. Our dynamic ratio suggests that demographic support for saving may be as strong over the next decade as it has been over the past several. Possibly stronger.
    • Strong saving demand should support a low global neutral interest rate in the coming years – and should continue fueling the global savings glut.
  2. In financial markets, strong U.S. demographic demand for fixed income assets should – all else equal – help maintain low U.S. bond yields over the next decade:
    • The lion’s share of U.S. household financial assets is held within age cohorts that will need to grow their fixed income allocation over the next ten years.
    • Top-income-quintile households own over 80% of these assets, and high earners sell financial assets only very gradually in retirement to fund consumption.
    • For another decade or more, demographics should remain a net contributor to fixed income flows, as high earners’ de-risking into bonds should dominate bond outflows due to portfolio drawdowns.
Combine a low global neutral interest rate and strong domestic demand for bonds, and what do you get? Lower rates for longer in the U.S.
The authors would like to thank PIMCO colleague Jim Moore for his contributions.

Appendix: U.S. household financial assets and fixed income flows – scenario analysis

This Appendix details the assumptions used in our baseline scenario for U.S. (demographics-driven) fixed income flows and offers a number of alternative scenarios.
Baseline scenario assumptions:
  • Financial asset portfolios consist of two asset types (for simplicity): “risk assets” (excluding fixed income) and fixed income.
    • Long-term annual risk asset return: 5% nominal.
    • Long-term annual fixed income return: 2.5% nominal.
  • Investors de-risk their portfolios into fixed income over time according to a market-average glide path,12 interpolated as necessary. (We conservatively assume that de-risking into fixed income ceases at age 75 and that investors’ asset allocations remain constant thereafter. This assumption is driven by a lack of available data on market-average glide path allocations for ages older than about 75.)
  • Each year, top-income-quintile households re-optimize to draw down 50% of their financial assets by the end of their planning horizon, beginning at age 80 and ending at age 95. (50% may be a conservatively high drawdown percentage.)
  • Each year, households in the bottom four income quintiles re-optimize to draw down 75% of their financial assets by the end of their planning horizon, beginning at age 65 and ending at age 90. (75% may be a conservatively high drawdown percentage.)
  • Financial asset drawdowns occur proportionally across risk assets and fixed income. (This assumption is fair to conservative, given there is evidence that people draw down their riskiest assets first.13)
  • Financial asset portfolios do not exist in perpetuity; mortality effects (based on the most recent mortality tables from the Society of Actuaries) lead to bequests that generate “re-risking” flows from fixed income into risk assets.14
Alternative scenarios:
Each alternative scenario represents a modification relative to our baseline scenario.
  • Alternative 1: De-risking into fixed income proves significantly faster than expected (ultimate fixed income allocation of 50% is reached 10 years earlier than baseline glide path suggests).
  • Alternative 2: De-risking into fixed income proves significantly slower than expected (ultimate fixed income allocation of 50% is not reached until 10 years after baseline glide path suggests).
  • Alternative 3: Seniors 50+ ultimately de-risk much less significantly than baseline glide path suggests (fixed income allocation reaches 15% at age 50, per glide path, but then flat-lines for 10 years before gradually increasing to a level only half that suggested by baseline glide path, i.e., a terminal allocation of 25% instead of 50%).
  • Alternative 4: Annual fixed income returns equal annual risk asset returns, such that market-return-driven rebalancing flows no longer support fixed income (5% annual nominal return assumed for both asset types). (This scenario has a natural hedge property; if ex ante fixed income returns ever were expected to equal ex ante risk asset returns, the relative attractiveness of fixed income probably would increase on a risk-adjusted basis, likely triggering non-demographics-related reallocations into fixed income – which we have not modeled here.)
  • Alternative 5: Top-income-quintile households re-optimize each year to ultimately draw down 75% of their financial assets by the end of their planning horizon, while households in the bottom four quintiles re-optimize to draw down 100% (for both groups, a far higher drawdown percentage than is likely).
  • Alternative 6: Top-income-quintile households commence drawdowns a full decade earlier than history suggests is likely, i.e., at age 70 (if anything, as life expectancies and planning horizons lengthen, one might expect drawdowns to begin later).
  • Alternative 7: A combination of alternatives 5 and 6 (i.e., a highly conservative mix of assumptions).
  • Alternative 8: Households commence drawdowns five years later and lengthen their planning horizon by five years (optimistic, but plausible given rising longevity risk and rising labor force participation among the high-earning elderly).
  • Alternative 9: Top-income-quintile households re-optimize to draw down 25% of their financial assets by the end of their planning horizon (instead of 50%), consistent with a high bequest motive and historical excess conservatism during retirement.
The chart below shows our estimate of future demographics-driven U.S. household fixed income flows by scenario. These projections are NOT meant to be interpreted as forecasts of the actual dollar volume of flows, in part because the $31 trillion stock of household financial assets used to model these flows omits certain large asset pools (see our technical note further on). So focus on the trends depicted, not on the dollars.


As you can see in the chart, across almost all of our scenarios demographics remain a fixed income tailwind for the next 10 years, and in most scenarios longer. Note that this analysis may lean conservative in that we have modeled potential flows based only on the existing stock of financial assets. Yet every year, mature adult workers (especially the high income earners) will invest some portion of their savings in financial assets, including bonds, both inside and outside their retirement plans. These flows, all else equal, represent a tailwind for all financial assets that we haven’t attempted to model.

Finally, a technical note on our primary source for U.S. household financial asset data: the Federal Reserve’s 2013 Survey of Consumer Finances. To our knowledge, there are two primary sources for U.S. household balance sheet detail: the Federal Reserve’s Survey of Consumer Finances (“SCF”), a triennial survey of a cross-section of U.S. households, and the U.S. national flow of funds accounts. We use the SCF, which is widely used in Federal Reserve analysis, academic research at major economic research centers, and private financial industry analysis and writings. The SCF is, to our knowledge, unparalleled in its demographic granularity across age groups, income quintiles and other key variables.

Significant differences are worth highlighting between the SCF and the household balance sheet data contained in the U.S. national accounts. Of note, the 2013 SCF excludes about $19 trillion in DB pension entitlements and $2.4 trillion in assets of nonprofit institutions. As a result of these and certain other omissions, the SCF identifies a materially lower total value for U.S. household financial assets than the national accounts identify. The question, for us, is whether there is any reason to think that the omissions made by the SCF, notably DB pension entitlements, will bias our results. 

We see no obvious bias. At a high level, DB pension plan asset allocations tend to be a function more of the level of interest rates and plan funding status than of the age profile of plan beneficiaries. Also, as we’ve argued in the body of our note, as the U.S. shifts from defined benefit to defined contribution schemes we may see additional support for fixed income given that DB plans seem to allocate less to bonds than a market average glide path suggests is optimal for DC participants. For these reasons, we think using a source that excludes DB pension entitlements likely leads us – if anything – to underestimate demographics-related fixed income demand over the next decade.

See the recent research paper linked below, from the Federal Reserve, for a more detailed explanation of the differences between SCF data and data from the U.S. national flow of funds accounts, as well as a defense of the use of SCF data in economic research: http://www.federalreserve.gov/econresdata/feds/2015/files/2015086pap.pdf

Works consulted
  • Mercedes Aguirre and Brendan McFarland, “2014 Asset Allocations in Fortune 1000 Pension Plans,” Towers Watson, October 2015.
  • Robert Arnott and Denis Chaves, “Demographic Changes, Financial Markets, and the Economy,” Financial Analysts Journal Volume 68 Number 1, 2012.
  • Charles Bean et al., “Low for Long? Causes and Consequences of Persistently Low Interest Rates,” Geneva Reports on the World Economy 17, International Center for Monetary and Banking Studies, October 2015.
  • Lisa Dettling et al., “Comparing Micro and Macro Sources for Household Accounts in the United States: Evidence from the Survey of Consumer Finances,” Finance and Economics Discussion Series 2015-086, Washington: Board of Governors of the Federal Reserve System, 2015.
  • “The Eurosystem Household Finance and Consumption Survey,” Statistical Paper Series No 2, European Central Bank, April 2013.
  • “2013 Survey of Consumer Finances (SCF),” Federal Reserve, September 2014.
  • Michael Gapen, “Demand for safe havens to remain robust,” Barclays Equity Gilt Study, February 2013.
  • Michael Gavin, “Population dynamics and the (soon-to-be-disappearing) global ‘savings glut,’” Barclays, February 2015.
  • Charles Goodhart et al., “Could Demographics Reverse Three Multi-Decade Trends?” Morgan Stanley, September 2015.
  • Dr. Michaela Grimm et al., “Allianz Global Wealth Report 2015,” Allianz SE, August 2015.
  • Markus Lorenz et al., “Man and Machine in Industry 4.0: How Will Technology Transform the Industrial Workforce Through 2025?” Boston Consulting Group, September 2015.
  • Dr. Susan Lund, “The Impact of Demographic Shifts on Financial Markets,” McKinsey Global Institute, June 2012.
  • “Pension Markets in Focus,” The Organisation for Economic Co-operation and Development, 2015.
  • James Poterba et al., “The Composition and Draw-Down of Wealth in Retirement,” NBER Working Paper 17536, October 2011.
  • Karen Smith et al., “How Seniors Change Their Asset Holdings During Retirement,” Center for Retirement Research at Boston College Working Paper 2009-31, December 2009.
1 PIMCO Viewpoint “What’s Your Number at the Zero Bound”, by Dr. James Moore, 2012.
2 2013 represents most current data available.
3 Our argument would be even stronger if we could show that the personal savings rate among high-earning seniors in their late 60s and early 70s has been increasing over time (parallel to the rise in labor force participation). However, the BLS has advised us that a comparison between 2014 data and prior-year data may be misleading due to recent changes in survey methodology.
4 From 2000 to 2050, our dynamic ratio – mechanically – is a weighted average of two individual static ratios (35–64 versus 65+ and, separately, 35–69 versus 70+); the weights change each year to reflect our assumption about rising longevity.
5 See, for instance, “The Impact of Demographic Shifts on Financial Markets” (McKinsey Global Institute, 2012).
6 “How Seniors Change Their Asset Holdings During Retirement” (Smith et al, 2009).
7Validity of global Buyers versus Sellers Ratio depends on the extent to which asset accumulation-drawdown patterns among the high-earning elderly outside the U.S. mirror the patterns observed among U.S. elderly. We have not explored this question empirically and include the global ratio only for interest and context.
8 See Appendix for a technical note on our choice of the Federal Reserve’s Survey of Consumer Finances for U.S. household financial asset detail.
9 U.S. household financial assets, as depicted in the Federal Reserve’s 2013 Survey of Consumer Finances, total $31 trillion across all age groups.
10 Source: Allianz Global Wealth Report, 2015.
11 For color on U.S. DB pension plan asset allocations, see, for example, the OECD’s “Pension Markets in Focus” (2015) and Towers Watson’s “2014 Asset Allocations in Fortune 1000 Pension Plans” (2015).
12 Source: NextCapital.
13 See “Demographic Changes, Financial Markets, and the Economy” (Arnott and Chaves / CFA Institute, 2012).
14 For simplicity, we assume that anyone who dies younger than age 65 bequeaths assets to a spouse of comparable age (i.e., no change in asset allocation) while those who die at or after age 65 bequeath assets to someone (presumably children) 30 years younger (i.e., a generation earlier in risk tolerance). We recognize that not every elderly person bequeaths assets to a younger heir; some assets are passed on to charitable organizations and friends or other family members of comparable age, for instance. We assume, arbitrarily, that 50% of financial assets are passed to younger heirs. Our general results are not particularly sensitive to changes in these assumptions.

Like Outside the Box? Sign up today and get each new issue delivered free to your inbox. It's your opportunity to get the news John Mauldin thinks matters most to your finances.

The article Outside the Box: 70 Is the New 65 was originally published at mauldineconomics.com.


Get out latest FREE eBooK "Understanding Options"....Just Click Here

Stock & ETF Trading Signals