One of the biggest movers over the past few months has been the recovery of the Oil/Gas/Energy sector after quite a bit of sideways/lower price trending. You can see from this XOP chart, below, a 44% upside price rally has taken place since early November, and XOP has recently rotated moderately downward – setting up another potential trade setup if this rally continues. Traders know, the trend if your friend. Another upside price swing in the XOP, above $72, would suggest this rally mode is continuing.
Recently, we published a research article suggesting a lower U.S. Dollar would prompt major sector rotations in the US and global markets where we highlighted the fact that the Materials, Industrials, Technology, and Discretionary sectors had been the hottest sectors of the past 180 days, but the Energy, Financials, Materials, and Industrials had shown the best strength over the past 90 days....Read More Here.
Showing posts with label NASDAQ. Show all posts
Tuesday, January 26, 2021
Saturday, November 14, 2020
Gold's Momentous Rally from 2000 Compared to SPY and QQQ - Part I
My research team and I went off on a wild tangent trying to identify how the markets could react to the recent spike in price activity on Monday, November 9, 2020. This is the day that Pfizer announced a 90% effective rate with its new COVID-19 vaccine, causing the US stock market to skyrocket higher before the opening bell in New York. As with most pop and drops, this incredible upside spike trailed lower for the remainder of the trading day. My research team was curious if this type of setup presented any real future outcome or trends. To this end, we focused on the QQQ and the SPY in relationship to Gold.
Gold has been and continues to be a store of value for many around the world. At some times in history, Gold becomes undervalued in comparison to other assets (like stocks, real estate, and other tangible assets). At other times, Gold becomes more highly valued in comparison to other assets. This cycle has taken place throughout hundreds of years of history, and is rooted in the changing perceptions of market participants regarding “what/where is true value in the markets”.
When other assets are skyrocketing higher, Gold is out of favor in terms of real demand. It may still be moving higher in value, but as long as other assets seem to be increasing in value faster than Gold, demand for Gold will diminish. When most other assets enter a time of great concern or devaluation, Gold and Precious Metals usually begin to see stronger demand as the ratio between Gold prices and more traditional investment assets may be near extremes....Continue Reading Here.
9 to 9 1/2 Year Gold Depreciation Cycle Ended in 2018 – What’s Next?
Gold has been and continues to be a store of value for many around the world. At some times in history, Gold becomes undervalued in comparison to other assets (like stocks, real estate, and other tangible assets). At other times, Gold becomes more highly valued in comparison to other assets. This cycle has taken place throughout hundreds of years of history, and is rooted in the changing perceptions of market participants regarding “what/where is true value in the markets”.
When other assets are skyrocketing higher, Gold is out of favor in terms of real demand. It may still be moving higher in value, but as long as other assets seem to be increasing in value faster than Gold, demand for Gold will diminish. When most other assets enter a time of great concern or devaluation, Gold and Precious Metals usually begin to see stronger demand as the ratio between Gold prices and more traditional investment assets may be near extremes....Continue Reading Here.
Labels:
Chris Vermeulen,
Gold,
NASDAQ,
Silver,
stocks,
The Technical Traders
Monday, July 20, 2020
U.S. Stock Market Stalls Near a Double Peak
The U.S. stock market stalled early this week as earnings started to hit. A number of news and other items are pending with earnings just starting to roll in. There have been some big numbers posted from JP Morgan and Goldman Sachs. Yet, the markets have reacted rather muted to these blowout revenues.
We believe this is a technical “Double Top” set up in the making. The NASDAQ has been much weaker than the S&P and the Dow Industrials. We believe the US stock market is reacting to the reality of earnings and forward guidance after the recent rally in price levels over the past 9+ weeks. If we are correct and this Double-Top pushes price levels lower, then this technical resistance level may become the price ceiling headed into Q3 and Q4 2020.
Let's start with the E-MINI S&P 500 Weekly Chart....Continue Reading Here
We believe this is a technical “Double Top” set up in the making. The NASDAQ has been much weaker than the S&P and the Dow Industrials. We believe the US stock market is reacting to the reality of earnings and forward guidance after the recent rally in price levels over the past 9+ weeks. If we are correct and this Double-Top pushes price levels lower, then this technical resistance level may become the price ceiling headed into Q3 and Q4 2020.
Let's start with the E-MINI S&P 500 Weekly Chart....Continue Reading Here
Monday, February 18, 2019
Here We Go - Get Ready for the Breakout Pattern Setup
We are writing this post today with a few forward-looking expectations while attempting to warn traders that some extended rotation is likely to enter the markets over the next 30+ days. If you’ve been following our research, you’ll know that we’ve been calling these move months in advance of other researchers and analysts. Our September 17, 2018 research post highlighting our Adaptive Dynamic Learning predictive modeling system suggested the U.S. stock markets were poised for a massive price rotation followed by a very unique price setup that we are experiencing now.
Currently, the YM (Dow Futures Contracts) are leading the pack on a dramatic upside breakout move. This is likely a result of the US government spending bill that is recently working its way towards approval and the fact that this new spending bill clears the way for at least 8+ months of uninterrupted market optimism (or at least we hope). This 300+ point upside move clearly breaks price highs and puts the U.S. stock market, at least the Dow/Blue-Chips, back into “new high trending mode”. As many of you are likely aware, our Fibonacci price study teaches us that price must ALWAYS seek to establish new price highs or new price lows AT ALL TIMES. Thus, these new price highs are a very strong indication that the upside trend is dominant and should continue for a while.
Additionally, we want to highlight what we believe will be a similar price pattern to 2015/2016 in the U.S. markets – a multiple Price Wedge formation that could ultimately set up another price leg (which we believe will be higher, to the upside, at this time).
In the next article “PART II” pay close attention to the charts and images as we are attempting to clearly illustrate how and why price rotation is about to hit the US markets and why you need to be prepared for this move.
We continue to read that large amounts of capital are sitting on the sidelines or have been pulled from the markets over the past 12+ months. We understand this as the rotation in early 2018 frightened many investors and the continued sideways price action, global market concerns and geopolitical issues have caused international investors to want to protect their investments from risk – thus they move their capital into cash. We get it. But we also believe the next breakout in the U.S. markets will be a great opportunity for skilled traders to identify and prepare for an incredible profit potential no matter which way the market breaks up or down because technical analysis allows us to closely follow the direction of the market.
The amount of capital that is sitting on OUTSIDE the markets, currently, represents a massive amount of resources that could re-enter the markets when traders/investors decide the timing is right. We’ve termed this a “Capital Shift”.
In simple terms, it reflects capital/cash moving from one market to another or from actively invested to cash, then back to actively invested. Our belief is that capital operates in a manner to always protect itself from risk while attempting to identify suitable returns. The best environment for capital is always a relatively safe investment with protective values and a high probability of decent returns. Therefore, this massive amount of capital not being deployed in the global markets will, at some time, re-enter the markets and will likely increase pricing valuations.
How and when will this capital re-enter the markets? What will price activity look like and how will we know when the timing is right for our own strategic deployment of our trading capital? Continue reading to learn why we believe we are only 30~45 days away from an incredible trading setup. You won’t want to miss this one.
Please take a minute to visit The Technical Traders to learn how we can help you find and execute better trade in 2019 and stay ahead of these market moves. We are confident that you will find our Daily Video, Detailed Market Research, Proprietary Research Tools and Detailed Trading Signals will help you make 2019 an incredibly successful year.
Chris Vermeulen
Technical Traders Ltd.
Currently, the YM (Dow Futures Contracts) are leading the pack on a dramatic upside breakout move. This is likely a result of the US government spending bill that is recently working its way towards approval and the fact that this new spending bill clears the way for at least 8+ months of uninterrupted market optimism (or at least we hope). This 300+ point upside move clearly breaks price highs and puts the U.S. stock market, at least the Dow/Blue-Chips, back into “new high trending mode”. As many of you are likely aware, our Fibonacci price study teaches us that price must ALWAYS seek to establish new price highs or new price lows AT ALL TIMES. Thus, these new price highs are a very strong indication that the upside trend is dominant and should continue for a while.
Additionally, we want to highlight what we believe will be a similar price pattern to 2015/2016 in the U.S. markets – a multiple Price Wedge formation that could ultimately set up another price leg (which we believe will be higher, to the upside, at this time).
In the next article “PART II” pay close attention to the charts and images as we are attempting to clearly illustrate how and why price rotation is about to hit the US markets and why you need to be prepared for this move.
We continue to read that large amounts of capital are sitting on the sidelines or have been pulled from the markets over the past 12+ months. We understand this as the rotation in early 2018 frightened many investors and the continued sideways price action, global market concerns and geopolitical issues have caused international investors to want to protect their investments from risk – thus they move their capital into cash. We get it. But we also believe the next breakout in the U.S. markets will be a great opportunity for skilled traders to identify and prepare for an incredible profit potential no matter which way the market breaks up or down because technical analysis allows us to closely follow the direction of the market.
The amount of capital that is sitting on OUTSIDE the markets, currently, represents a massive amount of resources that could re-enter the markets when traders/investors decide the timing is right. We’ve termed this a “Capital Shift”.
In simple terms, it reflects capital/cash moving from one market to another or from actively invested to cash, then back to actively invested. Our belief is that capital operates in a manner to always protect itself from risk while attempting to identify suitable returns. The best environment for capital is always a relatively safe investment with protective values and a high probability of decent returns. Therefore, this massive amount of capital not being deployed in the global markets will, at some time, re-enter the markets and will likely increase pricing valuations.
How and when will this capital re-enter the markets? What will price activity look like and how will we know when the timing is right for our own strategic deployment of our trading capital? Continue reading to learn why we believe we are only 30~45 days away from an incredible trading setup. You won’t want to miss this one.
Please take a minute to visit The Technical Traders to learn how we can help you find and execute better trade in 2019 and stay ahead of these market moves. We are confident that you will find our Daily Video, Detailed Market Research, Proprietary Research Tools and Detailed Trading Signals will help you make 2019 an incredibly successful year.
Chris Vermeulen
Technical Traders Ltd.
Labels:
capital,
Chris Vermeulen,
Dow,
Fibonacci,
geopolitical,
market,
money,
NASDAQ,
risk,
stocks,
The Technical Traders
Wednesday, October 3, 2018
Why We Expect a 3rd Quarter Earnings Surprise
Our focus is on developing and deploying very specialized price modeling and predictive analysis systems. Our objective is to inform our members of these potential price moves and to assist them in finding successful trading opportunities. We are alerting all of our followers of a potential move today, because we believe this move could frighten some investors as we expect price rotation as Q3 earnings data is released just before the November 2018 mid-term elections.
The weekly $INDU (Dow Industrial Average) chart shows our Adaptive Predictive Learning (ADL) modeling system at work. In this example, we asked our ADL system what it believed would be the most likely outcome originating from July 23, 2018. The reason we selected this date is because this weekly price bar prompted the current upside price move. This type of price trigger can often generate highly accurate future predictive price data.
This bar consisted of 11 unique price markers that predict future price moves, first lower, then back to the upside, with a range of probability from 83% to 96%. The initial downside price move suggests that an initial -800 to -1000 pt move (-4%) will take place before November 10, 2018. Subsequently, price should begin to move upward again after the US mid-term elections and through the end of 2018.
In conclusion, October is known as a weak month for US equities so get ready for price volatility and expect the Tech heavy NASDAQ to rotate in a larger range than the S&P and the $INDU. Additionally, expect the VIX to increase in value over the next 30+ days as October passes.
I will admit the charts in July/Early September were showing signs of a market correction in mind September but no bearish reversal pattern formed and price continued higher. During this time we closed out a position in YINN for 14% profit and another 4.3% in the IYT ETF. This goes to show how we can profit to the long side even when we are expecting a sell off the markets. We trade based on technical analysis and use our ADL and other forecasting analysis to add more conviction to a move, but we don’t trade based on predictions along.
If you want to know how we help our members find and execute for greater success, visit The Technical Traders to see our completed trades for this year and learn how we can help you find great opportunities now and in the future.
Chris Vermeulen
The weekly $INDU (Dow Industrial Average) chart shows our Adaptive Predictive Learning (ADL) modeling system at work. In this example, we asked our ADL system what it believed would be the most likely outcome originating from July 23, 2018. The reason we selected this date is because this weekly price bar prompted the current upside price move. This type of price trigger can often generate highly accurate future predictive price data.
This bar consisted of 11 unique price markers that predict future price moves, first lower, then back to the upside, with a range of probability from 83% to 96%. The initial downside price move suggests that an initial -800 to -1000 pt move (-4%) will take place before November 10, 2018. Subsequently, price should begin to move upward again after the US mid-term elections and through the end of 2018.
In conclusion, October is known as a weak month for US equities so get ready for price volatility and expect the Tech heavy NASDAQ to rotate in a larger range than the S&P and the $INDU. Additionally, expect the VIX to increase in value over the next 30+ days as October passes.
I will admit the charts in July/Early September were showing signs of a market correction in mind September but no bearish reversal pattern formed and price continued higher. During this time we closed out a position in YINN for 14% profit and another 4.3% in the IYT ETF. This goes to show how we can profit to the long side even when we are expecting a sell off the markets. We trade based on technical analysis and use our ADL and other forecasting analysis to add more conviction to a move, but we don’t trade based on predictions along.
If you want to know how we help our members find and execute for greater success, visit The Technical Traders to see our completed trades for this year and learn how we can help you find great opportunities now and in the future.
Chris Vermeulen
Monday, June 11, 2018
Here’s Why We See the G7, Central Banks and U.S. Fed Will Drive Stock Prices this Week
After last weeks closing bell for stocks and the early signs of the Capital Market Shift which we mentioned previously was taking place are now clearly evident. We wanted to alert all of our followers that this week could be very dramatic with a number of key events playing into global expectations.
Our research team at Technical Traders Ltd. have been combing through the charts trying to find hints of what may happen and what to expect in terms of price volatility next week. We know our ADL price modeling system is telling us that certain price weakness will continue in certain sectors and strength in others – but we are searching for the next opportunities for great trades.
One of the key elements of the G7 meeting is the continued communication regarding global participation in key infrastructure projects and national cooperation in regards to economic stability.
Over the past 8+ years, the bulk of the global recovery has been based on the US economic stability and recovery. US interest rates allowed for a global “carry trade” that supported a large component of the economic bias in foreign countries. Additionally, the deeply discounted U.S. bonds provided a “fire sale” opportunity for many countries to secure U.S. Treasuries at a time when global central banks were printing cash to support failing economies. Overall, the economic conditions from 2009 to 2015 were such that every opportunity was provided to the global markets to make it easier to attempt a proper recovery.
Some nations were able to capitalize on this environment while others squandered the opportunity to create future growth, capabilities and new opportunities for success. Given the current global market environment, we expect some harsh comments to come from the G7 meeting as well as some wishful thinking comments. Overall, we believe the outcome of the G7 meeting will become a defining moment for the remainder of the year in terms of global economic expectations and forward intent. It will certainly be interesting to see how these leaders decide to operate within the constructs of the ever changing global market liabilities to say the least.
Right now, a lot of concern has been directed towards the Emerging Markets and what appears to be a near term market collapse. Debt spreads and global indexes have been moving in a pattern that clearly illustrates the Central Banks problems in containing the diverse economic conditions throughout the globe. Infrastructure projects, social/political shifts and currency valuations are complicating matters by creating extended pressures in many global economies recently. All of this centers around the strength of the U.S. economy and the US dollar as related to expectations and valuations of other foreign economies and currencies.
Almost like a double edged sword, as the U.S. economy/dollar continues to strengthen, foreign capital will migrate into these US assets because of the inherent protection and gains provided by the strength and growth of these markets. While at the same time, the exodus of capital from these foreign markets create a vacuum of value/capability that results in a continued decline in asset valuations and more.
Almost like the 1994 Asian Currency Crisis, the more the US economy strengthens, the more pressures the global markets feel as valuations and assets become more risky to investors. As investors flee this risk, they search for safe returns and value that is found in the US economy/Dollar – driving US equities higher and strengthening the US Dollar. It is a cycle that will likely continue until some equilibrium point is reached in the future.
The US markets are on a terror rally because global capital is searching and seeking the greatest returns possible – and the only place on the planet, right now, that is offering this type of return is the US economy and the US equities market. Our recent research shows that the NASDAQ indexes may stall and rotate over the next few months as price valuations have accelerated quite far and because the blue chips are relatively undervalued at the moment. This means, capital will likely continue to pour into the S&P and DOW heavyweights as this capital shift continues to play out.
The G7 meeting, in Toronto, this week will likely present some interesting outcomes. Early talk is that the G6 nations (minus the US) may enact some deal that they believe would be suitable for these nations going forward. Our concern is not the deal or the threat of these nations trying to engage in some deal without the US – far from it. Our concern is that their wishes may be grandiose and ill timed given these currency and valuation issues.
Imagine, for a second, the G6 nations engage in some grand scheme to engage in something to spite the USA. Some plan that seems big and bold and over the top. Yet, 5 months from now, debt issues plague these nations, currency valuations have destroyed any advantage they may have perceived they had and the member nations are beginning to feel the pressures of their own entrapment. What then? The USA to the rescue....again?
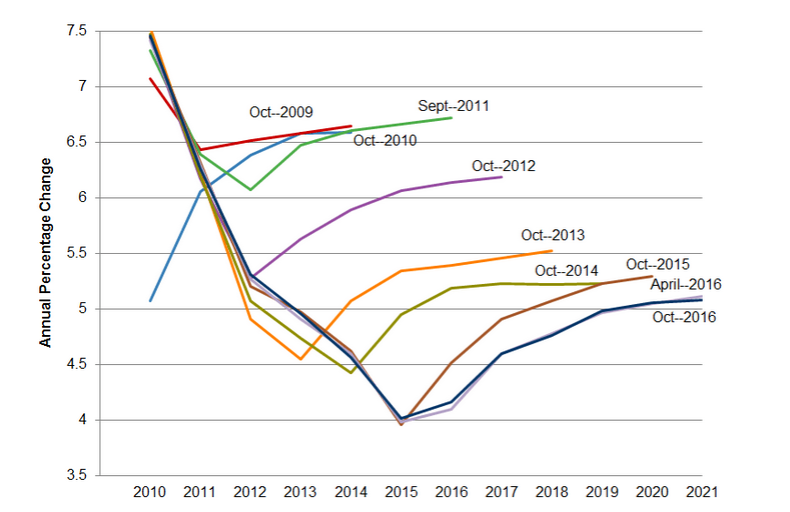
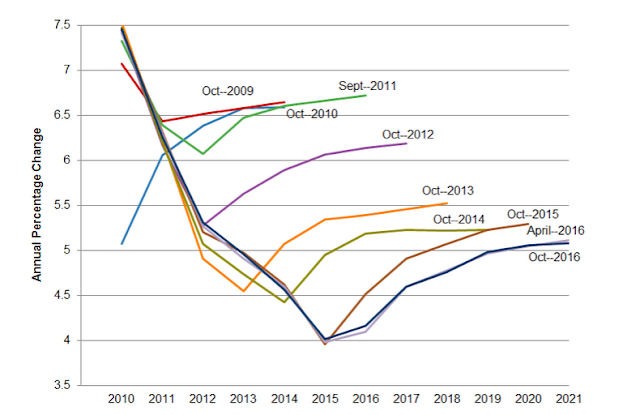
Recently, Ben Bernanke, a Senior Fellow at The Brookings Institute, warned that Donald Trump’s economy was like a Wile E. Coyote going over a cliff. Everything seems well and fine till the road ends and the cliff begins. I would like to remind all of our readers that The Brookings Institute does not have a stellar record of predicting much of anything over the past 10+ years. Take a look at this graph showing the economic expectations and predictions from The Brookings Institute over the past decade or so. Do these people seem capable of accurately predicting anything regarding the U.S. or global economy?
Now, ignoring all of the what if scenarios that are being presented by different people. The bottom line is that the next 6+ months are going to be very exciting for traders and investors. There are huge issues that are unfolding in the global economy right now. Currency levels are about to be shaken even further and the G6 nations, by the time they complete their high priced dinners and evening events, will walk out of the G7 meeting staring down a greater global debt/currency/economic beast of their own creation.
China is in the midst of a massive debt cycle that is about to play out over the next 18+ months (totaling about 1.8 Trillion Yuan).
The Hang Seng Index is setting up a possible topping pattern that could break down given state and corporate debt concerns.
The G6 better have some rabbits in their hats that they can magically transform into big bullish projects over the next 12 months or the economic functions that are at play in the world already are likely to steamroll over the top of any news that originates from the G7 meeting.
The U.S. markets are setup for a continued bullish rally with a bit of Summer capital shifts. Our recent research called the rotation out of the tech heavy NASDAQ and a renewed capital shift into the S&P and the DOW leaders. This rotation is likely to continue for many weeks or months as global investors realize the earnings capabilities and dividends values within the U.S. blue chips are of far greater long term value than the risks associated with technology and bio-tech firms. Because of this, we believe the S&P and DOW/Transports are setting up for a massive price rally to break recent all time market highs.
Here is a Daily chart of the YM futures contract showing the recent price breakout and rally. Our expectation is that 26,000 will be breached within 30 days or so and that a large capital shift will drive a continued advance through the end of 2018 – possibly further.
Here is a Daily $TRANS chart showing a similar bullish move. Although the Transportation Index has not broken to new highs yet, we believe this upside move is just beginning and we believe the continued improvements in the US economy will drive the Transportation index to near 11,450 or higher before the end of this year.
Our opinion continues to support the hypothesis that the US markets are the only game on the planet (at the moment) and that a great capital shift is underway in terms of investment in, purchases of and generally opportunistic investment opportunities for US equities and markets going forward. Until something changes where the US dollar strength, foreign economic weakness and foreign debt cycles are abated or resolved, we believe the great capital shift that we have been warning of will continue which will put continued pressures on certain foreign markets and expand debt burdens of at risk nations over time.
Smart traders will be able to identify these opportunities and capitalize on them. They will see this shift taking place and take advantage of the opportunities that arise for quick and easy profits. If you like our research and our understanding of the global markets, be sure to join our premium research and Trade Alert Wealth Building Newsletter. Our valued members stay with us because we have continually proven to be ahead of nearly every market move this year – in many cases many months ahead of the global markets. So, with all of this playing out over the next 6+ months, we suggest you consider joining The Technical Traders to learn how we can help to keep you out of trouble and ahead of the markets for greater success.

Our research team at Technical Traders Ltd. have been combing through the charts trying to find hints of what may happen and what to expect in terms of price volatility next week. We know our ADL price modeling system is telling us that certain price weakness will continue in certain sectors and strength in others – but we are searching for the next opportunities for great trades.
One of the key elements of the G7 meeting is the continued communication regarding global participation in key infrastructure projects and national cooperation in regards to economic stability.
Over the past 8+ years, the bulk of the global recovery has been based on the US economic stability and recovery. US interest rates allowed for a global “carry trade” that supported a large component of the economic bias in foreign countries. Additionally, the deeply discounted U.S. bonds provided a “fire sale” opportunity for many countries to secure U.S. Treasuries at a time when global central banks were printing cash to support failing economies. Overall, the economic conditions from 2009 to 2015 were such that every opportunity was provided to the global markets to make it easier to attempt a proper recovery.
Some nations were able to capitalize on this environment while others squandered the opportunity to create future growth, capabilities and new opportunities for success. Given the current global market environment, we expect some harsh comments to come from the G7 meeting as well as some wishful thinking comments. Overall, we believe the outcome of the G7 meeting will become a defining moment for the remainder of the year in terms of global economic expectations and forward intent. It will certainly be interesting to see how these leaders decide to operate within the constructs of the ever changing global market liabilities to say the least.
Right now, a lot of concern has been directed towards the Emerging Markets and what appears to be a near term market collapse. Debt spreads and global indexes have been moving in a pattern that clearly illustrates the Central Banks problems in containing the diverse economic conditions throughout the globe. Infrastructure projects, social/political shifts and currency valuations are complicating matters by creating extended pressures in many global economies recently. All of this centers around the strength of the U.S. economy and the US dollar as related to expectations and valuations of other foreign economies and currencies.
Almost like a double edged sword, as the U.S. economy/dollar continues to strengthen, foreign capital will migrate into these US assets because of the inherent protection and gains provided by the strength and growth of these markets. While at the same time, the exodus of capital from these foreign markets create a vacuum of value/capability that results in a continued decline in asset valuations and more.
Almost like the 1994 Asian Currency Crisis, the more the US economy strengthens, the more pressures the global markets feel as valuations and assets become more risky to investors. As investors flee this risk, they search for safe returns and value that is found in the US economy/Dollar – driving US equities higher and strengthening the US Dollar. It is a cycle that will likely continue until some equilibrium point is reached in the future.
The US markets are on a terror rally because global capital is searching and seeking the greatest returns possible – and the only place on the planet, right now, that is offering this type of return is the US economy and the US equities market. Our recent research shows that the NASDAQ indexes may stall and rotate over the next few months as price valuations have accelerated quite far and because the blue chips are relatively undervalued at the moment. This means, capital will likely continue to pour into the S&P and DOW heavyweights as this capital shift continues to play out.
The G7 meeting, in Toronto, this week will likely present some interesting outcomes. Early talk is that the G6 nations (minus the US) may enact some deal that they believe would be suitable for these nations going forward. Our concern is not the deal or the threat of these nations trying to engage in some deal without the US – far from it. Our concern is that their wishes may be grandiose and ill timed given these currency and valuation issues.
Imagine, for a second, the G6 nations engage in some grand scheme to engage in something to spite the USA. Some plan that seems big and bold and over the top. Yet, 5 months from now, debt issues plague these nations, currency valuations have destroyed any advantage they may have perceived they had and the member nations are beginning to feel the pressures of their own entrapment. What then? The USA to the rescue....again?
Recently, Ben Bernanke, a Senior Fellow at The Brookings Institute, warned that Donald Trump’s economy was like a Wile E. Coyote going over a cliff. Everything seems well and fine till the road ends and the cliff begins. I would like to remind all of our readers that The Brookings Institute does not have a stellar record of predicting much of anything over the past 10+ years. Take a look at this graph showing the economic expectations and predictions from The Brookings Institute over the past decade or so. Do these people seem capable of accurately predicting anything regarding the U.S. or global economy?
Now, ignoring all of the what if scenarios that are being presented by different people. The bottom line is that the next 6+ months are going to be very exciting for traders and investors. There are huge issues that are unfolding in the global economy right now. Currency levels are about to be shaken even further and the G6 nations, by the time they complete their high priced dinners and evening events, will walk out of the G7 meeting staring down a greater global debt/currency/economic beast of their own creation.
SE Asia is in the process or rewriting and resolving issues of the past 10+ years (see Malaysia / Singapore).
China is in the midst of a massive debt cycle that is about to play out over the next 18+ months (totaling about 1.8 Trillion Yuan).
The Brasil Bovespa Index has rotated into new BEARISH territory.
The Mexican iShares (EWW) ETF is about to break multi-year lows.
The Hang Seng Index is setting up a possible topping pattern that could break down given state and corporate debt concerns.
The iShares Turkey (EURONEXT) index has already broken to new multi-year lows.
The G6 better have some rabbits in their hats that they can magically transform into big bullish projects over the next 12 months or the economic functions that are at play in the world already are likely to steamroll over the top of any news that originates from the G7 meeting.
The U.S. markets are setup for a continued bullish rally with a bit of Summer capital shifts. Our recent research called the rotation out of the tech heavy NASDAQ and a renewed capital shift into the S&P and the DOW leaders. This rotation is likely to continue for many weeks or months as global investors realize the earnings capabilities and dividends values within the U.S. blue chips are of far greater long term value than the risks associated with technology and bio-tech firms. Because of this, we believe the S&P and DOW/Transports are setting up for a massive price rally to break recent all time market highs.
Here is a Daily chart of the YM futures contract showing the recent price breakout and rally. Our expectation is that 26,000 will be breached within 30 days or so and that a large capital shift will drive a continued advance through the end of 2018 – possibly further.
Here is a Daily $TRANS chart showing a similar bullish move. Although the Transportation Index has not broken to new highs yet, we believe this upside move is just beginning and we believe the continued improvements in the US economy will drive the Transportation index to near 11,450 or higher before the end of this year.
Our opinion continues to support the hypothesis that the US markets are the only game on the planet (at the moment) and that a great capital shift is underway in terms of investment in, purchases of and generally opportunistic investment opportunities for US equities and markets going forward. Until something changes where the US dollar strength, foreign economic weakness and foreign debt cycles are abated or resolved, we believe the great capital shift that we have been warning of will continue which will put continued pressures on certain foreign markets and expand debt burdens of at risk nations over time.
Smart traders will be able to identify these opportunities and capitalize on them. They will see this shift taking place and take advantage of the opportunities that arise for quick and easy profits. If you like our research and our understanding of the global markets, be sure to join our premium research and Trade Alert Wealth Building Newsletter. Our valued members stay with us because we have continually proven to be ahead of nearly every market move this year – in many cases many months ahead of the global markets. So, with all of this playing out over the next 6+ months, we suggest you consider joining The Technical Traders to learn how we can help to keep you out of trouble and ahead of the markets for greater success.

Labels:
bonds,
capital,
Chris Vermeulen,
Debt,
EWW,
Gas,
Hang Seng Index,
NASDAQ,
Oil,
stocks,
Technical Traders,
transports
Monday, June 4, 2018
These Three Key Elements Will Drive Stocks Higher Into Year End
Last week was a roller coaster ride for traders and investors. After a long holiday weekend, traders were greeted with concerns originating in Italy regarding political stability and the potential that any further issues could result in a collapse of the EU. Even though the risk of this happening was somewhat minor, the US markets tanked near 2% as fear seemed to override common sense. The rest of this week has been a wild ride of price rotation within a range. We’ve been reading all types of news and comments regarding all types of “what if” scenarios from analysts and researchers while scratching our heads at some of the comments.
As we stated in our earlier article regarding the Italy political crisis [read it here], the one important aspect to trading and investing is to not lose focus on the true perspective and true market fundamentals. Yes, if you are an intraday trader, these wild price swings can either be great profits or wild losses as you try to swing with these rotational moves. As a swing traders/investor, though, we care about the overall stability and direction of the markets. We are willing to ride out some rotation as long as our core analysis is sound and the technical and fundamental basis of our trades is still in place.
In our opinion, there are three things that are core elements of our analysis at the moment and these three things are likely driving the economic future of the US equity markets.
The US Dollar continues to strengthen as the US economy shows solid signs of a broad based economic increase. Oil/Energy prices have continued to decline recently, now down nearly 10% from the recent peak, and this decrease relates to supply and demand expectations throughout the end of this year (roughly 4 - 6 months into the future). The Transportation Index is pushing higher as stronger economic activity is expected throughout the rest of 2018 and into 2019.
These Three Key Elements Cross-Populate as Follows
1. The strong US dollar is acting like a magnet for foreign capital investment as the strength of the US dollar in combination with the strength of the US economy/equities markets creates a triple-whammy for foreign capital investments. Not only are foreign investors trying to avoid capital devaluation (currency price devaluation) and debt risks in their own local markets, they are trying to find ways to achieve ROI and stability for their capital investments. With almost nowhere else to go, the US equities markets and debt markets are pretty much the only place on the planet for this triple-whammy opportunity.
2. The strong US jobs numbers and robust economic activity, in combination with the past capital market stimulus and lowered interest rates, are creating a fuel heavy economic environment in the US not that President Trump’s deregulation and policies have injected the Oxygen needed to create the “economic combustion” that is driving this current growth. Energy prices are moderate and dropping as a result of the shift in technologies attributed to electric and hybrid transportation enterprises. All of this, jobs growth, earning growth, economic growth, moderately low interest rates and a true combusting economy, provides for much greater opportunities for an advancing US equities market.
3. The US equities markets are rotating higher throughout the global weakness and debt concerns while the Transportation index pushes higher as a sign that US investors expect the US economy to continue to grow. Transportations lead the us equities markets by about 4 to 6 months (on average). Lower oil prices, strong jobs numbers, dynamic opportunities in the US economy and a stronger US dollar drive continued US and foreign investments into the US equities markets and debt markets.
As we have stated in earlier research posts regarding “capital migration”, capital (cash) is always seeking the best environments for stability, growth and opportunity in a continual effort to balance risk vs. reward. Capital is capable of moving across the planet relatively quickly in most cases and is always seeking the best opportunity for ROI and stability while trying to balance unknown risks and devaluation. Right now, the only games in town are the established economies, the US, Canadian and UK markets.
As you can see in the graph below US investments continue to grow as the best risk/reward for capital.
Our opinion is that until something dramatic changes this current global economic environment and risk unknown, capital will continue to rush into the US markets even if the US dollar continues to climb or oil continues to fall. The only thing that can change this equation is the one key factor in understanding risk vs. reward – when does the opportunity for reward outweigh the risk of complete failure by applying capital into any other foreign or non-established market environment? When investors believe the reward of moving capital out of the US equity markets in search of new opportunities or advantageous risk/reward setups in foreign markets exists, that is when we’ll see a change in investment dynamics resulting in more downside pricing pressure in the US markets – and we don’t believe that will happen within the immediate 4~6+ month span.
Pay attention to our most recent research as we have been dead-on in terms of calling these market swings. The NQ chart, below, shows how the tech heavy NASDAQ is leading the breakout while the YM and ES markets lag a bit. We believe all of these US majors are in the process of breaking to new all time price highs and as the foreign market turmoil slowly unfolds, we may see some moderate price rotation. Yet we believe the global economic dynamics that are currently in place create a very opportunistic, rich, green opportunity for continued capital infusion into the US equity markets and a continued moderate advance of the US Dollar.
Remember, there is now over $12 trillion in capital that has been created and introduced into the global markets over the past 10+ years. All of this capital is searching for projects and investments to develop suitable ROI and gains. Where do you think this capital is going to go for the most stable, most capable and most successful ROI available on the planet? Think about that for a minute – where else would you consider putting capital to invest for safe and consistent returns right now?
This weekend could prompt a massive upside price breakout early next week on continued positive economic news or lack of any foreign market concerns. The bias of the US equity market is, and has been, bullish – just as we have been telling our members. If you have been fooled by this recent price rotation or other research posts, please consider Technical Traders Ltd. services to learn how we can help you profit from these moves.
We know you value our research and hard work trying to keep you ahead of these market turns and swings. Please consider joining our other loyal members where you’ll receive exclusive updates, video content, trading signals and access to our proprietary price modeling systems and proprietary research reports. Our proprietary research is already showing us where this market should be trading well into July 2019. If you value our research, analysis and detailed reporting like this article, then please visit The Technical Traders to learn how you can join our other members and begin receiving our exclusive research and more.
See you in the markets!
Chris Vermeulen
As we stated in our earlier article regarding the Italy political crisis [read it here], the one important aspect to trading and investing is to not lose focus on the true perspective and true market fundamentals. Yes, if you are an intraday trader, these wild price swings can either be great profits or wild losses as you try to swing with these rotational moves. As a swing traders/investor, though, we care about the overall stability and direction of the markets. We are willing to ride out some rotation as long as our core analysis is sound and the technical and fundamental basis of our trades is still in place.
In our opinion, there are three things that are core elements of our analysis at the moment and these three things are likely driving the economic future of the US equity markets.
The US Dollar continues to strengthen as the US economy shows solid signs of a broad based economic increase. Oil/Energy prices have continued to decline recently, now down nearly 10% from the recent peak, and this decrease relates to supply and demand expectations throughout the end of this year (roughly 4 - 6 months into the future). The Transportation Index is pushing higher as stronger economic activity is expected throughout the rest of 2018 and into 2019.
These Three Key Elements Cross-Populate as Follows
1. The strong US dollar is acting like a magnet for foreign capital investment as the strength of the US dollar in combination with the strength of the US economy/equities markets creates a triple-whammy for foreign capital investments. Not only are foreign investors trying to avoid capital devaluation (currency price devaluation) and debt risks in their own local markets, they are trying to find ways to achieve ROI and stability for their capital investments. With almost nowhere else to go, the US equities markets and debt markets are pretty much the only place on the planet for this triple-whammy opportunity.
2. The strong US jobs numbers and robust economic activity, in combination with the past capital market stimulus and lowered interest rates, are creating a fuel heavy economic environment in the US not that President Trump’s deregulation and policies have injected the Oxygen needed to create the “economic combustion” that is driving this current growth. Energy prices are moderate and dropping as a result of the shift in technologies attributed to electric and hybrid transportation enterprises. All of this, jobs growth, earning growth, economic growth, moderately low interest rates and a true combusting economy, provides for much greater opportunities for an advancing US equities market.
3. The US equities markets are rotating higher throughout the global weakness and debt concerns while the Transportation index pushes higher as a sign that US investors expect the US economy to continue to grow. Transportations lead the us equities markets by about 4 to 6 months (on average). Lower oil prices, strong jobs numbers, dynamic opportunities in the US economy and a stronger US dollar drive continued US and foreign investments into the US equities markets and debt markets.
As we have stated in earlier research posts regarding “capital migration”, capital (cash) is always seeking the best environments for stability, growth and opportunity in a continual effort to balance risk vs. reward. Capital is capable of moving across the planet relatively quickly in most cases and is always seeking the best opportunity for ROI and stability while trying to balance unknown risks and devaluation. Right now, the only games in town are the established economies, the US, Canadian and UK markets.
As you can see in the graph below US investments continue to grow as the best risk/reward for capital.
Our opinion is that until something dramatic changes this current global economic environment and risk unknown, capital will continue to rush into the US markets even if the US dollar continues to climb or oil continues to fall. The only thing that can change this equation is the one key factor in understanding risk vs. reward – when does the opportunity for reward outweigh the risk of complete failure by applying capital into any other foreign or non-established market environment? When investors believe the reward of moving capital out of the US equity markets in search of new opportunities or advantageous risk/reward setups in foreign markets exists, that is when we’ll see a change in investment dynamics resulting in more downside pricing pressure in the US markets – and we don’t believe that will happen within the immediate 4~6+ month span.
Pay attention to our most recent research as we have been dead-on in terms of calling these market swings. The NQ chart, below, shows how the tech heavy NASDAQ is leading the breakout while the YM and ES markets lag a bit. We believe all of these US majors are in the process of breaking to new all time price highs and as the foreign market turmoil slowly unfolds, we may see some moderate price rotation. Yet we believe the global economic dynamics that are currently in place create a very opportunistic, rich, green opportunity for continued capital infusion into the US equity markets and a continued moderate advance of the US Dollar.
Remember, there is now over $12 trillion in capital that has been created and introduced into the global markets over the past 10+ years. All of this capital is searching for projects and investments to develop suitable ROI and gains. Where do you think this capital is going to go for the most stable, most capable and most successful ROI available on the planet? Think about that for a minute – where else would you consider putting capital to invest for safe and consistent returns right now?
This weekend could prompt a massive upside price breakout early next week on continued positive economic news or lack of any foreign market concerns. The bias of the US equity market is, and has been, bullish – just as we have been telling our members. If you have been fooled by this recent price rotation or other research posts, please consider Technical Traders Ltd. services to learn how we can help you profit from these moves.
We know you value our research and hard work trying to keep you ahead of these market turns and swings. Please consider joining our other loyal members where you’ll receive exclusive updates, video content, trading signals and access to our proprietary price modeling systems and proprietary research reports. Our proprietary research is already showing us where this market should be trading well into July 2019. If you value our research, analysis and detailed reporting like this article, then please visit The Technical Traders to learn how you can join our other members and begin receiving our exclusive research and more.
See you in the markets!
Chris Vermeulen
Labels:
capital,
Chris Vermeulen,
Gas,
investors,
IYT,
NASDAQ,
Oil,
SPY,
stocks,
The Technical Traders,
transportation
Friday, December 1, 2017
Capital Repositioning Driving Volatility Higher
Recent moves in the FANG stocks shows that capital is starting to reposition within the global market. As the end of the year approaches, expect more of this type of capital control to drive greater volatility within the markets. At this time of year, especially after such a fantastic bullish run, it is not uncommon to see capital move out of high flying equities and into cash or other investments.
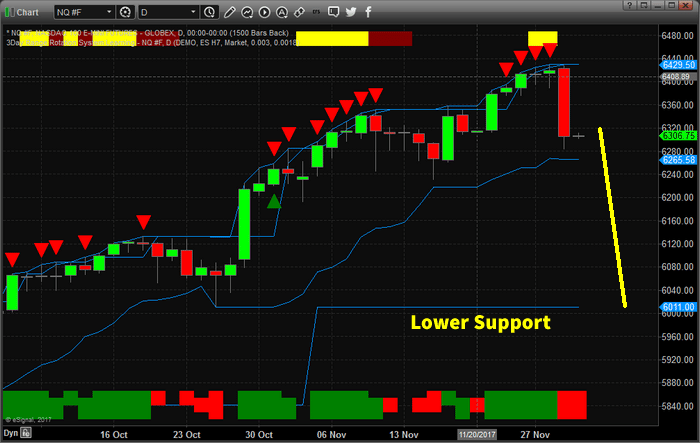
The recent move lower in the NQ has taken many by surprise, but the bullish run in the FANG stocks has been tremendous. Facebook was higher +59% for 2017 (600% 2016 levels). Amazon was up +61% for 2017 (550% 2016 levels). Netflix was up +64.75% for 2017 (600% 2016 levels) and Google was higher by +37% for 2017 (1000% 2016 levels). These are huge increases in capital valuation.
In early 2017, we authored an article about how capital works and always seeks out the best returns in any environment. It was obvious from the moves this year that capital rushed into the US markets with the President Trump’s win and is now concerned that the end of the year may be cause to pull away from the current environment.
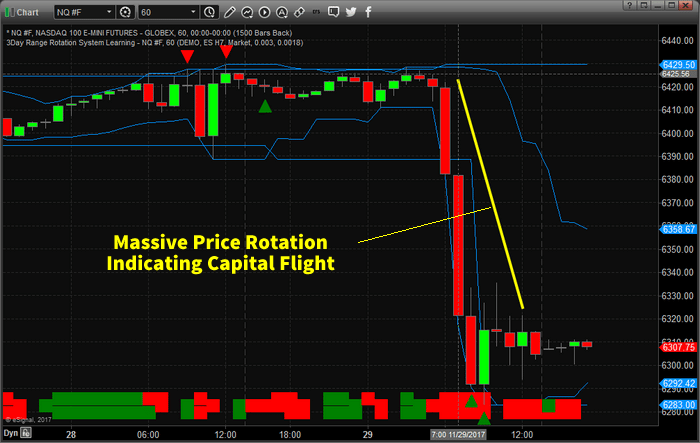
The current decline in the NQ, -2.25% so far, is not a huge decline in price yet. Lower price support is found near the $6000 level. Should this “Price Flight” continue in the NASDAQ, we could be looking at a 6~8% decline, or greater, going into the end of this year.

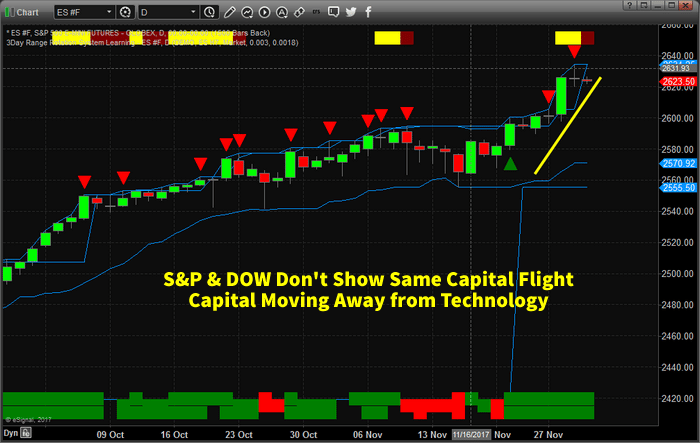
The price swing, this week, was very fast and aggressive. In terms of capital, this was a massive price rotation away from Technology. While the S&P and DOW Industrials continue higher, this presents a cause for concern with regards to the end of year expectations.

Will capital continue to rush into the US markets and specifically Technology stocks? Or will capital rush out of these equities and into other sources of “safety” as technology melts down into the end of 2017? Has the 40~60%+ price rally of 2017 been enough for investors to take their profits and run?

It is quite possible that capital will move to the sidelines through the end of this year and reenter the markets early next year as investors find a better footing for the markets. The facts are, currently, that financials and transportation seem to be doing much better than the FANG stocks. If this continues, we could be looking at a broader shift in the global markets – almost like a second technology bubble burst.
If you want to learn more about how we can assist you with your investment needs, visit The Technical Traders Here to learn more. Our researchers are dedicated to assisting you and in helping you learn to profit from these moves. 2018 is certain to be a dynamic trading year – so don’t miss out.
Labels:
Amazon,
Bullish,
capital,
equities,
Gas,
investment,
NASDAQ,
Oil,
President Trump,
profit,
Technology,
trading
Saturday, August 13, 2016
Why Corporate America Can’t Prop Up Stocks Much Longer
By Justin Spittler
Corporate America is bracing for tough times. Since you’re reading an investment newsletter, you likely own stocks. And if you’re like most investors, you keep up with how the companies you own are performing. You might even listen to quarterly “earnings calls,” which are when CEOs present results and give their outlook on the business.Most of the time, CEOs act as cheerleaders on these calls. If business is bad, they’ll say business is good. If business is good, they’ll say it’s great. And CEOs are notoriously optimistic about the economy. After all, thousands of investors and analysts listen to these calls. CEOs know their stock can crash if they’re pessimistic about the business or economy. Because many CEOs will say anything to make their stock go up, we don’t put much stock in their words. We pay much more attention to their actions. And right now, large U.S. companies are acting like very tough economic times are ahead.
Business investment fell 2.2% last quarter..…
This metric measures how much companies spend on property, plant, and equipment. It was the third straight quarter that business investment fell. That hasn’t happened since the 2008-2009 financial crisis. We wouldn’t see this if the economy was headed in the right direction. Companies would be building more factories. They’d be buying more machinery. They’d be spending more money on research and development.
Instead, companies have cut back on investments. This tell us they don’t see many good opportunities. That’s a bad sign for the economy, yet stocks keep rallying. The S&P 500, Dow, and NASDAQ have all recently hit new record highs. At this point, you’re probably wondering what’s keeping stocks afloat if it’s not the economy.
Companies have spent about $2.5 trillion on “share buybacks” since the financial crisis..…
A buyback is when a company buys its own stock from shareholders. This can lift a company's stock price.
According to investment bank Goldman Sachs (GS), buybacks have been the biggest driver of U.S. stock performance since the financial crisis. Buybacks also reduce the number of shares that trade on the market.
This boosts a company’s earnings per share. But buybacks don’t make a company more profitable. They only make profits look bigger “on paper.” Companies have been buying up their own stock for two reasons: 1) They don’t see many growth opportunities. And 2) it’s incredibly cheap to borrow money.
The Federal Reserve has held its key interest rate near zero since 2008..…
The Fed cut rates to encourage households and businesses to borrow and spend more money. Mainstream economists thought this would “stimulate” the economy. It didn’t work. The U.S. economy has grown at an annualized rate of just 2.1% since 2009. This makes the current “recovery” the slowest by far since World War II.
The Fed did get folks to borrow huge sums of money. U.S. corporations have borrowed more than $10 billion in the bond market since 2007. Last year, they issued a record $1.5 trillion in bonds.
Buybacks are a big reason companies borrowed so much. MarketWatch reported last week:
Companies have been taking on piles of debt to finance buybacks, leading the total debt on the S&P 500 to grow 56% during the past five years.According to Yahoo! Finance, companies in the S&P 500 funded 22% of last year’s buybacks with debt. This year, debt paid for 39% of share buybacks.
Corporate debt is now dangerously high..…
According to Barron’s, corporate debt now equals 45.3% of gross domestic product (GDP). The only time this key ratio has ever been higher was in 2009, when it hit 45.4%. If the economy was doing well, this wouldn’t be such a big problem. Companies would be making enough money to pay their debts.
But right now, Corporate America is struggling to make money. Profits for companies in the S&P 500 are on track to fall for the fifth straight quarter. That hasn’t happened since the 2008-2009 financial crisis.
There’s no telling when this earnings drought will end either. According to research firm FactSet, analysts expect third quarter corporate profits to fall 1.7%. The third quarter ends on September 30.
Keep in mind, the U.S. economy is technically in a “recovery” right now. Imagine what will happen to corporate profits during the next recession. The more profits fall, the less money companies will have to prop up their shares with buybacks.
Companies have already started to cut back on buybacks..…
According to Business Insider, buybacks fell 18% last quarter. This sharp decline in buyback activity followed a near record breaking first quarter, in which companies in the S&P 500 spent an incredible $166 billion on buybacks. That’s the second most ever, and the most in one quarter since 2007. We don’t know exactly why companies are suddenly spending less on buybacks.
Maybe it’s because corporate profits are drying up. Maybe companies are starting to realize they have too much debt. Or maybe it’s because stocks are expensive. According to the popular CAPE ratio, stocks in the S&P 500 are 62% more expensive than their historic average. Since 1881, U.S. stocks have only been more expensive three times: before the Great Depression, during the dot-com bubble, and leading up to the 2008-2009 financial crisis.
Like any investment, buybacks only make sense when stocks are a good deal. With stocks as expensive as they are today, buybacks are a terrible use of money.
Without buybacks, there won’t be much to keep U.S. stocks from falling..…
If you own stocks, take a good look at your portfolio. We recommend that you get out of any company that needs buybacks to retain shareholders. We also encourage you to put 10% to 15% of your wealth in gold. As we often say, gold is real money. It’s preserved wealth for centuries because gold is unlike any other asset. It’s durable, easy to transport, and easily divisible.
Gold is also the ultimate safe haven asset. It’s survived economic depressions, stock market crashes, and full blown currency crises. When investors are nervous about stocks or the economy, they buy gold.
The price of gold has jumped 27% this year. It’s beat the S&P 500 4-to-1.
If you don’t already own gold for protection, we encourage you to do so immediately..…
According to Casey Research founder Doug Casey, the financial system is held together by “chewing gum and bailing wire” right now. When the public wakes up and realizes this, “they’ll flock to gold… just as they’ve done for centuries.” Doug thinks this could cause the price of gold to easily soar 200% in the coming years.
You could make 2x, 5x, or 10x that much money in gold stocks..…
Yesterday, we showed you how leverage works in the resource market. As we explained, this powerful force is why gold stocks can soar even if the price of gold doesn’t rise by that much. This year, gold’s 27% jump caused the VanEck Vectors Gold Miners ETF (GDX), which tracks large gold miners, to soar 128%.
Some folks might see that and think they missed their chance to buy gold stocks. But regular readers know gold stocks can go many times higher. During the 2000-2003 bull market, the average gold stock rose 602%. The best ones returned more than 1,000%. We expect even bigger gains in the coming years. To learn why, watch this short presentation. In it, Doug explains why we’re headed for “the biggest gold mania” he’s even seen.
By the end of this video, you’ll know why there’s never been a better time to own gold stocks. You’ll also learn how to make the most of this new gold bull market. We’re talking gains of 1,000%...2,000%...even 5,000%. Those kind of returns might sound impossible. But as you’ll see, Doug's hit many “home runs” like this throughout his career. And for the first time ever, he's showing the world exactly how he did this.
To learn Doug’s SECRET to making giant gains in gold stocks, watch this free video.
How Will Negative Interest Rates, the War on Cash, and “Helicopter Money” Affect the Markets?
Today, we have something special to share with you. Instead of the usual “Chart of the Day,” you’ll find a six-minute video presentation put together by our colleagues at Palm Beach Research Group.In the video below, Palm Beach Research Group co-founder Tom Dyson and Palm Beach Letter editor Teeka Tiwari discuss how radical government policies are affecting global financial markets. As Tom and Teeka explain, these central bank “experiments” will have severe side effects. They could even push the price of gold to $5,000. To learn why, watch the video below.
If you like what you saw from Tom and Teeka, we encourage you to sign up for their “speed round” training series. Click here to get started.
The article Why Corporate America Can’t Prop Up Stocks Much Longer was originally published at caseyresearch.com.
Get out latest FREE eBooK "Understanding Options"....Just Click Here
Thursday, March 3, 2016
The Secret Behind the $1 Million Option Setup....Here’s Your Private Replay (expires soon)
If you missed John Carter’s special training Tuesday night then you are in luck. The limited replay is online now.
Watch the Private Replay Here [Expires soon]
Get ready to take notes! Unfortunately, I have no idea how long this replay will be up, so watch it while you can. But I can tell you the feedback from those who attended live is beyond awesome. This was not just another ‘webinar’ featuring ‘hypothetical results’.
John detailed, step by step, how to be consistently profitable in these volatile conditions using just a handful of very simple options setups. There was ZERO hype and total transparency. He showed actual trading accounts with winning AND losing trades for all to see. You gotta see this for yourself.
Here’s just some of what John revealed....
Like I said, you don’t want to miss this training. John’s refined these simple strategies over more than 25 years. He shows you what’s really working now and the account killing mistakes that you want to avoid like the plague.
Watch the Limited Replay Now
See you in the markets!
The Stock Market Club
Get John's latest FREE eBook "Understanding Options"....Just Click Here!
Watch the Private Replay Here [Expires soon]
Get ready to take notes! Unfortunately, I have no idea how long this replay will be up, so watch it while you can. But I can tell you the feedback from those who attended live is beyond awesome. This was not just another ‘webinar’ featuring ‘hypothetical results’.
John detailed, step by step, how to be consistently profitable in these volatile conditions using just a handful of very simple options setups. There was ZERO hype and total transparency. He showed actual trading accounts with winning AND losing trades for all to see. You gotta see this for yourself.
Here’s just some of what John revealed....
- Why extreme volatility is the new normal. If you don’t want to crash and burn, you MUST adapt
- The setup John used to turn $3k into $119k in just 3 weeks (and how to spot these rare, explosive moves)
- The simple signal that allowed John to make $1 million in a single day on TSLA options
- How to pinpoint major reversals in advance by legally ‘spying’ on Wall Street Insiders
- The publically available intel that allowed John to catch the Nasdaq’s historic January collapse, AND then get long for the February rally
- The braindead simple option system that turns crazy market volatility into potentially giant gains (sometimes literally overnight , with strictly limited risk)
- How it’s possible to consistently pull in $100 to $1000 a day by trading from your smart phone (even if you have a job)
Like I said, you don’t want to miss this training. John’s refined these simple strategies over more than 25 years. He shows you what’s really working now and the account killing mistakes that you want to avoid like the plague.
Watch the Limited Replay Now
See you in the markets!
The Stock Market Club
Get John's latest FREE eBook "Understanding Options"....Just Click Here!
Labels:
John Carter,
market,
NASDAQ,
options,
replay,
system,
trading,
TSLA,
Volatility,
Wall Street,
webinar
Will Your Favorite Oil Company Go Bankrupt?
By Justin Spittler
Oil companies are getting desperate. If you’ve been reading the Dispatch, you know oil is in a horrible bear market. The price of oil has crashed 69% since June 2014. Last month, oil hit its lowest price since 2003.The world has too much oil..…
For years, many folks thought the world was running out of oil. The price of oil soared more than 1,200% from 1998 to 2008. The “Peak Oil” crowd saw this as proof that oil production was in terminal decline. They were very wrong. “Peak Oil” believers failed to understand that high prices would create huge incentives to develop new ways to produce oil. Oil companies developed new methods like “fracking” to unlock billions of barrels of oil that were once impossible to reach. U.S. oil production has nearly doubled over the last decade. Last year, it hit its highest level since the 1970s. World oil production levels are also near record highs.
The world isn’t consuming oil fast enough..…
The global economy produces about 1.7 million more barrels a day than it needs. With U.S. oil reserves at their highest level since the Great Depression, companies are running out of places to store the extra oil. To deal with the surplus, companies have started storing oil on tankers floating at sea and in empty railcars. Other companies are selling barrels at huge discounts just to get rid of them.
Low oil prices have hammered major oil companies..…
The world’s five biggest oil companies—Exxon (XOM), Chevron (CVX), Total S.A. (TOT), BP (BP), and Royal Dutch Shell (RDS.A)—have fallen an average 34% since June 2014. Oil services companies, which supply “picks and shovels” to the oil industry, have crashed, too. Schlumberger (SLB), the world’s largest oil services company, has plunged 36% since 2014. Halliburton (HAL), the world’s second biggest, has plunged 53%.
Oil companies have cut spending to the bone..…
Companies have walked away from billion dollar projects. They’ve sold pieces of their businesses. As Dispatch readers know, some have even cut their prized dividends. The industry has laid off more than 250,000 workers since oil prices peaked. Last year, oil and gas companies cut spending by 22%. Reuters reports that the industry could cut spending another 12% this year.
On Thursday, Halliburton laid off 5,000 workers..…
It’s now laid off 29,000 workers, more than a quarter of its workforce, since 2014. Like most companies in the oil business, Halliburton is struggling. Its sales have fallen four straight quarters. Last year, the company lost $671 million, its first annual loss since 2004. The latest round of layoffs suggests Halliburton doesn’t expect business to pick up anytime soon.
The oil market is cyclical..…
It goes through big booms and busts. Right now, it’s going through its worst bust in decades. Eventually, the oil market will boom again. After all, the world needs oil. Companies that survive this bust should deliver huge gains during the next boom. If you can buy great oil companies near the bottom, you could set yourself up for huge gains when the next boom comes. So…is this the bottom?
According to The Wall Street Journal, one third of U.S. oil producers could go bankrupt this year. To be profitable, many companies would need the price of oil to get back up $50. With oil at $32.84 a barrel on Friday, those companies are in trouble. We expect a wave of bankruptcies to rip across the oil industry. This would likely trigger another leg down in oil stocks. So we’re not ready to buy oil stocks yet.
Instead, we recommend “stalking” your favorite oil companies..…
Nick Giambruno, editor of Crisis Investing, just added a world-class oil company to his watch list.
If you don’t know Nick, his specialty is buying beaten-down assets during a crisis. Most investors run away from crisis. But if you can keep your head and buy when everyone else is panicking, you can often pick up a dollar’s worth of assets for a dime or less.
Shale oil stocks are in crisis today. Even the largest shale companies have been obliterated. Major shale oil producer Apache (APA) has plunged 51% since June 2014. Anadarko (APC), another larger shale company, has plummeted 65%. Shale oil is more expensive to extract than conventional oil. And at today’s prices, most shale oil projects can’t make money.
Many shale companies borrowed too much money during oil’s boom times. Now that oil is in a bust, they can’t generate the cash flow to pay back their debts. Last month, investment bank Oppenheimer & Co. Inc. warned that half of all U.S. shale oil producers could go bankrupt before oil prices recover. To survive, these companies would need the price of oil to more than double.

Nick has found a shale company unaffected by these problems. It’s a world-class shale oil company that has virtually no risk of going bankrupt. However, its stock has gotten extremely cheap along with all other shale oil stocks. Nick says this company has “trophy assets in the major U.S. shale basins. It has a solid balance sheet.
And, unlike many of its peers, it didn’t over leverage itself during the last boom.” The company also has the industry’s highest profit margins. Nick plans to buy this company at once in a generation prices. He will tell Crisis Investing readers when it’s time to pull the trigger.
In the meantime, Nick is investing in Cuba..…
As you may know, the U.S. has had a trade embargo against Cuba since 1962. The embargo bans all trade, making it illegal for Americans to invest in Cuba. But that could soon change. About a year ago, Cuba and the U.S. announced they were working to repair diplomatic and economic relations. In August, the two countries reopened their embassies in each other’s capitals. President Obama is going to Cuba next month. He will be the first sitting president to visit Cuba since Calvin Coolidge in 1928.
Nick thinks the embargo could soon “become a page in the history books”..…
The end of the embargo will create the “potential for enormous profits,” as Nick explained in Crisis Investing.
When the embargo goes away, American tourism to Cuba will explode. The International Monetary Fund estimates there could be up to 10 million visits from Americans every year as soon as the embargo comes down.
Today, it’s still illegal to invest in Cuba. But Nick has a “back door” way to profit from the opening up of Cuba’s economy. Nick’s investment in Cuba legally trades on the NASDAQ stock exchange. It should deliver huge gains when the embargo is lifted…which may happen very soon. You can get in on Nick’s Cuba investment by signing up for Crisis Investing. You’ll also learn about the world class shale oil company on Nick’s watch list. Click here to begin your risk-free trial.Chart of the Day
Shale oil stocks have been decimated. Today’s chart shows the performance of the Market Vectors Unconventional Oil & Gas ETF (FRAK). This fund tracks 50 companies involved in the shale oil and gas industries. FRAK has crashed 65% since June 2014. Last month, it hit an all-time low. As we mentioned, most shale oil companies simply can’t make money right now.The article Will Your Favorite Oil Company Go Bankrupt? was originally published at caseyresearch.com.
Get our latest FREE eBook "Understanding Options"....Just Click Here!
Labels:
barrels,
booms,
BP,
Casey Research,
Cuba,
CVX,
depression,
dividends,
Halliburton,
investing,
NASDAQ,
Oil,
production,
TOT,
XOM
Tuesday, March 1, 2016
How to Spot Big Market Reversals in Advance and Beat Wall Street Silly
Thinking about living a ‘dream lifestyle’ is tough for a lot of traders right now, because they’re getting their faces ripped off. And there’s no doubt, these conditions are some of the craziest that we’ve ever seen. Stocks were down 9% in January, that’s the worst market performance in history.
Predictably, some expected the world to end and loaded up on the short side. Of course, then the market reversed in February and is already up 1.4%. Take a look at the Nasdaq roller coaster that traders just rode for nasty losses or pretty awesome gains.
It’s clear that the bulls got destroyed in January, and then bears gave back all of their profits and then some in February. In other words, both sides got creamed. Classic Wall Street shenanigans, right? In case you were wondering, the markets are designed to deliver maximum pain to the most traders possible. How would you like to turn the tables and finally beat those guys at their own game?
Well, on Tuesday, March 1st at 7pm Central, John Carter is going to show you why his account is up 48% already this year.
For starters, he’ll show you the signal that told him to get short the NQ on the way down, and then buy for the ride back up. As you can imagine, spotting those kinds of reversals in advance would give you an almost unfair advantage. Well, it’s easier than you think and you don’t have to be a psychic. What John is doing isn’t magic. He is just trading simple setups that have passed the test of time.
If you’re getting your clock cleaned by this volatility, we can all relate. It took John years to figure this stuff out. If you join him this Tuesday, March 1st at 7 pm Central, he’ll show you how to use a simple indicator to spot major reversals and piggyback your trades on what the biggest Wall Street institutions are doing. He’ll cover that and a whole lot more.
And let’s take advantage of this "once in a decade" volatility. The next twelve months could offer the best opportunity to rapidly grow your accounts since the 2008 crash. Don’t buy into the myth that volatility automatically means high risk. John will show you how to strictly manage risk and still position your account for major gains.
Put this special webinar on your calendar....Sign Up Right Here!
See you Tuesday.
The Stock Market Club
P.S. John gave us a video primer earlier in the week......Watch That Here
Get John's latest FREE eBook "Understanding Options"....Just Click Here!
Predictably, some expected the world to end and loaded up on the short side. Of course, then the market reversed in February and is already up 1.4%. Take a look at the Nasdaq roller coaster that traders just rode for nasty losses or pretty awesome gains.
It’s clear that the bulls got destroyed in January, and then bears gave back all of their profits and then some in February. In other words, both sides got creamed. Classic Wall Street shenanigans, right? In case you were wondering, the markets are designed to deliver maximum pain to the most traders possible. How would you like to turn the tables and finally beat those guys at their own game?
Well, on Tuesday, March 1st at 7pm Central, John Carter is going to show you why his account is up 48% already this year.
For starters, he’ll show you the signal that told him to get short the NQ on the way down, and then buy for the ride back up. As you can imagine, spotting those kinds of reversals in advance would give you an almost unfair advantage. Well, it’s easier than you think and you don’t have to be a psychic. What John is doing isn’t magic. He is just trading simple setups that have passed the test of time.
If you’re getting your clock cleaned by this volatility, we can all relate. It took John years to figure this stuff out. If you join him this Tuesday, March 1st at 7 pm Central, he’ll show you how to use a simple indicator to spot major reversals and piggyback your trades on what the biggest Wall Street institutions are doing. He’ll cover that and a whole lot more.
And let’s take advantage of this "once in a decade" volatility. The next twelve months could offer the best opportunity to rapidly grow your accounts since the 2008 crash. Don’t buy into the myth that volatility automatically means high risk. John will show you how to strictly manage risk and still position your account for major gains.
Put this special webinar on your calendar....Sign Up Right Here!
See you Tuesday.
The Stock Market Club
P.S. John gave us a video primer earlier in the week......Watch That Here
Get John's latest FREE eBook "Understanding Options"....Just Click Here!
Labels:
gains,
John Carter,
Markets,
NASDAQ,
options,
QQQ,
Simpler Options,
stocks,
traders,
webinar
Thursday, August 6, 2015
The Wall Street Titanic and You
By Tony Sagami
“I would highlight that equity market valuations at this point generally are quite high.”
—Janet Yellen
Greece… China… don’t worry about it!
At least that seems to be Wall Street’s reaction to what could have been a catastrophic fall of dominoes if the European and Chinese governments hadn’t come to the rescue with another massive monetary intervention.
If you think you’ve heard the last about Greece or a Chinese stock market meltdown, you’re in the majority. Investors are pretty darn confident about the stock market.
The John Hancock Investor Sentiment Index hit +29 in the second quarter, the highest reading since the inception of the index in January of 2011.
However, overconfidence is dangerous and often accompanies market tops.
If you listen to the hear no evil cheerleaders on Wall Street and CNBC, you might be inclined to think the bull market will last a couple more decades, but we haven’t had a major correction since 2011, and the Nasdaq hit an all time high last week.
Investors are so enthusiastic that the exuberance is spilling beyond stock certificates to the high brow world of collectible art.
Investment gamblers are shopping up art in record droves. In the last major art auction, prices for collectible art reached all time highs, and somebody with more money than brains paid $32.8 million for an Andy Warhol painting of a $1 bill.
Who says a dollar doesn’t buy what it used to?
I’m not saying that a new bear market will start tomorrow morning, but I’m suggesting that bear markets hurt more and last longer than most investors realize.
The reality is that bear markets historically occur about every four and a half to five years, which means we are overdue. And the average loss during a bear market is a whopping 38%. Ouch!
On average, a bear market lasts about two and a half years… but averages can be misleading.
In the 1973-74 bear market, investors had to wait seven and a half years to get back to even. In the 2000-02 bear market, investors didn’t break even until 2007.
Unless you, too, have drunk the Wall Street Kool Aid, you should have some type of emergency back up plan for the next bear market. There are three basic options:
Option #1: Do nothing, get clobbered, and wait between two and a half and 10 years to get your money back. Most people think they can ride out bear markets, but the reality is that most investors—professional and individual alike—panic and sell when the pain gets too severe.
Option #2: Have some sort of defensive selling strategy in place to avoid the big downturns. That could be some type of simple moving average selling discipline or a more complex technical analysis. At minimum, I highly recommend the use of stop losses.
Option #3: Buy some portfolio insurance with put options or inverse ETFs. That’s exactly what my Rational Bear subscribers are doing, and I expect those bear market bets to pay off in a big, big way.
Whether it is next week, next month, or next year—a bear market for US stocks is coming, and I hope you’ll have a strategy in place to protect yourself.
If you'd like to hear what worries me most about the stock market, here is a link to an interview I did last week with old friend and market watchdog Gary Halbert.

Tony Sagami
30 year market expert Tony Sagami leads the Yield Shark and Rational Bear advisories at Mauldin Economics. To learn more about Yield Shark and how it helps you maximize dividend income, click here.
To learn more about Rational Bear and how you can use it to benefit from falling stocks and sectors, click here.
The article Connecting the Dots: The Wall Street Titanic and You was originally published at mauldineconomics.com.
Get our latest FREE eBook "Understanding Options"....Just Click Here!
Labels:
Bears,
china,
CNBC,
dividend,
Dollar,
Greece,
investment,
Janet Yellen,
Markets,
NASDAQ,
options,
stocks,
Tony Sagami,
Wall Street
Sunday, June 14, 2015
Time to Move Capital into Next Bull Market – Part I
Our trading partner Chris Vermeulen just shared with us his take on what most traders are missing when it comes to market rotation. It's a great reminder of what so many of us did so wrong not to long ago. Let's play this different this time.
If you remember the dot com bubble as clearly as I do and are a technical analyst then you will recall the month which the NASDAQ broke down and confirmed a new bear market has started. The date was November of 2000.
You may be wondering why I bring this up. What do tech stocks have to do with commodities?
Good question because they have nothing in common. But the key here is that when a bull market ends in one asset class that money is shifted into another. That money moved into commodities and resource stocks and in a big way. Precious metals and miners exploded, surging an average of 1000% return (10 times ROI) over the next six years, topping out in 2008. In fact, these resource stocks bottom the exact month which the NASDAQ confirmed it was in a bear market on Nov 2000.
Compare Dot-Com Bubble & Burst to Precious Metals Stocks
Over the next couple of weeks, I will be sharing some of my top stock picks in the metals sector (gold, silver, nickel, and copper). If you missed the 2001 and 2008 metals bull market then you best pay attention and be sure you don’t miss what is about to happen.
Read Chris' entire post and chart work here > Time to Move Capital into Next Bull Market – Part I
Get our latest FREE eBook "Understanding Options"....Just Click Here!
If you remember the dot com bubble as clearly as I do and are a technical analyst then you will recall the month which the NASDAQ broke down and confirmed a new bear market has started. The date was November of 2000.
You may be wondering why I bring this up. What do tech stocks have to do with commodities?
Good question because they have nothing in common. But the key here is that when a bull market ends in one asset class that money is shifted into another. That money moved into commodities and resource stocks and in a big way. Precious metals and miners exploded, surging an average of 1000% return (10 times ROI) over the next six years, topping out in 2008. In fact, these resource stocks bottom the exact month which the NASDAQ confirmed it was in a bear market on Nov 2000.
Compare Dot-Com Bubble & Burst to Precious Metals Stocks
Over the next couple of weeks, I will be sharing some of my top stock picks in the metals sector (gold, silver, nickel, and copper). If you missed the 2001 and 2008 metals bull market then you best pay attention and be sure you don’t miss what is about to happen.
Read Chris' entire post and chart work here > Time to Move Capital into Next Bull Market – Part I
Get our latest FREE eBook "Understanding Options"....Just Click Here!
Labels:
analyst,
bear,
Chris Vermeulen,
commodities,
copper,
Gold,
metals,
miners,
NASDAQ,
options,
ROI,
Silver,
tech stocks
Tuesday, January 13, 2015
Last Week's Volatility Could Be A Harbinger Of Things To Come
There's a war going on right now and I don't mean overseas, I mean right here in the markets. Last week was a perfect example as the intraday swings of the S&P500 clocked in at a staggering 6.5%. Market volatility often is a precursor of things to come, and the irony of all this action was that the market closed with a loss of -0.65% for the week.
The net weekly change for the DOW was -0.53% and there was an even smaller loss of -0.42% for the NASDAQ. All three indices formed an important Japanese candlestick pattern, a weekly doji candle. Why is this important? A doji candlestick often signals indecision in the market. When the doji forms in an uptrend or downtrend, this is normally seen as significant, as it is a signal that the buyers are losing conviction when formed in an uptrend and a signal that sellers are losing conviction if seen in a downtrend.
What To Watch For This Week
A lower weekly close would indicate to me that the buyers are beginning lose control of this aging bull market. Here is the "line in the sand" for each of the indices that I am watching. Once below this line, watch for heavy liquidation to come in across the board.
DOW: 17.262 S&P500: 1,992 NASDAQ: 4.090
Gold Is Now Officially On The Move
You might remember on January 7th, I wrote a post on gold (FOREX:XAUUSDO) and the key neckline level. The key neckline in gold was broken to the upside last Friday when gold closed out the week with a very positive 2.9% gain. I now have a confirmed upside target zone of $1,340, which equates to about $132-$134 on the ETF, GLD. To follow all of the entry and exit points for gold, check in daily with the World Cup Portfolio.
How High Can The Dollar Go?
The U.S. Dollar Index (NYBOT:DX) continues to push higher against most currencies with another weekly gain of 0.85% in the Dollar Index. The question on everyone's mind is, how high can the dollar go without a correction? To this observer, it appears that there are technical storm clouds gathering that could spell trouble for the dollar. Take a look at the RSI indicator and check out the negative divergence that is building on the weekly charts. If you are long the dollar, you might want to review and tighten your stops.
How Low Can Crude Oil Go
That's a question better asked to Saudi Arabia as they continues to keep their oil spigots open to the world. Here is my analysis, the trend is down and picking bottoms or tops in markets is not a high percentage game. Before crude oil (NYMEX:CL.H15.E) changes trend, it needs to begin to base out and find a floor. I will leave picking bottoms to others. Meanwhile, the trend is your friend.
Have a Different View?
I invite your comments, pro or con. As always, we appreciate your feedback.
Just Click Here to get all of my Blog Post in your inBox
Every success with MarketClub,
Adam Hewison
President, INO.comCo-Creator, MarketClub
Get our latest FREE eBook "Understanding Options"....Just Click Here!
The net weekly change for the DOW was -0.53% and there was an even smaller loss of -0.42% for the NASDAQ. All three indices formed an important Japanese candlestick pattern, a weekly doji candle. Why is this important? A doji candlestick often signals indecision in the market. When the doji forms in an uptrend or downtrend, this is normally seen as significant, as it is a signal that the buyers are losing conviction when formed in an uptrend and a signal that sellers are losing conviction if seen in a downtrend.
What To Watch For This Week
A lower weekly close would indicate to me that the buyers are beginning lose control of this aging bull market. Here is the "line in the sand" for each of the indices that I am watching. Once below this line, watch for heavy liquidation to come in across the board.
DOW: 17.262 S&P500: 1,992 NASDAQ: 4.090
Gold Is Now Officially On The Move
You might remember on January 7th, I wrote a post on gold (FOREX:XAUUSDO) and the key neckline level. The key neckline in gold was broken to the upside last Friday when gold closed out the week with a very positive 2.9% gain. I now have a confirmed upside target zone of $1,340, which equates to about $132-$134 on the ETF, GLD. To follow all of the entry and exit points for gold, check in daily with the World Cup Portfolio.
How High Can The Dollar Go?
The U.S. Dollar Index (NYBOT:DX) continues to push higher against most currencies with another weekly gain of 0.85% in the Dollar Index. The question on everyone's mind is, how high can the dollar go without a correction? To this observer, it appears that there are technical storm clouds gathering that could spell trouble for the dollar. Take a look at the RSI indicator and check out the negative divergence that is building on the weekly charts. If you are long the dollar, you might want to review and tighten your stops.
How Low Can Crude Oil Go
That's a question better asked to Saudi Arabia as they continues to keep their oil spigots open to the world. Here is my analysis, the trend is down and picking bottoms or tops in markets is not a high percentage game. Before crude oil (NYMEX:CL.H15.E) changes trend, it needs to begin to base out and find a floor. I will leave picking bottoms to others. Meanwhile, the trend is your friend.
Have a Different View?
I invite your comments, pro or con. As always, we appreciate your feedback.
Just Click Here to get all of my Blog Post in your inBox
Every success with MarketClub,
Adam Hewison
President, INO.comCo-Creator, MarketClub
Get our latest FREE eBook "Understanding Options"....Just Click Here!
Labels:
Adam Hewison,
analysis,
Candlestick,
doji,
Dollar,
Index,
NASDAQ,
Oil,
Saudi Arabia,
Trend,
Volatility
Subscribe to:
Posts (Atom)