Showing posts with label bearish. Show all posts

Wednesday, April 17, 2019

Watch the Financial Sector for the Next Topping Pattern

A very interesting price pattern is setting up in the financial sector that could lead to a very big move in the US & Global markets. Remember how in 2008-09, the Financial sector and Insurance sector were some of the biggest hit stock sectors to prompt a global market crisis? Well, the next few weeks and months for the financial sector are setting up to be critical for our future expectations of the US stock market and global economy.

Right now, many of the financial sector stocks are poised near an upper price channel that must be breached/broken before any further upside price advance can take place. The current trend has been bullish as prices have rallied off the December 2018 lows. Yet, we are acutely aware of the bigger price channels that could become critical to our future decision making. If there is any price weakness near these upper price channel levels and any downside price rotation, the downside potential for the price is massive and could lead to bigger concerns.

Let’s start off by taking a look at these Monthly charts

This first Monthly Bank Of America chart is best at showing the price channel (in YELLOW) as well as a key Fibonacci price level (highlighted by the MAGENTA line). We’ve also highlighted a price zone with a green shaded box that we believe is key support/resistance for the current price trend.

As you can see from this chart, since early February 2018, the overall trend has shifted into a sideways bearish trend. The price recovery from December 2018 was impressive, yes, but it is still rotating within this sideways/bearish price channel. Our belief is that this YELLOW upper price channel level MUST be broken in order for the price to continue higher at this point. Any failure to accomplish this will result in a price reversal that could precipitate a 30% price decline in the value of BAC. In other words, “it is do-or-die time – again”.


This Monthly JPM chart shows a similar pattern, yet the price channel is a bit more narrow visually. We have almost the same setup in JPM as we do in BAC. The same channels, the same type of Fibonacci price support level, the same type of sideways price support zone (the shaded box) and the same overall setup. As traders, we have to watch for these types of setup and be aware of the risks that could unfold with a collapse of the financial sector over the next few weeks.

We believe the next few weeks could be critical for the financial sector and for the overall markets. If weakness hits the financial sector as global growth continues to stagnate we could enter a period where the global perception of the future 12~24 months may change. Right now, perception has been relatively optimistic in the global stock markets. Most traders have been optimistic that the markets will recover and a US/China trade deal will get settled. The biggest concern has been the EU and the growth of the European countries.

What if that suddenly changed?


We are not saying it will or that we know anything special about this setup. We are just suggesting that the Monthly charts, above, are suggesting that price will either break above this upper price channel or fail to break this level and move lower. We are suggesting that, as skilled traders, we need to be acutely aware of the risks within the financial sector right now and prepare for either outcome.

This last chart, a Weekly FAS chart, shows a more detailed view of this same price rotation and sideways expanding wedge/channel formation. Pay very close attention to the shaded support channel shown with the GREEN BOX on this chart. Any price rotation within this level should be considered “within a support channel” and not a real risk initially. We want to see price break above the upper price channel fairly quickly, within the next 2 to 5+ weeks, and we can to see it establish a new high (above $78 on this chart) to confirm a new bullish price trend. Once this happens, we’ll be watching for further price rotation and setups. If it fails to happen, then the RED DOWN ARROW is the most likely outcome given the current price setup.


Any downside price move in the Financial sector would have to be associated with some decreased future expectations by investors. Thus, our bigger concern is that something is lurking just below the surface right now that could pull the floor out from under this sector. Is it a surprise Fed rate increase? Is it some news from the EU? Is it a sudden increase in credit defaults? What is the “other shoe” – so to say.

Be prepared. If all goes well, then we’ll know within a few more weeks if the upside price rally will continue or if we need to start digging for clues as to why the support for the financial sector is eroding. This really is a “do or die” setup in the financial sector and we urge all traders to pay very close attention to this sector going forward. We believe it will be the leading sector for any major price weakness across the global markets.

Do you want to find a team of dedicated researchers and traders that can help you find and execute better trades in 2019 and beyond? Please visit The Technical Traders to learn how we can help you prepare for the big moves in the global markets and find better opportunities for greater success in the future. Our team of researchers and traders continue to scan the markets for new trades and incredible research for all our members and followers.

Chris Vermeulen

Saturday, January 12, 2019

Simple Day Trades - Gap Windows and Price Spikes

IMPORTANT NOTE: Pre-market trades like these are posted in our morning update and video only. We don’t want to blanket all our longer term traders with day trades. So if you are an active trader be sure you read our morning update and watch the video with your morning coffee.

The morning gap has filled and our spike targets are being reached as well. Keep in mind, these are short term trade setup which will be implemented into our member’s area in the near future that auto update and post for those of you who want to take advantage of early day trades and be done by 11 am most trading sessions. Once we have things implemented there will be a detailed PDF on how trading these along with a video.


For you longer term traders we are also working on having our swing trade charts and signal post and update automatically in the member’s area as well. Each trading strategy, chart, and signals will run in a separate member’s area page and you will be able to follow and trade the strategies that fit your personality and trading style.

This is going to take us 30 - 60+ days to get things fully set up and running and it’s going to add a lot of value and opportunities for you – Subscribe Now!

Chris Vermeulen
Chief Investment Strategist


Stock & ETF Trading Signals

Tuesday, January 8, 2019

How to Spot a Tradable Market Top

If you are a long term investor, swing trader, or day trader, then you could find one or all of the charts below interesting. What I am going to briefly cover and show you could make you think twice about how you are investing and trading your money. I will be the first to admit you should not, and cannot, always pick market tops or bottoms, but there are certain times when it’s worth betting on one.

Below I have shared three charts, each with a different time frame using daily, 30 minutes, and a 10-minute chart. Each chart also has a different technical analysis technique and strategy applied. Each shorter time frame chart as we work down the page zooms in closer to more imminent price action that should take place over the next few days.

DAILY CHART SIGNALS MARKET TOP – INVESTING/SWING TRADING

The daily chart below shows a clear overall trend which is to the downside. Trends are more likely to continue than they are to reverse, hence the saying “The Trend Is Your Friend.”

A key piece of data on this chart is the blue investing cycle line at the bottom. If this is trending down or below the 50 level, then money should be focused on profiting from falling prices via inverse ETF’s, short selling, or put options.

Equally important are the yellow and baby blue cycle lines at the bottom. When these enter the upper reversal zone, we should expect sellers to step into the market and for the price to fall.


30 MINUTE CHART SIGNALS MARKET TOP – SWING/MOMENTUM TRADING

I apologize for the noisy chart below, a lot is going on there, but if you focus on the yellow text and drawings, it will help keep things simple. This chart shows several reasons why we expect the price to fall. Based on technical and statistical analysis this chart points weakness over the next 1 - 3 trading days.


10-MINUTE CHART SIGNALS MARKET TOP – MOMENTUM/DAY TRADING

Monday night (Jan 7th) after the closing bell the SPY ETF chart generated a sizable price spike to the downside. Those of you who follow our spikes and or at least know about these setups then you know we expect the price to reach at least one if not all spike targets which are 30%, 50%, and 100% of the spike within 36 hours.

So far in 2019 we have has six price spikes five winners, one loser which is an 83% win rate thus far. Today’s spike is abnormally large not sure what that means regarding this one being a success but it is another spike signal, and the odds favor a move down once you see the other analysis supporting this setup.


CONCLUSION

If you are boring long term investor and have been stuck having to ride the stock market roller coaster with your life savings my trading newsletter can help you with your long term portfolio to not only avoid losses but profit from the collapse with one simple inverse exchange traded fund which trades like a stock and you buy and sell it at anytime! Knowing when you put your nest egg to work, and when to back away and protect it is crucial if you want to become wealthy or become wealthy.

On the flip side, if you are an active trader looking for monthly trades then be sure to join the Wealth Building Newsletter today and receive my daily pre-market video analysis, so you understand what took place yesterday, during overnight trading, and what to expect when the market opens.

Subscribe today and become part of our trading community and prosper from the coming market correction and real estate downturn.

Sign Up for Chris Vermeulen's Wealth Building Newsletter Here > The Technical Traders


Friday, December 29, 2017

2018 First Quarter Technical Analysis Price Forecast

As 2017 draws to a close, our analysis shows the first Quarter of 2018 should start off with a solid rally. Our researchers use our proprietary modeling and technical analysis systems to assist our members with detailed market analysis and timing triggers from expected intraday price action to a multi-month outlook.

These tools help us to keep our members informed of market trends, reversals, and big moves. Today, we are going to share some of our predictive modelings with you to show you why we believe the first three months of 2018 should continue higher.

One of our most impressive and predictive modeling systems is the Adaptive Dynamic Learning system. This system allows us to ask the market what will be the highest possible outcome of recent trading activity projected into the future. It accomplishes this by identifying Genetic Price/Pattern markers in the past and recording them into a Genome Map of price activity and probable outcomes.

This way, when we ask it to show us what it thinks will be the highest probable outcome for the future, it looks into this Genome Map, finds the closest relative Genetic Price/Pattern marker and then shows us what this Genome marker predicts as the more likely outcome.

This current Weekly chart of the SPY is showing us that the next few Weeks and Months of price activity should produce a minimum of a $5 – $7 rally. This means that we could see a continued 2~5% rally in US Equities early in 2018.


Additionally, the ES (S&P E-mini futures) is confirming this move in early 2018 with its own predictive analysis. The ADL modeling system is showing us that the ES is likely to move +100 pts from current levels before the end of the first Quarter 2018 equating to a +3.5% move (or higher). We can see from this analysis that a period of congestion or consolidation is expected near the end of January or early February 2018 – which would be a great entry opportunity.


The trends for both of these charts is strongly Bullish and the current ADL price predictions allow investors to understand the opportunities and expectations for the first three months of 2018. Imagine being able to know or understand that a predictive modeling system can assist you in making decisions regarding the next two to three months as well as assist you in planning and protecting your investments? How powerful would that technology be to you?

Our job at Technical Traders Ltd. is to assist our members in finding and executing profitable trades and to assist them in understanding market trends, reversals, and key movers. We offer a variety of analysis types within our service to support any level of a trader from novice to expert, and short term to long term investors.

Our specialized modeling systems allow us to provide one of a kind research and details that are not available anywhere else. Our team of researchers and traders are dedicated to helping us all find great success with our trading.

So, now that you know what to expect from the SPY and ES for the next few months, do you want to know what is going to happen in Gold, Silver, Bonds, FANGs, the US Dollar, Bitcoin, and more?

Join The Technical Traders Right Here to gain this insight and knowledge today.

Chris Vermeulen

Stock & ETF Trading Signals

Thursday, March 23, 2017

The Dancing Bears

By Jeff Thomas

In the early 2000s, I recommended to associates that we were in for a major gold boom. Most thought that this was a ridiculous suggestion and didn’t buy a single ounce. I continued to recommend the purchase of gold regularly over the ensuing years, and the price continued to rise. Only in 2011 did they start to buy, at a time when gold was peaking. We were due for a correction and in late 2011, it arrived. For several years, the price has remained in the neighbourhood of $1,200—roughly the price it needs to be to bother removing it from the ground.

During that time, gold has periodically risen a bit, then gotten knocked down again. It’s understandable that this should happen. Central banks have a stake in holding down the gold price, since a rising gold price makes it appear more attractive than storing cash in banks. We’ve reached the point that the central banks have run out of tricks to float the economy and we’re already past due for a crash.

But crashes don’t always occur as soon as they become logical. As long as the public can be fooled into remaining confident in the system, a doomed economy can limp along for a bit before toppling. Statistics on unemployment and inflation can be fudged (and they have been). The stock market can be falsely pumped up (and it has been) in order to create the illusion that all is well. These factors, taken together with knocking down the price of gold periodically, helps to convince people that they should keep their money in cash and their cash in the bank, not in gold.

Just as in 2000, the number of people who understand that gold is not the equivalent of a stock but a store of wealth during dramatically changing times is quite small—certainly less than 1% and more likely less than 1/10th of 1%. Those that possess this understanding tend to hold gold long-term and are relatively unconcerned about fluctuations—even if they’re over $100 in a given month. They’re in it for the long haul and believe that, eventually, gold will rise dramatically and may well be the only safe haven after a crash.

But let’s go back to those speculators that waited until gold had risen dramatically before jumping on board the gold train. During the last four-year period, whenever gold rose as a result of economic and political developments, many of them would buy in once more, after it had risen significantly. Then, when it had been knocked down again, they tended to sell—often at the new bottom.

Of course, this behaviour is not limited just to the purchase of gold. In fact, a very high percentage of investors “play” the stock market in this way. They wait until everyone and his dog is buying in and the price is peaking, often buying on margin in order to maximize their positions. Then, when the bubble pops, they tend to ride the market down, hoping in vain that the price will return at least to what it was when they bought in. In essence, they tend to buy high and sell low almost every time.

The gold bears—those investors who don’t truly understand that gold is a very different animal from stocks—typically dislike gold but buy high when it becomes trendy to do so and sell low after it’s been knocked down. This dance is guaranteed to cause the gold bears to lose money time after time.

The dance is sometimes described as “chasing the market,” or “following the trends.” Brokers keep the dance going by advising their clients of established trends, telling them that they’re “missing out if they don’t get in now.” They serve as the market’s equivalent of a caller in a square dance: “Swing your client to and fro—watch his investment dollars go.”

Just as few investors understand the economic nature of gold, they also tend to overlook the fact that the broker doesn’t benefit from the success of the client—he makes his money when the client buys and sells frequently. So, of course his advice is going to be for the client to keep dancing.

So, will this dance go on as it is, ad infinitum? Well, no. There will be a dramatic change following a crash in the markets. Following any major crash, a panic occurs and whatever money is left on the table scrambles to find a new (hopefully safe) home. Following the coming crash, a portion of that money will head into gold. The price will rise dramatically, very possibly to such a degree that it can no longer be easily knocked down by the central banks.

At first the gold bears will assume that it’s an anomaly. Then, as gold passes $1,500, some will dip their toes in. As it passes $1,800, some will wade in. Beyond $2,000, this trend will strengthen quite a bit. As the crash deepens, stocks will tumble further. The bond bubble may also pop, increasing gold’s shine. At some point, bankers may begin to freeze accounts, create bank holidays, and/or confiscate deposits. At that point, gold will head into its long-predicted mania phase and the bears will be falling over each other, chasing the buying trend.

Gold will rise to a logical price in keeping with its value as a hedge against a collapsing economy. At that point, it would make sense for it to stop, but that’s not what will happen. Those who understand gold will cease their purchases and sit on what they have. But then a new dance will begin. The bears will become decidedly bullish. It’s important to note that, at this point, they will not fully understand why gold is rising so dramatically; they’ll just know that it is. They’ll want to get in on the gold rush and will do whatever they have to in order to keep buying.

They’ll find that physical gold is in short supply, as traditional holders are unwilling to sell, seemingly at any price. Potential buyers will offer $50 above spot, then $100 above spot, then more. They’ll additionally buy on margin in order to increase their position. It will be at this point that the mania will take hold. Irrationally high prices will become the new norm. How high will it go? $10,000? $20,000? Impossible to say. It will rise as high as desperation makes it rise, and we cannot now determine what that level of desperation will be.

A new bubble will be created, but this time, it won’t be in stocks or bonds. It’ll be in gold and, like all bubbles, it will eventually pop. This will occur when those who understand the nature of gold recognize that the price has far exceeded what’s logical and, as much as they value gold, they’ll sell a portion of their holdings and use the proceeds to invest in whatever assets have already bottomed and have nowhere to go but up.

They’re likely to retain a portion of their gold holdings for the same reason they always have, but will be happy to release a portion when it becomes significantly overvalued. This will cause the gold bubble to pop and the gold bears, who have recently become bulls, will wonder where it all went wrong. At this point, they still won’t understand gold; they’ll simply have chased yet another trend and lost.

So, is there a moral here? Well, if so, it’s simply that an investor should not become involved in a market that he doesn’t understand. Nor should he trust his broker to understand it for him. Ironically, as long as there have been markets, there have been those who go out on the dance floor without first learning the dance. A great deal of profit will be made by some gold investors, but the majority are likely to leave the floor with empty dance cards.

Regards,
Jeff Thomas

Editor’s Note: Gold is crisis insurance. Without it, you’re highly vulnerable. And there’s a good chance the next financial crisis could wipe you out.

New York Times best selling author Doug Casey thinks that crisis is coming soon. He shares all the details in this urgent video. Click here to watch it now.


The article The Dancing Bears was originally published at caseyresearch.com


Stock & ETF Trading Signals

Wednesday, February 15, 2017

Why It Feels Like the Dot Com Bubble All Over Again

By Justin Spittler

Today, we’re going to do something different. As you can imagine, we hear from our readers a lot. Some of them have nice things to say. Others…not so much. Most importantly, though, we get a lot of questions. Last week, we received a question that was so important, we’re dedicating this entire issue to it. This question might be something you’re wondering yourself…and it could have a huge impact on your money.

It comes from Joseph J., a subscriber to The Casey Report:
I read today’s newsletter (Trump Should Be Careful What He Wishes For) with great interest. In it you stated that “U.S. stocks are incredibly expensive…” But my question is: Based against what? We are in uncharted territory, and every single newsletter writer that I have asked this question of has failed to provide an answer. Perhaps you will be different.
Thank you for putting us in the hot seat, Joseph. Lucky for us, we didn’t make this claim lightly. We have plenty of facts to back it up. Before we show you the proof, you have to realize something: There are many different ways to value stocks. Everyone has their preference. A lot of folks use the price-to-earnings (P/E) ratio. Other investors look at a company’s book value or cash flow.

We prefer to use the cyclically adjusted price-to-earnings (CAPE) ratio.…
This ratio is the cousin of the popular P/E ratio. The only difference is that it uses 10 years’ worth of earnings instead of just the previous year’s. This smooths out the up and downs of the business cycle. It gives us a long-term view of the market. Right now, the CAPE ratio for companies in the S&P 500 is 28.4. That’s 70% higher than its historical average. U.S. stocks haven’t been this expensive since the dot com bubble.


This isn’t a good sign. As you may remember, the S&P 500 fell 41% from 2000–2002. The Nasdaq plunged 78% over the same period.

But the CAPE ratio is just one way to value stocks.…
To prove we’re not cherry picking, let’s look at some other metrics. First up, the price-to-sales (P/S) ratio. This ratio is just like the P/E ratio, but it uses the previous year’s sales instead of earnings. According to credit rating agency Standard & Poor’s, the S&P 500 currently trades at 2.02 times sales. That’s 40% higher than its historical average, and the highest level since at least 2000. Clearly, U.S. stocks are more expensive than normal. But that’s not even the main reason investors are nervous about them.

U.S. stocks seem to have lost touch with reality.…
As we all know, the stock market allows investors to own a piece of publicly traded companies. Most of the companies on the NYSE (New York Stock Exchange) are U.S. companies. Because of this, you would think the stock market would generally follow the health of the economy. If the economy’s booming, stocks should be soaring. If the economy’s struggling, stocks should be, too. That hasn’t been the case lately.

Since 2009, the S&P 500 has surged 239% to record highs. That makes this one of the strongest bull markets in U.S. history. During that same span, the U.S. economy has grown just 2% per year. That makes the current “recovery” one of the weakest since World War II. In short, Main Street hasn’t kept up with Wall Street.

The U.S. stock market is now clearly in “bubble territory”.…
Just look at the chart below. This chart compares the value of the U.S. stock market with the nation’s gross domestic income (GDI). GDI is like gross domestic product (GDP), but instead of measuring how much money a country spends, it measures how much money a country earns. It counts things like wages, corporate profits, and tax receipts. A high ratio means stocks are expensive relative to how much money an economy makes. You can see in the chart below that this key ratio is well above its housing bubble high. It’s now approaching the record high it hit during the dot-com bubble.


This is another serious red flag.…
But it doesn't mean stocks are going to crash next month, or next year. For this bubble to pop, something will have to prick it. We’re not sure what that will be…where it will come from…or when it will happen…
But we do know stocks don’t go up forever. Sooner or later, this bubble is going to end. When it does, many investors are going to take huge losses. Years’ worth of returns could disappear in a matter of months, even weeks.

The good news is that you can still crisis-proof your portfolio. Here are three ways to get started:
  1. Set aside more cash. Holding extra cash will help you avoid big losses if stocks fall. It will also put you in a position to buy stocks when they get cheaper.
  2. Own physical gold. Gold is the ultimate safe-haven asset. It’s survived every financial crisis in history. It will certainly survive the next one.
  3. Close your weakest positions. Start by selling your most expensive stocks. They tend to fall the hardest during major selloffs. You should also get rid of companies that need cheap debt to make money. If problems in the bond market continue, these companies could be in trouble.
These simple strategies could save you tens of thousands, possibly more, when the inevitable happens.

Chart of the Day

Miners are rallying again. Today’s chart shows the performance of the S&P/TSX Global Mining Index. This index tracks the performance of companies that mine commodities like gold, silver, aluminum, and copper. You can see that this index skyrocketed at the beginning of last year. It nearly doubled between January and July. Then, it went almost nowhere for six months.

Three weeks ago, the S&P/TSX Global Mining Index broke out of this sideways trading pattern. It’s now trading at its highest level since early 2015. This is very bullish. It tells us that mining stocks may have just entered a new phase of a bull market. If you’ve been thinking about buying mining stocks, now might be a good time to get in. But don’t worry if you don’t know what to buy.

We recently put together a presentation that talks about one of the richest gold deposits in the world. Our top gold analyst has never seen anything like this in his career. Early investors in the company that owns this deposit could make 1,000% or more. But this opportunity won’t last long. Just two months from now, this world-class mine will “go live.” When it does, this company’s stock should shoot through the roof. For more details on this incredible opportunity, click here.


Stock & ETF Trading Signals

Wednesday, January 20, 2016

Technical Evidence Indicates Major Price Movement Just Getting Started!

Stocks around the globe were pummeled again last week. This is no surprise to our subscribers as our predictive trend analytics model gave us clear technical evidence that important multi year highs had completed back in the middle of 2015. I continue to remain steadfastly bearish in my outlook for stocks.

Last Friday, January 15, 2016, the SPX broke below its Aug. 24, 2015 low, which is equivalent to a major sell signal if price closes the month below that level.

Last week, The Dow Jones Industrial Average slumped 511 points, or 3.1%, to 15,866, while the S&P 500 slid 64 points, or 3.4%, to 1,856.34, led by the financials, technology and energy sectors. The Nasdaq Composite tumbled 190 points, or 4.1%, to 4,424.35. Subscribers and I managed to catch a 33% quick intra-week bounce trading the SSO ETF and then got out of harm’s way as volatility took hold once again.

European stocks were unable to escape the downward trend from other markets, and the Stoxx Europe 600 index lost 2.8%. The dollar fell to a one-year low vs. the yen. Gold rose $22.40, or 2.1%, to $1,096.20 an ounce.

The SPX is currently testing major support. This is consistent with a “cycle low” that arrived over the weekend. Even though we are in a bear market, we should expect a “Bear Market Rally” sucking every last investor into long positions, before dropping much lower through previous support areas. This will be a very “short term bottom” this week.

We are in a long term downtrend now; it is not a “hiccup” as we experienced back in 2012.

If the stock market is going to stage a rally from here, this is a good time to start, right when everyone is jumping off the ship and the sentiment is so extremely negative. Just to give you a feel for the level of panic selling on Friday, my panic selling indicator which tells us when short term bottoms are likely to happen as everyone is running for the door, this contrarian indicator spiked to 50. Now any reading over 3 is panic in the market, and a reading of 9-18 is typically a multi week low. So you can see how 50 is VERY extreme.

Because we are entering a bear market and institutions will be unloading shares area record pace going forward, I feel this extreme level of panic selling (50) is only going to trigger a bounce lasting a week or so, then more distribution selling will take hold.

trap2
trap1


A slew of disappointing U.S. data shows that manufacturing and consumer spending are in trouble. Empire State factory index declined sharply this month to its lowest level since the recession. Retail sales declined by 0.1% in December 2015 and a report on industrial production compiled showed that activity declined for the third straight month.

The New Year is not off to good start. In fact, it may be the worst start ever of a New Year in many world stock indices. Instead off irrational exuberance that had previously been so evident, investors of world equity markets are clearly starting to panic. We all know things are not right. We know it hasn’t been okay since the 2008 financial crisis. The effort by the central banks to get over the hump has fueled an “Asset Bubble” in the stock markets.

This in turn should start to fuel safe haven buying in gold. Gold’s day in the sun is soon approaching. I believe this new year will prove to be a pivotal year for gold, silver and miners.

The “talking heads” tell us that the stock market is falling because energy prices are falling. We need higher energy (gasoline) prices. Really? They claim that energy companies are going out of business and that tens of thousands of people will lose jobs and unemployment will rise. Really? Didn’t the jobs numbers show hundreds of thousands of people getting new jobs – in fields outside of energy? Who are you going to believe?

Later this week I will be posting an exciting video show you how to make a fortune during this pending bear market and exactly how I did this in 2008 – 2012 to become financially free before I turned 30 years of age. Stay tuned and be sure to opt into my free email list if you want to see this exciting, inspiring and educational video!

Visit Here > www.Gold & Oil Guy.com 
Chris Vermeulen

Stock & ETF Trading Signals

Tuesday, September 8, 2015

Muddling Through Shanghai

By John Mauldin

“He who knows when he can fight and when he cannot, will be victorious.”
– Sun Tzu

A couple of weeks ago I was complaining about 47,000 China reports clogging my email. The number now feels like it is well into six figures (perhaps a slight exaggeration). Maybe my memory is going, but there wasn’t nearly as much China talk on the way up. Funny how that works.

This weeks free webinar "Trading for Income with Risk Protection"....Get your seat HERE!

Is China collapsing? I think parts of China are under severe pressure if not outright recession, and clearly the stock market is a disaster. Anyone who bought Shanghai or Shenzhen stocks on margin this year is probably on the brink.

That said, China itself is not collapsing. There are parts of China that are doing just fine, thank you very much. It does have serious problems, though. The Pollyannas and the Cassandras are both wrong. The change in tone in the Financial Times is quite amusing. Their recent hyperbolic, bearish section called “China Tremors” is a case in point. Of the last 30 articles on China on their website, I found less than a handful that were positive on China. My take? China will muddle through, at least for the near term.

China is in transition, a transition that was clearly telegraphed if you have been paying attention. Our recent book on China (A Great Leap Forward?) clearly laid out this new path. Today we are going to talk about this precarious, difficult transition, which may impose profound impacts on much of the rest of the world. This transition is going to change the way global trade has worked in the past. There will be winners and losers.
But first, a brief comment on today’s employment report and how it impacts the need for a rate hike by the Federal Reserve in September. I offer a little different perspective on the coming decision.

To Hike or Not To Hike – That Is the Question

Today’s unemployment report was lackluster, as has been the case for the initial reporting for the last two Augusts. Both were revised significantly upward – August 2012 was eventually revised up 96,000 jobs, while August 2013 saw a final revision upward of 69,000 jobs, and August 2014 saw a final count of +213,000 jobs. Part of the reason for the major revisions is that only some 70% of the potential survey participants actually responded (hat tip Joan McCullough).

Evidently the United States is becoming like Europe, and we are all going on vacation in August. Or at least the department personnel responsible for handling employment figures are. Expect to see significant upward revisions in the coming months, just as July saw another 30,000 added and June saw a plus 14,000.

This report was not so ugly that it would take the breath away from hawks wanting to raise rates or force doves into agreeing to a rate increase. Nothing changed, really. That is illustrated by the two articles below that were side-by-side on the New York Times website within an hour of the release of the report (hat tip Brent Donnelly). Everybody got to see what they wanted to see.


I can’t remember a time when there was such serious disagreement over what the Federal Reserve should do regarding a rate hike. I have been in several groups of analysts and economists in the last few months, and I must confess to being surprised at the split in opinions.

Upon reflection, I think I can actually understand both positions. First, the Fed keeps reiterating that they are “data dependent” – thus the focus on every little bit of data, no matter how trivial. Let me see if I can explain why both sides can feel they are right and then why, to my way of thinking, they are missing the point.

On the side of those who feel that a rate hike should be postponed at the September meeting, it must be remembered that most rate hikes are in anticipation of an economy beginning to pick up speed. The Fed has said they want to see low unemployment, and under the leadership of Bernanke and now Yellen, they have a 2% inflation target. Remember, their congressional mandate is to promote stable prices and full employment.

While unemployment did drop to 5.1%, that is a “soft” unemployment figure. The participation rate is down. The number of part time workers wanting full time jobs is still high. And the new employment trend is not encouraging.

August's gains were well below trend. The average of the previous five months is 211,000; for the previous six before that it was 282,000. The yearly employment gain, 2.1%, is off 0.2 point from the late 2014/early 2015 rate. The private sector gain is 60,000 below the average of the previous six months. (The Liscio Report)

We are not close to 2% inflation; and, frankly, it doesn’t look like we’re going to get there for a while. The economy is, at best, stuck in a low, Muddle Through gear (as I predicted years ago); and getting back to a stable 3% growth rate, let alone the occasional 4–5% that we used to see, seems out of reach. The dollar is strong and getting stronger and is not only holding down inflation but also, anecdotal evidence suggests, slowing down exports in various sectors of the economy.

There were those who argued that a bubble was developing in the stock market, but it appears the stock market is taking care of itself to make sure it doesn’t become overheated. There is no need to pile on to see if we can drive asset prices even lower. Further, we are just in the beginning of a housing recovery. Why raise mortgage rates, etc., at the beginning?

In such an environment, why would you raise rates in order to keep the economy from overheating? The last thing we seem to be doing is overheating, let alone even getting to a slow boil. Instead, we may already be cooling down. If the economy does start to pick up and inflation becomes an issue, we could raise rates then as fast as we would need to. Or so Kocherlakota and his friends on the FOMC say. And thus we should postpone a rate increase until we see a reason for it. Kind of like, don’t shoot till you see the whites of their eyes.

Those who think we should raise rates likewise have an array of data to support their case. GDP grew 3.7% in the second quarter. If you take out the weather related first quarter 2015 GDP figure, GDP growth is running well over 3%. Given the global headwinds currently buffeting economies, that’s about as good as it’s going to get.

This economy has weathered tax increases and the abrupt changes of Obamacare, as well as a significant drop in capital spending related to oil production and has “kept on ticking.” If there is a recession in our near future, as David Rosenberg points out, it would be the first recession ever that did not see consumer spending or employment go down for the count.

We’ve always been able to find negatives in the unemployment rate. Even if unemployment were somehow to ratchet down to less than 200,000 per month, it will be for only two quarters at the most; and it may be that before the end of the year we will be under 5% unemployment. We just set a record for all measures of corporate profits in absolute terms. We finally set a new record for real disposable personal income in July, again in absolute terms. As Jim Smith says,

What all this means is that when the FOMC meets on September 16 and 17, they will be looking at a US economy in which more people are employed than ever before, earning more money than ever before, producing more goods and services than ever before, and with personal consumption expenditures and corporate profits at the highest levels ever seen. If that is not a prescription for finally raising the Fed Funds rate, then I can't imagine what it would take to get them to move. (source)

Despite the significant slowdown in the oil patch, the level of investment in the second quarter was almost 4% higher than last year. Businesses are optimistic. Even given the turmoil in Canada, China, the Eurozone, and the rest of the BRICS, and even though global trade is beginning to fall off a little bit, the US economy seems to be doing quite well in spite of it all.

What else do you need in order to begin to normalize rates? Inflation is under control and according to most Fed economists seems to be ticking higher. Unemployment is moving lower. The economy is doing quite well. If not now, when? How much better do you want things to get before rates are taken back to something close to normal?

I must confess that I personally lean toward the latter argument, but I have a few additional reasons for thinking the Federal Reserve should act in September. As I have presented in previous letters, there are real reasons to think that low interest rates are not only creating malinvestment but also encouraging companies to use financial engineering and to buy their competition rather than purchasing the tools of production and actually competing head on. These behaviors distort an economy over the long term. They frustrate Schumpeter’s forces of creative destruction.

Further, what policy tools does the Federal Reserve still have available if we enter a recession? I admit that doesn’t seem to be a likely possibility today, but there are many potentials for exogenous shocks to the US economy that could cause a recession. Further, in the history of the United States we have never had a period longer than nine years without a recession. This recovery, relatively weak though it is, is getting long in the tooth. Do we want the Fed to confront the next recession with another round of massive quantitative easing as the only policy tool left to deploy? When their own research shows that QE wasn’t very useful and when we can clearly see the distortions caused by QE in emerging markets around the world?

The Federal Reserve is functionally incapable of not feeling the need to “do something” in the midst of a recession. If the only tool they have is further massive quantitative easing, they will use it. Damn the distortions, full speed ahead!

I would not argue for a rapid rate hike. In fact, I would prefer 1/8 of a point at every meeting, rather than the typical quarter point. But there is no reason not to raise a quarter of a point at this meeting, skip a meeting to make sure everybody can take a deep breath, and then raise once more before the end of the year.

I mean, really? Does the Fed think this economy is so fragile that it can’t take a lousy quarter of a point increase in interest rates? The Federal Reserve needs to begin to restock its policy tool chest now. While I personally think we are a long way from ever seeing 5% Fed funds rates again, a 2% rate can probably easily be absorbed if it comes slowly. And that rate would give the Fed some policy tools when, not if, we enter the next recession.

Now, let’s turn back to China.

Repeat After Me: Chinese Stocks Are Not the Chinese Economy

It’s easy to assume that a country’s stock market reflects the condition of its economy, but that is not always the case. Further, what the stock market really does reflect is the consensus estimate of an economy’s future condition. More specifically, stock prices reveal future expectations for corporate profits.

This generally applies to both the United States and China. One key difference, though, is that most American stocks represent companies that seek to make profits. In China, that isn’t necessarily the case. The Chinese stock market includes many state-owned enterprises (SOEs), whose executives answer to bureaucrats in Beijing. The government views them as public policy tools. Everyone is happy if the SOEs make a profit, but profit is not the first priority.

If US stock prices generally tell us more about the future than the present, except in times of serious over- or undervaluation, then Chinese stock prices tell us even less about either. Just as last year’s incredible run-up in Chinese stocks did not signal an economic boom, the ongoing decline does not signal an economic bust. The correlations aren’t just weak, they are nonexistent. China’s official economic data is also questionable and would be so even if GDP were a precise measurement tool. As we discussed last week, it usually isn’t.

It is no stretch to say we are flying blind about China.

Fortunately, we have diligent researchers like Leland Miller of China Beige Book, whose research firm does the hard work of gathering reliable data each quarter from thousands of companies in China and assembling it in comprehensible form. His data shows that China’s economy has actually been in good shape since China stopped acting Chinese last year. But even then, you have to separate the Chinese economy into several categories.

China Good, China Bad, & China Ugly

Among the many letters and reports on China that I received over the last month, I’d like to single out an excellent research note that the team at Gavekal Dragonomics published last week, called “What to Worry About and What Not to in China.” I appreciated this piece, because it really helped me structure my worrying. I dislike spending energy worrying about the wrong things. Further, worrying about the wrong things can be dangerous. It’s when you are paying attention to the wrong things that what you should have been paying attention to jumps up and bites you on the derrière.

In the spirit of the Gavekal note, here is the good side of China. We’ll get to the bad and the ugly below.
Chinese real estate prices will stabilize. We hear a lot about China’s massive infrastructure boom and the resulting “ghost cities.” These aren’t just rumors. The government mandated the construction of entire cities to house the formerly agrarian population as it shifts to industrial jobs. Provincial governments earned as much as 80% of their revenues from land sales. Essentially, this is a process where they take possession of rural land that has very little value in price terms, declare it to be available for development, and can make profits several orders of magnitude greater than their costs. Nice work if you can get it.

The ghost cities will not stay empty forever. They will fill with people over the next few years (in some cases more than a few). The recent housing bubble is more a function of young people wanting to cram into certain popular areas. The broader internal migration will support housing prices even as the bubble areas pop.

It might be helpful to think of the Chinese ghost cities as analogous to the overbuilt condos in Florida. Prices in Florida did in fact collapse, and places were selling for a fraction of their construction cost. I wrote at the time that I thought they would be very good investments, because the number of people wanting to retire to Florida is actually a fairly steadily growing figure. Low taxes, good weather, positive infrastructure, excellent medical care – what’s not to like, other than it’s not Texas? Just saying…..

To continue reading this article from Thoughts from the Frontline – a free weekly publication by John Mauldin, renowned financial expert, best-selling author, and Chairman of Mauldin Economics – please click here.


Get our latest FREE eBook "Understanding Options"....Just Click Here!

Tuesday, August 18, 2015

A Great Insight into Why Commodity Weakness Will Persist

By John Mauldin 

In today’s Outside the Box, good friend Gary Shilling gives us deeper insight into the global economic trends that have led to China’s headline making, market shaking devaluation of the renminbi. He reminds us that today’s currency moves and lagging growth are the (perhaps inevitable) outcome of China massive expansion of output for many products that started more than a decade ago. China was at the epicenter of a commodity bubble that got underway in 2002, soon after China joined the World Trade Organization.

As manufacturing shifted from North America and Europe to China –with China now consuming more than 40% of annual global output of copper, tin, lead, zinc and other nonferrous metal while stockpiling increased quantities of iron ore, petroleum and other commodities – many thought a permanent commodity boom was here.

Think again, Australia; not so fast, Brazil. Copper prices, for instance, have been cut nearly in half as world growth, and Chinese internal demand, have weakened. Coal is another commodity that is taking a huge hit: China’s imports of coking coal used in steel production are down almost 50% from a year ago, and of course coal is being hammered here in the US, too.

And the litany continues. Grain prices, sugar prices, and – the biggee – oil prices have all cratered in a world where the spectre of deflation has persistently loomed in the lingering shadow of the Great Recession. (They just released grain estimates for the US, and apparently we’re going to be inundated with corn and soybeans. The yield figures are almost staggeringly higher than the highest previous estimates. Very bearish for grain prices.)

Also, most major commodities are priced in dollars; and now, as the US dollar soars and the Fed prepares to turn off the spigot, says Gary, “raw materials are more expensive and therefore less desirable to overseas users as well as foreign investors.” As investors flee commodities in favor of the US dollar and treasuries, there is bound to be a profound shakeout among commodity producers and their markets.

See the conclusion of the article for a special offer to OTB readers for Gary Shilling’s INSIGHT. Gary’s letter really does provide exceptional value to his readers and clients. It’s packed with well-reasoned, outside-the-consensus analysis. He has consistently been one of the best investors and analysts out there.

There are times when you look at your travel schedule and realize that you just didn’t plan quite as well as you could have. On Monday morning I was in the Maine outback with my youngest son, Trey, and scheduled to return to Dallas and then leave the next morning to Vancouver and Whistler to spend a few days with Louis Gave. But I realized as Trey and I got on the plane that I no longer needed to hold his hand to escort him back from Maine. He’s a grown man now. I could’ve flown almost directly to Vancouver and cut out a lot of middlemen. By the time that became apparent, it was too late and too expensive to adjust.

Camp Kotok, as it has come to be called, was quite special this year. The fishing sucked, but the camaraderie was exceptional. I got to spend two hours one evening with former Philadelphia Fed president Charlie Plosser, as he went into full-on professor mode on one topic after another. I am in the midst of thinking about how my next book needs to be written and researched, and Charlie was interested in the topic, which is how the world will change in the next 20 years, what it means, and how to invest in it. Like a grad student proposing a thesis, I was forced by Charlie to apply outline and structure to what had been only rough thinking.

There may have been a dozen conversations like that one over the three days, some on the boat – momentarily interrupted by fish on the line – and some over dinner and well into the night. It is times like that when I realize my life is truly blessed. I get to talk with so many truly fascinating and brilliant people. And today I find myself with Louis Gave, one of the finest economic and investment thinkers in the world (as well as a first class gentleman and friend), whose research is sought after by institutions and traders everywhere. In addition to talking about family and other important stuff, we do drift into macroeconomic talk. Neither of us were surprised by the Chinese currency move and expect that this is the first of many
.
I did a few interviews while I was in Maine. Here is a short one from the Street.com. They wanted to talk about what I see happening in Europe. And below is a picture from the deck of Leen’s Lodge at sunset. Today I find myself in the splendor of the mountains of British Columbia. It’s been a good week and I hope you have a great one as well.


Oops, I’ve just been talked into going zip-trekking this afternoon with Louis and friends. Apparently they hang you on a rope and swing you over forests and canyons. Sounds interesting. Looks like we’ll do their latest and greatest, the Sasquatch. 2 km over a valley. Good gods.

Your keenly aware of what a blessing his life is analyst,
John Mauldin, Editor

Stay Ahead of the Latest Tech News and Investing Trends...

Each day, you get the three tech news stories with the biggest potential impact.

Commodity Weakness Persists

(Excerpted from the August 2015 edition of A. Gary Shilling’s INSIGHT)
The sluggish economic growth here and abroad has spawned three significant developments – falling commodity prices, looming deflation and near-universal currency devaluations against the dollar. With slowing to negative economic growth throughout the world, it’s no surprise that commodity prices have been falling since early 2011 (Chart 1). While demand growth for most commodities is muted, supply jumps as a result of a huge expansion of output for many products a decade ago. China was the focus of the commodity bubble that started in early 2002, soon after China joined the World Trade Organization at the end of 2001.


China, The Manufacturer


As manufacturing shifted from North America and Europe to China – with China now consuming more than 40% of annual global output of copper, tin, lead, zinc and other nonferrous metal while stockpiling increased quantities of iron ore, petroleum and other commodities – many thought a permanent commodity boom was here.

So much so that many commodity producers hyped their investments a decade ago to expand capacity that, in the case of minerals, often take five to 10 years to reach fruition. In classic commodity boom-bust fashion, these capacity expansions came on stream just as demand atrophied due to slowing growth in export-dependent China, driven by slow growth in developed country importers. Still, some miners maintain production because shutdowns and restarts are expensive, and debts incurred to expand still need to be serviced. Also, some mineral producers are increasing output since they believe their low costs will squeeze competitors out. Good luck, guys!

Copper, Our Favorite


Copper is our favorite industrial commodity because it's used in almost every manufactured product and because there are no cartels on the supply or demand side to offset basic economic forces. Also, copper is predominantly produced in developing economies that need the foreign exchange generated by copper exports to service their foreign debts. So the lower the price of copper, the more they must produce and export to get the same number of dollars to service their foreign debts. And the more they export, the more the downward pressure on copper prices, which forces them to produce and export even more in a self reinforcing downward spiral in copper prices. Copper prices have dropped 48% since their February 2011 peak, and recently hit a six year low as heavy inventories confront subdued demand (Chart 2).


Even in 2013, after two solid years of commodity price declines, major producers were in denial. That year, Glencore purchased Xtrata and Glencore CEO Ivan Glasenberg called it “a big play” on coal. “To really screw this up, the coal price has got to really tank,” he said at the time. Since then, it’s down 41%. But back in February 2012 when the merger was announced, coal was selling at around $100 per ton and Chinese coal demand was still robust.

Nevertheless, Chinese coal consumption fell in 2014 for the first time in 14 years and U.S. demand is down as power plants shift from coal to natural gas. Meanwhile, coal output is jumping in countries such as Australia, Colombia and Russia. China’s imports of coking coal used in steel production are down almost 50% from a year ago. Many coal miners lock in sales at fixed prices, but at current prices, over half of global coal is being mined at a loss. U.S. coal producers are also being hammered by environmentalists and natural gas producers who advocate renewable energy and natural gas vs. coal.

Losing Confidence?


Recently, major miners appear to be losing their confidence, or at least they seem to be facing reality. Anglo-American recently announced $4 billion in writedowns, largely on its Minas-Rio $8.8 billion iron ore project in Brazil, but also due to weakness in metallurgical coal prices. BHP took heavy writedowns on badly timed investments in U.S. shale gas assets. Rio Tinto’s $38 billion acquisition of aluminum producer Alcan right at the market top in 2007 has become the poster boy for problems with big writeoffs due to weak aluminum prices and cost overruns.

Glencore intends to spin off its 24% stake in Lonmin, the world’s third largest platinum producer. Iron ore-focused Vale is considering a separate entity in its base metals division to “unlock value.” Meanwhile, BHP is setting up a separate company, South 32, to house losing businesses including coal mines and aluminum refiners. That will halve its assets and number of continents in which it operates, leaving it oriented to iron ore, copper and oil.

Goldman Sachs coal mines suffered from falling prices and labor problems in Colombia. It is selling all its coal mines at a loss and has also unloaded power plants as well as aluminum warehouses. The firm’s commodity business revenues dropped from $3.4 billion in 2009 to $1.5 billion in 2013. JP Morgan Chase last year sold its physical commodity assets, including warehouses. Morgan Stanley has sold its oil shipping and pipeline businesses and wants to unload its oil trading and storage operations.

Jefferies, the investment bank piece of Leucadia National Corp., is selling its Bache commodities and financial derivatives business that it bought from Prudential Financial in 2011 for $430 million. But the buyer, Societe Generale, is only taking Bache’s top 300 clients by revenue while leaving thousands of small accounts, and paying only a nominal sum. Bache had operating losses for its four years under Jefferies ownership.

Grains and other agricultural products recently have gone through similar but shorter cycles than basic industrial commodities. Bad weather three years ago pushed up grain prices, which spawned supply increases as farmers increased plantings. Then followed, as the night the day, good weather, excess supply and price collapses. Pork and beef production and prices have similar but longer cycles due to the longer breeding cycles of animals.

Sugar prices have also nosedived in recent years (Chart 3). Cane sugar can be grown in a wide number of tropical and subtropical locations and supply can be expanded quickly. Like other Latin American countries, Brazil – the world's largest sugar producer – enjoyed the inflow of money generated from the Fed’s quantitative easing. But that ended last year and in combination with falling commodity prices, those countries’ currencies are plummeting (Chart 4). So Brazilian producers are pushing exports to make up for lower dollar revenues as prices fall, even though they receive more reals, the Brazilian currency that has fallen 33% vs. the buck in the last year since sugar is globally priced in dollars.


Oil Prices


Crude oil prices started to decline last summer, but most observers weren’t aware that petroleum and other commodity prices were falling until oil collapsed late in the year. With slow global economic growth and increasing conservation measures, energy demand growth has been weak. At the same time, output is climbing, especially due to U.S. hydraulic fracking and horizontal drilling. So the price of West Texas Intermediate crude was already down 31% from its peak, to $74 per barrel by late November.

Cartels are set up to keep prices above equilibrium. That encourages cheating as cartel members exceed their quotas and outsiders hype output. So the role of the cartel leader – in this case, the Saudis – is to accommodate the cheaters by cutting its own output to keep prices from falling. But the Saudis have seen their past cutbacks result in market share losses as other OPEC and non-OPEC producers increased their output. In the last decade, OPEC oil production has been essentially flat, with all the global growth going to non-OPEC producers, especially American frackers (Chart 5). As a result, OPEC now accounts for about a third of global production, down from 50% in 1979.


So the Saudis, backed by other Persian Gulf oil producers with sizable financial resources – Kuwait, Qatar and the United Arab Emirates – embarked on a game of chicken with the cheaters. On Nov. 27 of last year, while Americans were enjoying their Thanksgiving turkeys, OPEC announced that it would not cut output, and they have actually increased it since then. Oil prices went off the cliff and have dropped sharply before the rebound that appears to be temporary. On June 5, OPEC essentially reconfirmed its decision to let its members pump all the oil they like.

The Saudis figured they can stand low prices for longer than their financially-weaker competitors who will have to cut production first. That list includes non-friends of the Saudis such as Iran and Iraq, which they believe is controlled by Iran, as well as Russia, which opposes the Saudis in Syria. Low prices will also aid their friends, including Egypt and Pakistan, who can cut expensive domestic energy subsidies.

The Saudis and their Persian Gulf allies as well as Iraq also don’t plan to cut output if the West's agreement with Iran over its nuclear program lifts the embargo on Iranian oil. As much as another million barrels per day could then enter the market on top of the current excess supply of two million barrels a day.

The Chicken-Out Price


What is the price at which major producers chicken out and slash output? It isn’t the price needed to balance oil-producer budgets, which run from $47 per barrel in Kuwait to $215 per barrel in Libya (Chart 6). Furthermore, the chicken out price isn’t the “full cycle” or average cost of production, which for 80% of new U.S. shale oil production is around $69 per barrel.


Fracker EOG Resources believes that at $40 per barrel, it can still make a 10% profit in North Dakota as well as South and West Texas. Conoco Phillips estimates full cycle fracking costs at $40 per barrel. Long run costs in the Middle East are about $10 per barrel or less (Chart 7).


In a price war, the chicken out point is the marginal cost of production – the additional costs after the wells are drilled and the pipelines laid – it’s the price at which the cash flow for an additional barrel falls to zero. Wood Mackenzie’s survey of 2,222 oil fields globally found that at $40 per barrel, only 1.6% had negative cash flow. Saudi oil minister Ali al-Naimi said even $20 per barrel is “irrelevant.”

We understand the marginal cost for efficient U.S. shale oil producers is about $10 to $20 per barrel in the Permian Basin in Texas and about the same on average for oil produced in the Persian Gulf. Furthermore, financially troubled countries like Russia that desperately need the revenue from oil exports to service foreign debts and fund imports may well produce and export oil at prices below marginal costs – the same as we explained earlier for copper producers. And, as with copper, the lower the price, the more physical oil they need to produce and export to earn the same number of dollars.

Falling Costs


Elsewhere, oil output will no doubt rise in the next several years, adding to downward pressure on prices. U.S. crude oil output is estimated to rise over the next year from the current 9.6 million level. Sure, the drilling rig count fell until recently, but it’s the inefficient rigs – not the new horizontal rigs that are the backbone of fracking – that are being sidelined. Furthermore, the efficiency of drilling continues to leap. Texas Eagle Ford Shale now yields 719 barrels a day per well compared to 215 barrels daily in 2011. Also, Iraq’s recent deal with the Kurds means that 550,000 more barrels per day are entering the market. OPEC sees non-OPEC output rising by 3.4 million barrels a day by 2020.

Even if we’re wrong in predicting further big drops in oil prices, the upside potential is small. With all the leaping efficiency in fracking, the full-cycle cost of new wells continues to drop. Costs have already dropped 30% and are expected to fall another 20% in the next five years. Some new wells are being drilled but hydraulic fracturing is curtailed due to current prices. In effect, oil is being stored underground that can be recovered quickly later on if prices rise Closely regulated banks worry about sour energy loans, but private equity firms and other shadow banks are pouring money into energy development in hopes of higher prices later. Private equity outfits are likely to invest a record $21 billion in oil and gas start ups this year.

Earlier this year, many investors figured that the drop in oil prices to about $45 per barrel for West Texas Intermediate was the end of the selloff so they piled into new equity offerings (Chart 8), especially as oil prices rebounded to around $60. But with the subsequent price decline, the $15.87 billion investors paid for 47 follow-on offerings by U.S. and Canadian exploration and production companies this year were worth $1.41 billion less as of mid-July.


Dollar Effects


Commodity prices are dropping not only because of excess global supply but also because most major commodities are priced in dollars. So as the greenback leaps, raw materials are more expensive and therefore less desirable to overseas users as well as foreign investors. Investors worldwide rushed into commodities a decade ago as prices rose and many thought the Fed’s outpouring of QE and other money insured soaring inflation and leaping commodity prices as the classic hedge against it.

Many pension funds and other institutional investors came to view them as an investment class with prices destined to rise forever. In contrast, we continually said that commodities aren’t an investment class but a speculation, even though we continue to use them in the aggressive portfolios we manage.

We’ve written repeatedly that anyone who thinks that owning commodities is a great investment in the long run should study Chart 9, which traces the CRB broad commodity index in real terms since 1774. Notice that since the mid-1800s, it’s been steadily declining with temporary spikes caused by the Civil War, World Wars I and II and the 1970s oil crises that were soon retraced. The decline in the late 1800s is noteworthy in the face of huge commodity-consuming development then: In the U.S., the Industrial Revolution and railroad building were in full flower while forced industrialization was paramount in Japan.


At present, however, investors are fleeing commodities in favor of the dollar, Treasury bonds and other more profitable investments. Gold is among the shunned investments, and hedge funds are on balance negative on the yellow metal for the first time, according to records going back to 2006. Meanwhile, individual investors have yanked $3 billion out of precious metals funds.

Commodity Price Outlook

Commodity prices are under pressure from a number of forces that seem likely to persist for some time.

1. Sluggish global demand due to continuing slow economic growth.
2. Huge supplies of minerals and other commodities due to robust investment a decade ago.
3. Chicken games being played by major producers in the hope that pushing prices down with increasing supply will force weaker producers to scale back. This is true of the Saudis in oil and hard rock miners in iron ore.
4. Developing country commodity exporters’ needs for foreign exchange to service foreign debt. So the lower the prices, the more physical commodities they export to achieve the same dollars in revenue. This further depresses prices, leading to increased exports, etc. Copper is a prime example.
5. Increased production to offset the effects on revenues from lower prices, which further depresses prices, etc. This is the case with Brazilian sugar producers.
6. The robust dollar, which pushes up prices in foreign currency terms for the many commodities priced in dollar terms. That reduces demand, further depressing prices.

It’s obviously next to impossible to quantify the effects of all these negative effects on commodity prices. The aggregate CRB index is already down 57% from its July 2008 pinnacle and 45% since the more recent decline commenced in April 2011. To reach the February 1998 low of the last two decades, it would need to drop 43% from the late July level, but there’s nothing sacred about that 1998 number.

In any event, ongoing declines in global commodity prices will probably renew the deflation evidence and fears that were prevalent throughout the world early this year. And they might prove sufficient to deter the Fed from its plans to raise interest rates before the end of the year.

Like Outside the Box? Sign up here today and get each new issue delivered free to your inbox.
It's your opportunity to get the news John Mauldin thinks matters most to your finances.

The article Outside the Box: Commodity Weakness Persists was originally published at mauldineconomics.com.


Get our latest FREE eBook "Understanding Options"....Just Click Here!

Monday, July 7, 2014

Gold Option Trade – Will Gold Continue to Consolidate?

Until recently, the world has forgotten about gold and gold futures prices it would seem. A few years ago, all we heard about was gold and silver futures making new highs on the back of the Federal Reserve’s constant money printing schemes.

However, after a dramatic sell off the world of precious metals it became very quiet.


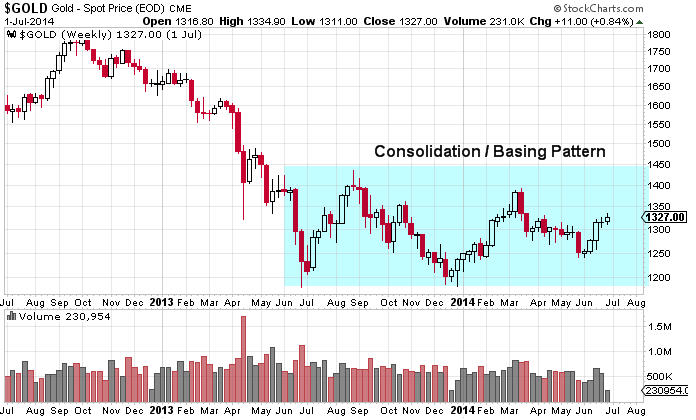
Gold prices have been in a giant basing or consolidation pattern for more than one year. As can clearly be seen below, gold futures prices have traded in a range between roughly 1,175 and 1,430 since June of 2013.


Chart1


The past few weeks we have heard more about gold prices as we have seen a five week rally since late May. I would also draw your attention to the fact that gold futures also made a slightly higher low which is typically a bullish signal.


At this point in time, it appears quite likely that a possible test of the upper end of the channel is possible in the next few weeks / months. If price can push above 1,430 on the spot gold futures price a breakout could transpire that could see $150 or more added to the spot gold price.


Clearly there are a variety of ways that a trader could consider higher prices in gold futures. However, a basic option strategy can pay handsome rewards that will profit from a continued consolidation. The trade strategy is profitable as long as price stays within a range for a specified period of time. Ultimately this type of trade strategy involves the use of options and capitalizes on the passage of time.


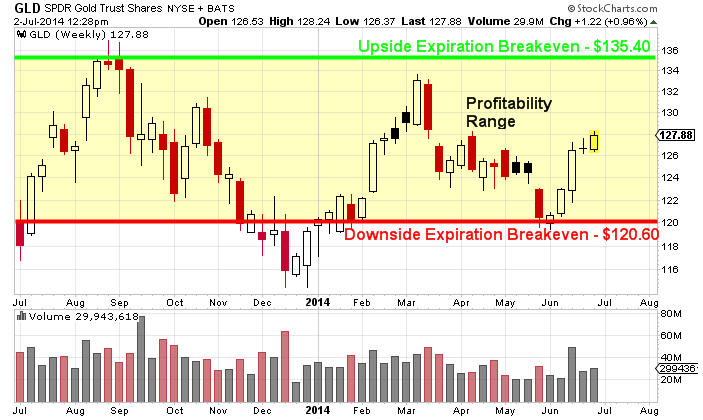
The strategy is called an Iron Condor Strategy, however in order to make this trade worth while we would consider widening out the strikes to increase our profitability while simultaneously increasing our overall risk per spread. Consider the chart of GLD below which has highlighted the price range that would be profitable to the August monthly option expiration on August 15th.


Chart2


As long as price stays in the range shown above, the GLD August Iron Condor Spread would be profitable. Clearly this strategy involves patience and the expectation that gold prices will continue to consolidate. This trade has the profit potential of $37 per spread, or a total potential return based on maximum possible risk of 13.62%. The probability based on today's implied volatility in GLD options for this spread to be profitable at expiration (August 15) is roughly 80%.


Our new option service specializes in identifying these types of consolidation setups and helps investors capitalize on consolidating chart patterns, volatility collapse, and profiting from the passage of time. And if you Advanced options trades are not your thing, we also provide Simple options where we buy either a call or put option based on the SP500 and VIX. The nice thing about buying calls and puts is that you can trade with an account as little as $2,500.


If You Want Daily Options Trades, Join the Technical Traders Options Alerts

See you in the markets!

Chris Vermeulen

Sign up for our next free trading webinar "Low VIX and What It Means to Your Trading"