A very interesting price pattern is setting up in the financial sector that could lead to a very big move in the US & Global markets. Remember how in 2008-09, the Financial sector and Insurance sector were some of the biggest hit stock sectors to prompt a global market crisis? Well, the next few weeks and months for the financial sector are setting up to be critical for our future expectations of the US stock market and global economy.
Right now, many of the financial sector stocks are poised near an upper price channel that must be breached/broken before any further upside price advance can take place. The current trend has been bullish as prices have rallied off the December 2018 lows. Yet, we are acutely aware of the bigger price channels that could become critical to our future decision making. If there is any price weakness near these upper price channel levels and any downside price rotation, the downside potential for the price is massive and could lead to bigger concerns.
Let’s start off by taking a look at these Monthly charts…
This first Monthly Bank Of America chart is best at showing the price channel (in YELLOW) as well as a key Fibonacci price level (highlighted by the MAGENTA line). We’ve also highlighted a price zone with a green shaded box that we believe is key support/resistance for the current price trend.
As you can see from this chart, since early February 2018, the overall trend has shifted into a sideways bearish trend. The price recovery from December 2018 was impressive, yes, but it is still rotating within this sideways/bearish price channel. Our belief is that this YELLOW upper price channel level MUST be broken in order for the price to continue higher at this point. Any failure to accomplish this will result in a price reversal that could precipitate a 30% price decline in the value of BAC. In other words, “it is do-or-die time – again”.
This Monthly JPM chart shows a similar pattern, yet the price channel is a bit more narrow visually. We have almost the same setup in JPM as we do in BAC. The same channels, the same type of Fibonacci price support level, the same type of sideways price support zone (the shaded box) and the same overall setup. As traders, we have to watch for these types of setup and be aware of the risks that could unfold with a collapse of the financial sector over the next few weeks.
We believe the next few weeks could be critical for the financial sector and for the overall markets. If weakness hits the financial sector as global growth continues to stagnate we could enter a period where the global perception of the future 12~24 months may change. Right now, perception has been relatively optimistic in the global stock markets. Most traders have been optimistic that the markets will recover and a US/China trade deal will get settled. The biggest concern has been the EU and the growth of the European countries.
What if that suddenly changed?
We are not saying it will or that we know anything special about this setup. We are just suggesting that the Monthly charts, above, are suggesting that price will either break above this upper price channel or fail to break this level and move lower. We are suggesting that, as skilled traders, we need to be acutely aware of the risks within the financial sector right now and prepare for either outcome.
This last chart, a Weekly FAS chart, shows a more detailed view of this same price rotation and sideways expanding wedge/channel formation. Pay very close attention to the shaded support channel shown with the GREEN BOX on this chart. Any price rotation within this level should be considered “within a support channel” and not a real risk initially. We want to see price break above the upper price channel fairly quickly, within the next 2 to 5+ weeks, and we can to see it establish a new high (above $78 on this chart) to confirm a new bullish price trend. Once this happens, we’ll be watching for further price rotation and setups. If it fails to happen, then the RED DOWN ARROW is the most likely outcome given the current price setup.
Any downside price move in the Financial sector would have to be associated with some decreased future expectations by investors. Thus, our bigger concern is that something is lurking just below the surface right now that could pull the floor out from under this sector. Is it a surprise Fed rate increase? Is it some news from the EU? Is it a sudden increase in credit defaults? What is the “other shoe” – so to say.
Be prepared. If all goes well, then we’ll know within a few more weeks if the upside price rally will continue or if we need to start digging for clues as to why the support for the financial sector is eroding. This really is a “do or die” setup in the financial sector and we urge all traders to pay very close attention to this sector going forward. We believe it will be the leading sector for any major price weakness across the global markets.
Do you want to find a team of dedicated researchers and traders that can help you find and execute better trades in 2019 and beyond? Please visit The Technical Traders to learn how we can help you prepare for the big moves in the global markets and find better opportunities for greater success in the future. Our team of researchers and traders continue to scan the markets for new trades and incredible research for all our members and followers.
Chris Vermeulen
Showing posts with label Bullish. Show all posts
Wednesday, April 17, 2019
Tuesday, January 8, 2019
How to Spot a Tradable Market Top
If you are a long term investor, swing trader, or day trader, then you could find one or all of the charts below interesting. What I am going to briefly cover and show you could make you think twice about how you are investing and trading your money. I will be the first to admit you should not, and cannot, always pick market tops or bottoms, but there are certain times when it’s worth betting on one.
Below I have shared three charts, each with a different time frame using daily, 30 minutes, and a 10-minute chart. Each chart also has a different technical analysis technique and strategy applied. Each shorter time frame chart as we work down the page zooms in closer to more imminent price action that should take place over the next few days.
The daily chart below shows a clear overall trend which is to the downside. Trends are more likely to continue than they are to reverse, hence the saying “The Trend Is Your Friend.”
A key piece of data on this chart is the blue investing cycle line at the bottom. If this is trending down or below the 50 level, then money should be focused on profiting from falling prices via inverse ETF’s, short selling, or put options.
Equally important are the yellow and baby blue cycle lines at the bottom. When these enter the upper reversal zone, we should expect sellers to step into the market and for the price to fall.
I apologize for the noisy chart below, a lot is going on there, but if you focus on the yellow text and drawings, it will help keep things simple. This chart shows several reasons why we expect the price to fall. Based on technical and statistical analysis this chart points weakness over the next 1 - 3 trading days.
Monday night (Jan 7th) after the closing bell the SPY ETF chart generated a sizable price spike to the downside. Those of you who follow our spikes and or at least know about these setups then you know we expect the price to reach at least one if not all spike targets which are 30%, 50%, and 100% of the spike within 36 hours.
So far in 2019 we have has six price spikes five winners, one loser which is an 83% win rate thus far. Today’s spike is abnormally large not sure what that means regarding this one being a success but it is another spike signal, and the odds favor a move down once you see the other analysis supporting this setup.
If you are boring long term investor and have been stuck having to ride the stock market roller coaster with your life savings my trading newsletter can help you with your long term portfolio to not only avoid losses but profit from the collapse with one simple inverse exchange traded fund which trades like a stock and you buy and sell it at anytime! Knowing when you put your nest egg to work, and when to back away and protect it is crucial if you want to become wealthy or become wealthy.
On the flip side, if you are an active trader looking for monthly trades then be sure to join the Wealth Building Newsletter today and receive my daily pre-market video analysis, so you understand what took place yesterday, during overnight trading, and what to expect when the market opens.
Subscribe today and become part of our trading community and prosper from the coming market correction and real estate downturn.
Sign Up for Chris Vermeulen's Wealth Building Newsletter Here > The Technical Traders
Below I have shared three charts, each with a different time frame using daily, 30 minutes, and a 10-minute chart. Each chart also has a different technical analysis technique and strategy applied. Each shorter time frame chart as we work down the page zooms in closer to more imminent price action that should take place over the next few days.
DAILY CHART SIGNALS MARKET TOP – INVESTING/SWING TRADING
The daily chart below shows a clear overall trend which is to the downside. Trends are more likely to continue than they are to reverse, hence the saying “The Trend Is Your Friend.”
A key piece of data on this chart is the blue investing cycle line at the bottom. If this is trending down or below the 50 level, then money should be focused on profiting from falling prices via inverse ETF’s, short selling, or put options.
Equally important are the yellow and baby blue cycle lines at the bottom. When these enter the upper reversal zone, we should expect sellers to step into the market and for the price to fall.
30 MINUTE CHART SIGNALS MARKET TOP – SWING/MOMENTUM TRADING
I apologize for the noisy chart below, a lot is going on there, but if you focus on the yellow text and drawings, it will help keep things simple. This chart shows several reasons why we expect the price to fall. Based on technical and statistical analysis this chart points weakness over the next 1 - 3 trading days.
10-MINUTE CHART SIGNALS MARKET TOP – MOMENTUM/DAY TRADING
Monday night (Jan 7th) after the closing bell the SPY ETF chart generated a sizable price spike to the downside. Those of you who follow our spikes and or at least know about these setups then you know we expect the price to reach at least one if not all spike targets which are 30%, 50%, and 100% of the spike within 36 hours.
So far in 2019 we have has six price spikes five winners, one loser which is an 83% win rate thus far. Today’s spike is abnormally large not sure what that means regarding this one being a success but it is another spike signal, and the odds favor a move down once you see the other analysis supporting this setup.
CONCLUSION
If you are boring long term investor and have been stuck having to ride the stock market roller coaster with your life savings my trading newsletter can help you with your long term portfolio to not only avoid losses but profit from the collapse with one simple inverse exchange traded fund which trades like a stock and you buy and sell it at anytime! Knowing when you put your nest egg to work, and when to back away and protect it is crucial if you want to become wealthy or become wealthy.
On the flip side, if you are an active trader looking for monthly trades then be sure to join the Wealth Building Newsletter today and receive my daily pre-market video analysis, so you understand what took place yesterday, during overnight trading, and what to expect when the market opens.
Subscribe today and become part of our trading community and prosper from the coming market correction and real estate downturn.
Sign Up for Chris Vermeulen's Wealth Building Newsletter Here > The Technical Traders
Labels:
bearish,
Bullish,
chart,
Chris Vermeulen,
momentum,
swing trade,
The Technical Traders
Friday, December 29, 2017
2018 First Quarter Technical Analysis Price Forecast
As 2017 draws to a close, our analysis shows the first Quarter of 2018 should start off with a solid rally. Our researchers use our proprietary modeling and technical analysis systems to assist our members with detailed market analysis and timing triggers from expected intraday price action to a multi-month outlook.
These tools help us to keep our members informed of market trends, reversals, and big moves. Today, we are going to share some of our predictive modelings with you to show you why we believe the first three months of 2018 should continue higher.
One of our most impressive and predictive modeling systems is the Adaptive Dynamic Learning system. This system allows us to ask the market what will be the highest possible outcome of recent trading activity projected into the future. It accomplishes this by identifying Genetic Price/Pattern markers in the past and recording them into a Genome Map of price activity and probable outcomes.
This way, when we ask it to show us what it thinks will be the highest probable outcome for the future, it looks into this Genome Map, finds the closest relative Genetic Price/Pattern marker and then shows us what this Genome marker predicts as the more likely outcome.
This current Weekly chart of the SPY is showing us that the next few Weeks and Months of price activity should produce a minimum of a $5 – $7 rally. This means that we could see a continued 2~5% rally in US Equities early in 2018.
Additionally, the ES (S&P E-mini futures) is confirming this move in early 2018 with its own predictive analysis. The ADL modeling system is showing us that the ES is likely to move +100 pts from current levels before the end of the first Quarter 2018 equating to a +3.5% move (or higher). We can see from this analysis that a period of congestion or consolidation is expected near the end of January or early February 2018 – which would be a great entry opportunity.
The trends for both of these charts is strongly Bullish and the current ADL price predictions allow investors to understand the opportunities and expectations for the first three months of 2018. Imagine being able to know or understand that a predictive modeling system can assist you in making decisions regarding the next two to three months as well as assist you in planning and protecting your investments? How powerful would that technology be to you?
Our job at Technical Traders Ltd. is to assist our members in finding and executing profitable trades and to assist them in understanding market trends, reversals, and key movers. We offer a variety of analysis types within our service to support any level of a trader from novice to expert, and short term to long term investors.
Our specialized modeling systems allow us to provide one of a kind research and details that are not available anywhere else. Our team of researchers and traders are dedicated to helping us all find great success with our trading.
So, now that you know what to expect from the SPY and ES for the next few months, do you want to know what is going to happen in Gold, Silver, Bonds, FANGs, the US Dollar, Bitcoin, and more?
Join The Technical Traders Right Here to gain this insight and knowledge today.
Chris Vermeulen
These tools help us to keep our members informed of market trends, reversals, and big moves. Today, we are going to share some of our predictive modelings with you to show you why we believe the first three months of 2018 should continue higher.
One of our most impressive and predictive modeling systems is the Adaptive Dynamic Learning system. This system allows us to ask the market what will be the highest possible outcome of recent trading activity projected into the future. It accomplishes this by identifying Genetic Price/Pattern markers in the past and recording them into a Genome Map of price activity and probable outcomes.
This way, when we ask it to show us what it thinks will be the highest probable outcome for the future, it looks into this Genome Map, finds the closest relative Genetic Price/Pattern marker and then shows us what this Genome marker predicts as the more likely outcome.
This current Weekly chart of the SPY is showing us that the next few Weeks and Months of price activity should produce a minimum of a $5 – $7 rally. This means that we could see a continued 2~5% rally in US Equities early in 2018.
Additionally, the ES (S&P E-mini futures) is confirming this move in early 2018 with its own predictive analysis. The ADL modeling system is showing us that the ES is likely to move +100 pts from current levels before the end of the first Quarter 2018 equating to a +3.5% move (or higher). We can see from this analysis that a period of congestion or consolidation is expected near the end of January or early February 2018 – which would be a great entry opportunity.
The trends for both of these charts is strongly Bullish and the current ADL price predictions allow investors to understand the opportunities and expectations for the first three months of 2018. Imagine being able to know or understand that a predictive modeling system can assist you in making decisions regarding the next two to three months as well as assist you in planning and protecting your investments? How powerful would that technology be to you?
Our job at Technical Traders Ltd. is to assist our members in finding and executing profitable trades and to assist them in understanding market trends, reversals, and key movers. We offer a variety of analysis types within our service to support any level of a trader from novice to expert, and short term to long term investors.
Our specialized modeling systems allow us to provide one of a kind research and details that are not available anywhere else. Our team of researchers and traders are dedicated to helping us all find great success with our trading.
So, now that you know what to expect from the SPY and ES for the next few months, do you want to know what is going to happen in Gold, Silver, Bonds, FANGs, the US Dollar, Bitcoin, and more?
Join The Technical Traders Right Here to gain this insight and knowledge today.
Chris Vermeulen
Friday, December 1, 2017
Capital Repositioning Driving Volatility Higher
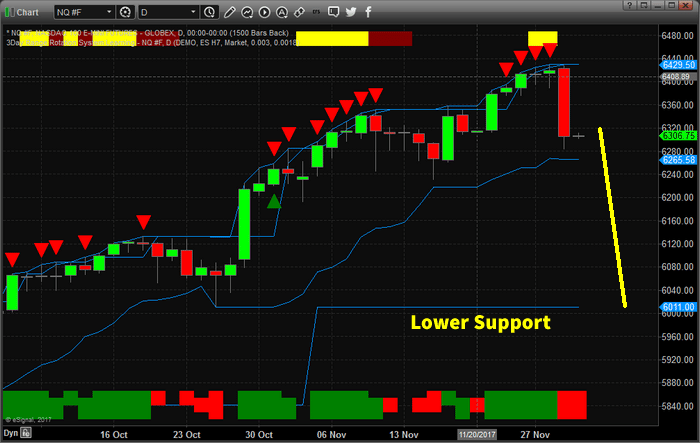
Recent moves in the FANG stocks shows that capital is starting to reposition within the global market. As the end of the year approaches, expect more of this type of capital control to drive greater volatility within the markets. At this time of year, especially after such a fantastic bullish run, it is not uncommon to see capital move out of high flying equities and into cash or other investments.
The recent move lower in the NQ has taken many by surprise, but the bullish run in the FANG stocks has been tremendous. Facebook was higher +59% for 2017 (600% 2016 levels). Amazon was up +61% for 2017 (550% 2016 levels). Netflix was up +64.75% for 2017 (600% 2016 levels) and Google was higher by +37% for 2017 (1000% 2016 levels). These are huge increases in capital valuation.
In early 2017, we authored an article about how capital works and always seeks out the best returns in any environment. It was obvious from the moves this year that capital rushed into the US markets with the President Trump’s win and is now concerned that the end of the year may be cause to pull away from the current environment.
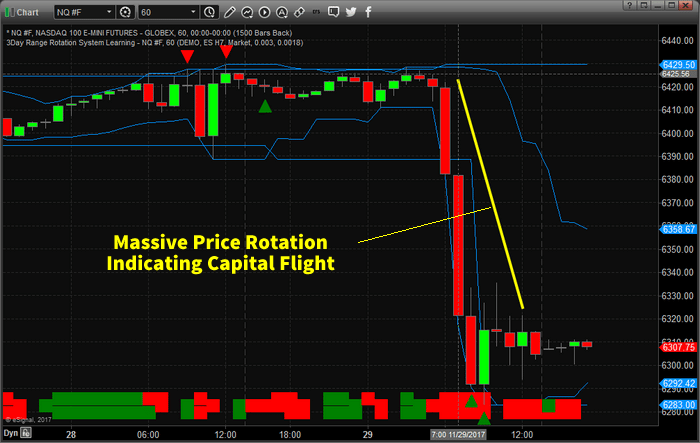
The current decline in the NQ, -2.25% so far, is not a huge decline in price yet. Lower price support is found near the $6000 level. Should this “Price Flight” continue in the NASDAQ, we could be looking at a 6~8% decline, or greater, going into the end of this year.

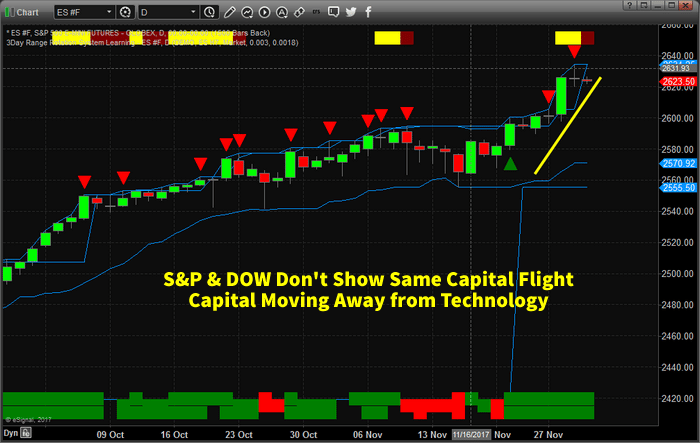
The price swing, this week, was very fast and aggressive. In terms of capital, this was a massive price rotation away from Technology. While the S&P and DOW Industrials continue higher, this presents a cause for concern with regards to the end of year expectations.

Will capital continue to rush into the US markets and specifically Technology stocks? Or will capital rush out of these equities and into other sources of “safety” as technology melts down into the end of 2017? Has the 40~60%+ price rally of 2017 been enough for investors to take their profits and run?

It is quite possible that capital will move to the sidelines through the end of this year and reenter the markets early next year as investors find a better footing for the markets. The facts are, currently, that financials and transportation seem to be doing much better than the FANG stocks. If this continues, we could be looking at a broader shift in the global markets – almost like a second technology bubble burst.
If you want to learn more about how we can assist you with your investment needs, visit The Technical Traders Here to learn more. Our researchers are dedicated to assisting you and in helping you learn to profit from these moves. 2018 is certain to be a dynamic trading year – so don’t miss out.
Labels:
Amazon,
Bullish,
capital,
equities,
Gas,
investment,
NASDAQ,
Oil,
President Trump,
profit,
Technology,
trading
Wednesday, February 15, 2017
Why It Feels Like the Dot Com Bubble All Over Again
By Justin Spittler
Today, we’re going to do something different. As you can imagine, we hear from our readers a lot. Some of them have nice things to say. Others…not so much. Most importantly, though, we get a lot of questions. Last week, we received a question that was so important, we’re dedicating this entire issue to it. This question might be something you’re wondering yourself…and it could have a huge impact on your money.It comes from Joseph J., a subscriber to The Casey Report:
I read today’s newsletter (Trump Should Be Careful What He Wishes For) with great interest. In it you stated that “U.S. stocks are incredibly expensive…” But my question is: Based against what? We are in uncharted territory, and every single newsletter writer that I have asked this question of has failed to provide an answer. Perhaps you will be different.Thank you for putting us in the hot seat, Joseph. Lucky for us, we didn’t make this claim lightly. We have plenty of facts to back it up. Before we show you the proof, you have to realize something: There are many different ways to value stocks. Everyone has their preference. A lot of folks use the price-to-earnings (P/E) ratio. Other investors look at a company’s book value or cash flow.
We prefer to use the cyclically adjusted price-to-earnings (CAPE) ratio.…
This ratio is the cousin of the popular P/E ratio. The only difference is that it uses 10 years’ worth of earnings instead of just the previous year’s. This smooths out the up and downs of the business cycle. It gives us a long-term view of the market. Right now, the CAPE ratio for companies in the S&P 500 is 28.4. That’s 70% higher than its historical average. U.S. stocks haven’t been this expensive since the dot com bubble.

This isn’t a good sign. As you may remember, the S&P 500 fell 41% from 2000–2002. The Nasdaq plunged 78% over the same period.
But the CAPE ratio is just one way to value stocks.…
To prove we’re not cherry picking, let’s look at some other metrics. First up, the price-to-sales (P/S) ratio. This ratio is just like the P/E ratio, but it uses the previous year’s sales instead of earnings. According to credit rating agency Standard & Poor’s, the S&P 500 currently trades at 2.02 times sales. That’s 40% higher than its historical average, and the highest level since at least 2000. Clearly, U.S. stocks are more expensive than normal. But that’s not even the main reason investors are nervous about them.
U.S. stocks seem to have lost touch with reality.…
As we all know, the stock market allows investors to own a piece of publicly traded companies. Most of the companies on the NYSE (New York Stock Exchange) are U.S. companies. Because of this, you would think the stock market would generally follow the health of the economy. If the economy’s booming, stocks should be soaring. If the economy’s struggling, stocks should be, too. That hasn’t been the case lately.
Since 2009, the S&P 500 has surged 239% to record highs. That makes this one of the strongest bull markets in U.S. history. During that same span, the U.S. economy has grown just 2% per year. That makes the current “recovery” one of the weakest since World War II. In short, Main Street hasn’t kept up with Wall Street.
The U.S. stock market is now clearly in “bubble territory”.…
Just look at the chart below. This chart compares the value of the U.S. stock market with the nation’s gross domestic income (GDI). GDI is like gross domestic product (GDP), but instead of measuring how much money a country spends, it measures how much money a country earns. It counts things like wages, corporate profits, and tax receipts. A high ratio means stocks are expensive relative to how much money an economy makes. You can see in the chart below that this key ratio is well above its housing bubble high. It’s now approaching the record high it hit during the dot-com bubble.

This is another serious red flag.…
But it doesn't mean stocks are going to crash next month, or next year. For this bubble to pop, something will have to prick it. We’re not sure what that will be…where it will come from…or when it will happen…
But we do know stocks don’t go up forever. Sooner or later, this bubble is going to end. When it does, many investors are going to take huge losses. Years’ worth of returns could disappear in a matter of months, even weeks.
The good news is that you can still crisis-proof your portfolio. Here are three ways to get started:
-
Set aside more cash. Holding extra cash will help you avoid big losses if stocks fall. It will also put you in a position to buy stocks when they get cheaper.
-
Own physical gold. Gold is the ultimate safe-haven asset. It’s survived every financial crisis in history. It will certainly survive the next one.
-
Close your weakest positions. Start by selling your most expensive stocks. They tend to fall the hardest during major selloffs. You should also get rid of companies that need cheap debt to make money. If problems in the bond market continue, these companies could be in trouble.
Chart of the Day
Miners are rallying again. Today’s chart shows the performance of the S&P/TSX Global Mining Index. This index tracks the performance of companies that mine commodities like gold, silver, aluminum, and copper. You can see that this index skyrocketed at the beginning of last year. It nearly doubled between January and July. Then, it went almost nowhere for six months.Three weeks ago, the S&P/TSX Global Mining Index broke out of this sideways trading pattern. It’s now trading at its highest level since early 2015. This is very bullish. It tells us that mining stocks may have just entered a new phase of a bull market. If you’ve been thinking about buying mining stocks, now might be a good time to get in. But don’t worry if you don’t know what to buy.
We recently put together a presentation that talks about one of the richest gold deposits in the world. Our top gold analyst has never seen anything like this in his career. Early investors in the company that owns this deposit could make 1,000% or more. But this opportunity won’t last long. Just two months from now, this world-class mine will “go live.” When it does, this company’s stock should shoot through the roof. For more details on this incredible opportunity, click here.

The article Why It Feels Like the Dot-Com Bubble All Over Again was originally published at caseyresearch.com.
Friday, August 21, 2015
Riding the Energy Wave to the Future
By John Mauldin
“Formula for success: rise early, work hard, strike oil.” – J. Paul Getty
Today I’ll tell you about some big shifts in the energy industry. These shifts are about as positive as can be, unless you need high oil prices to run your country. In the long run, these changes are bullish for the whole world, which I think this will surprise many of you. And though we’ve been used to thinking about energy and technology as two different facets of modern life, today they are inextricably linked.
When energy changes, everything else changes, too.
16 Candles
Thoughts from the Frontline is now entering its 16th year of continuous weekly publication. I constantly meet readers who have been with me since the beginning – and even some who read an earlier print version of my letters. I put TFTF on the Internet in August 2000 as a free letter, starting with just a few thousand names, and was amazed at how rapidly it grew. It took just a few years for me to realize that this new thing called the Internet was the real deal, and I discontinued my print version. We now push the letter out to almost one million readers each week, and the letter is posted on dozens of websites.
I began to archive the letter in January 2001; and every issue – the good, the bad, and the sometimes very ugly – is still there in the archives, just as I wrote it. I will admit there are a few paragraphs, and maybe even a whole letter or two, that I would like to go back and expunge from the record. But I think it’s better just to let it all be what it is.
Investing in energy without the risk....Here's what our trading partner John Carter is doing.
I thank you for allowing me to come into your homes and offices each week. I consider it a privilege and honor to be able to offer you my research and thoughts. This letter has been free from the beginning, and my full intent is that it will always remain that way. Longtime readers know the topics can vary widely over the course of the year. I write about what I find interesting that week. I find that writing helps me focus my own thinking.
If you are reading this for the first time, you can go to www.mauldineconomics.com, subscribe by giving us your email address, and join my one million closest friends who get my letter each week. And if you’re a regular reader, why not give me a 16th birthday present and suggest to your friends that they subscribe too! I also want to thank the staff and my partners, who make it possible for me to spend the bulk of my time thinking and writing. And traveling, of course. And now let’s think about energy.
The Cover Pic Indicator
Contrarian and value investors like to buy assets that are in distress, or at least “out of favor.” You don’t hear much about those assets at the time. That’s part of being distressed – everyone ignores you. So, following that logic, the last thing you want to buy is a stock or industry that appears on the cover page of popular financial publications. Commodity and energy bulls should take note of last weekend’s Barron’s cover.
“COMMODITIES: TIME TO BUY,” Barron’s practically screamed at its readers. In case you can’t read the fine print on the cover, it says, The harsh selloff in energy, gold, and other commodities is starting to look like capitulation. Opportunities in Exxon, Chevron, BHP, Goldcorp. Plus six funds and six ETFs to help build a position in this oversold sector.
I presume the photo is supposed to show the sun rising on an oil rig, not setting. The article quotes some very smart people who are bullish on commodities right now. Some energy stocks look like real bargains. Barron’s is simply repeating the market’s conventional wisdom: After a brutal decline, oil prices are stabilizing and should head higher as the global economy recovers.
That’s a perfectly defensible position – but I think it’s wrong.
It’s wrong because it misses a major shift in the way we produce energy. Many people think OPEC’s high oil and gas prices led to the US shale energy boom. That’s not right. The shale boom was born in a time of lower energy prices, and it was the result of new technologies that make recovering large quantities of oil and gas less expensive than ever.
I used to get the occasional letter from James Howard Kunstler, who would tell me that whatever letter I had just written was completely bass-ackwards, and how his books explained that we were going to run out of energy and then collapse. His books (Wikipedia lists about a dozen) and dozens of others warned us of Peak Oil. (For the record, James, a certain longtime editor on my staff made sure I got all your letters, reports, and more, as he is firmly in your camp! I kept smiling and saying that he was (and is) wrong; but Charley is a phenomenal editor, and you put up with a few quirks for brilliant editing that makes you look better. Besides, if the world does come to an end, I can wend my way to his survivalist farm and beg for a job and food, although I’m not exactly sure I’m ready to milk goats. Just for old time’s sake.)
I have written for years that Peak Oil is nonsense. Longtime readers know that I’m a believer in ever-accelerating technological transformation, but I have to admit I did not see the exponential transformation of the drilling business as it is currently unfolding. The changes are truly breathtaking and have gone largely unnoticed.
By now, you probably know about fracking, the technology where drillers pump liquids into a well to “fracture” the ground and release oil and gas deposits. It’s controversial in certain quarters, especially among those who hate anything carbon-related.
Fracking technology is moving forward like all other technologies: very fast. Newer techniques promise to reduce the side effects, at even lower operating costs. Furthermore, fracking is only the beginning of this revolution. The Manhattan Institute recently published an excellent (bordering on brilliant) report by Mark P. Mills, Shale 2.0: Technology and the Coming Big Data Revolution in America’s Shale Oil Fields. I highly recommend it.
Mills outlines the way the new technologies are turning this industry on its head. Shale production or “unconventional” production is really a completely new industry.
Here is a short quote: The price and availability of oil (and natural gas) are determined by three interlocking variables: politics, money, and technology. Hydrocarbons have existed in enormous quantities for millennia across the planet. Governments control land access and business freedoms. Access to capital and the nature of fiscal policy are also critical determinants of commerce, especially for capital-intensive industries. But were it not for technology, oil and natural gas would not flow, and the associated growth that these resources fuel would not materialize.
While the conventional and so-called unconventional (i.e., shale) oil industries display clear similarities in basic mechanics and operations – drills, pipes, and pumps – most of the conventional equipment, methods, and materials were not designed or optimized for the new techniques and challenges needed in shale production. By innovatively applying old and new technologies, shale operators propelled a stunningly fast gain in the productivity of shale rigs (Figure 4), with costs per rig stable or declining.
[Look at the above chart for a few moments; it’s truly staggering. In just seven years, the amount of oil per well in some shale plays has risen by a factor of 10! That is almost all due to new technologies that are increasingly coming online.]
Shale companies now produce more oil with two rigs than they did just a few years ago with three rigs, sometimes even spending less overall. At $55 per barrel, at least one of the big players in the Texas Eagle Ford shale reports a 70 percent financial rate of return. If world prices rise slightly, to $65 per barrel, some of the more efficient shale oil operators today would enjoy a higher rate of return than when oil stood at $95 per barrel in 2012.
To continue reading this article from Thoughts from the Frontline – a free weekly publication by John Mauldin, renowned financial expert, best selling author, and Chairman of Mauldin Economics – please click here.
The article Thoughts from the Frontline: Riding the Energy Wave to the Future was originally published at mauldineconomics.com.
Get our latest FREE eBook "Understanding Options"....Just Click Here!
Labels:
Barron's,
Bullish,
Bulls,
contrarian,
Doug Casey,
economy,
energy,
ETF's,
financial,
Oil,
OPEC,
shale,
Thoughts from the Frontline
Thursday, August 20, 2015
This “Pig” Just Made a Massive Bet on Gold
By Dan Steinhart
Stan Druckenmiller is going big on gold.Druckenmiller is one of the world’s most successful and respected traders. As a hedge fund manager from 1986 to 2010, he generated an incredible average annual return of 30%. Druckenmiller was also George Soros’s right hand man at Quantum, Soros’s famed hedge fund. Quantum’s now legendary 1992 trade shorting the British pound was Druckenmiller’s idea. It made Quantum about $1 billion. People say the trade “broke the Bank of England.”
Most professional investors preach diversification. But Druckenmiller says he’s successful because he’s not afraid to concentrate his bets when he really believes in a trade. He calls it “being a pig.” The first thing I heard when I got in the business, not from my mentor, was bulls make money, bears make money, and pigs get slaughtered.
I’m here to tell you I was a pig. And I strongly believe the only way to make long-term returns in our business that are superior is by being a pig. I think diversification and all the stuff they’re teaching at business school today is probably the most misguided concept everywhere.
Druckenmiller’s fund recently bought $300 million worth of SPDR Gold Trust (GLD), an ETF that tracks the price of gold. It’s a huge bet, even for a big time trader like Druckenmiller. He put 20% of his fund’s money into this trade, and it’s his largest position. Druckenmiller seems to like gold for the same reasons Casey Research likes gold. He has harshly criticized the Federal Reserve for creating the frothy conditions that led to the 2008 financial crisis. And he says the Fed’s policies today are more reckless today than ever.
If you look at the real root cause behind the financial crisis, we’re doubling down. Our monetary policy is so much more reckless and so much more aggressively pushing the people in this room and everybody else out the risk curve that we’re doubling down on the same policy that really put us there…..The Fed cut interest rates to nearly zero after the financial crisis. This has encouraged all kinds of bad investing and reckless speculation. When the banks pay microscopic interest rates, people get desperate and pile into junk bonds, stocks, and real estate. This drives asset prices higher and higher.....which creates a lot of danger.
It also leads to depreciating paper currencies…which will eventually lead to much higher gold prices. In just the last year, the Japanese yen has dropped 18% versus the US dollar. The euro has dropped 17%...the Australian dollar has dropped 20%...and the Canadian dollar has dropped 17%. Regular readers know this is part of the “Currency Wars.” Governments are devaluing their currencies in an attempt to stoke their economies. Politicians think that making a currency cheaper (usually by printing more currency units) will provide an economic stimulus.It doesn’t work. If devaluing currencies were the path to prosperity, countries like Zimbabwe and Venezuela would be the richest countries on Earth…instead of economic basket cases.
Gold has been struggling....…
The price of gold has fallen 41% since hitting an all time high in August 2011. Druckenmiller’s huge bet indicates that he thinks the bottom is finally in. Druckenmiller has made a career out of getting big calls like this correct. We wouldn’t want to bet against him.
If you agree that gold is near its bottom, you could buy physical gold or shares of GLD like Druckenmiller. That could easily give you a 50-to-75% gain in the coming years. If you want a chance at much bigger gains, consider investing in gold stocks. Gold stocks are highly leveraged to the price of gold. In a bull market, gold stocks rise much more than the price of gold. It’s common for the best run gold companies to increase by 20-to-1 or even 30-to-1 during a gold bull market.
International Speculator is our advisory focused on the best small gold stocks with huge upside potential. Right now, gold stocks look like they’re near the end of one of the worst bear markets in history. In fact, gold stocks are cheaper today than they’ve been in at least twenty years…as we’ll show you in a moment.
International Speculator will teach you how to position yourself in the best gold stocks before the next bull market begins.
Click here to read more about the opportunity we have to buy gold stocks today… at prices we probably won’t see again for another twenty years once the bull gets going.
The article This “Pig” Just Made a Massive Bet on Gold was originally published at caseyresearch.com.
Get our latest FREE eBook "Understanding Options"....Just Click Here!
Tuesday, August 11, 2015
The Next Silver Bull May Have Already Started
By Laurynas Vegys
Silver is down 7.1% this year. Will this weakness persist? To find out, let’s look at the key factors in the silver market this year.- Like gold, silver fell as the US dollar rose on the back of expectations that the Fed will hike rates.
- World demand for physical silver fell 4% in 2014, largely due to a record 19.5% drop in investment demand.
- Silver exchange traded funds (ETFs) did not see big liquidations in 2014. ETF holdings grew by 1.4 million ounces and recorded their highest year end level at 636 million ounces.
Why did miners produce more silver when prices were falling? Because of:
- By-product metal. Around 75% of the silver mined is a by-product at gold or base metal mines. These producers will keep mining silver, almost regardless of price.
- Reduced cash costs. The primary silver producers have cut costs since they peaked in 2012. The main way miners do that is by boosting production to achieve economies of scale.
- Bull market hangover. Precious metals were in a major bull market from 2001 to 2011. Producers built a lot of mines in response. Nobody wants to pull the plug on a new mine that’s losing money if they think prices will go higher.
Supply
Demand
There was a big drop in investment demand last year: 19.5%. This tells us that most short-term investors and sellers have left the market. We don’t know any “silver bugs” who were selling. That means that today’s bullion is in stronger hands. And that means that any new buying will have a strong impact on prices.
But will there be buyers?
The Silver Institute expects more silver demand from investors this year. They say that the first half of 2015 sales of silver bars were the fifth highest on record.
Photovoltaics (PV) is another source of silver demand that many analysts expect to rise in 2015 and beyond. Global PV demand is set to increase by 30% in 2015, according to IHS analysts. China alone has plans to install 17 gigawatts of solar capacity by the end of the year.
The solar industry consumes a small amount of silver compared to jewelry and other electronics. Yet, if PV demand delivers in 2015, it will become the third-largest source of fabrication demand for silver.
Wildcard: Tesla plans to put batteries big enough to power a house in every home. What happens if that takes root is anyone’s guess… but it will be big. Really big. And the impact on demand for silver would be just as huge.
The Deficit
The Dollar and the Fed
Many investors seem convinced that the Fed will raise interest as soon as September. We view this as unlikely at this stage. Yes, tightening US monetary policy would propel the dollar to new highs. But an even stronger dollar would mean slicing billions off the US GDP; not exactly a desirable situation from the standpoint of the Fed given the sluggish growth of the economy. We think the Fed could delay raising rates until 2016. It might even stop talking about rate hikes indefinitely. Each delay, the dollar will get whacked, and that’s good for precious metals.
On the other hand, if the Fed does nudge rates higher this year, it would likely dampen the stock market. That would increase demand for silver and gold. This could push silver prices much higher, given the small size of the market.
The Gold-Silver Ratio
Silver is about 17 times more abundant than gold in the earth’s crust. Silver and gold prices were close to this ratio for most of history. These facts make many investors think that the GSR should be 17-to-1 and that eventually it will be.
They may be right, but we’ve never found the GSR to be a strong predictor of gold or silver prices. To us, the GSR “suggests a lot but proves nothing.”
Conclusion
As for guessing the future, we have no crystal ball. We can say that Louis’ case for 2015 as a win-win year for silver is backed by the numbers.
P.S. If silver moves off its current level of $15 and into the $20 or $30 areas, silver investors could make large gains. But owners of a unique silver-related security could make gains that are five... 10... even 100 times greater. And right now is a once-in-a-decade chance to buy them very, very cheap.
Our friends at Casey Research are the world’s leading experts in this sector. And they’re EXTREMELY bullish on this rare opportunity. Read on here for details.
The article The Next Silver Bull May Have Already Started was originally published at caseyresearch.com.
Get our latest FREE eBook "Understanding Options"....Just Click Here!
Thursday, November 13, 2014
Connecting the Dots: Not Yet Time to Celebrate a Market Turnaround
By Tony Sagami
The Wall Street crowd liked what they heard last week and pushed the Dow Jones to a new high. In particular, the trio of the Republican landslide victory, an overall positive Q3 earning season, and a good jobs report that showed unemployment dropping to 5.8% was behind the rally.
And what a rally it was. Since the start of earnings season on October 8, the S&P 500 has increased by 3% and has bounced by an eye popping 9.1% from the October 15 low. Many of my peers have already popped the champagne and drunkenly declared a coast-is-clear resumption of the great bull market.
Not so fast. There was a trio of negative news pieces last week that tells me there is more to be worried about than there is to celebrate.
“V” Is for Vulnerable… Not Victory
Instead of being encouraged by the 9% moonshot since the October 15 low, I am even more skeptical. The S&P 500 shot up by 220 points in just three weeks, which tells me that the rubber band of stock market psychology is overstretched.
The stock market’s massive mood swing from fear to greed can change just as quickly to the other direction. Sharp trend reversals followed by sharp rebounds is not a kind of bottom building behavior.
The rally has been accomplished with low trading volume—a classic definition of an unsustainable bounce because it shows that the rally was more from a lack of sellers rather than an abundance of buyers.
And don’t forget about the drastic underperformance of small stocks. The Russell 2000 is up less than 1% for the year compared to 11% for the Nasdaq and 10% for the S&P 500.
Earnings: Look Ahead, Not Behind
Impressive, right? Not so fast!
When it comes to earnings, you need to be looking through the front-view windshield and not the rear-view mirror.
Even the perpetually bullish analytical community is getting worried. The average estimates for Q4 earnings as well as Q1 2015 are being downwardly adjusted. Since October 1:
- Q4 earnings growth have been lowered from 11.1% to 7.6%;and
- Q1 2015 earnings growth has been chopped from 11.5% to 8.8%.
Both Wall Street and corporate America are concerned, and so should you be.
Don’t Ignore Central Bankers’ Warnings
All those central bankers are eager to keep their economies afloat, but judging from the comments, they’re worried that they are running out of monetary bullets.
“Normalization could lead to some heightened financial volatility,” warned Janet Yellen.
“This shift in policy will undoubtedly be accompanied by some degree of market turbulence,” said William Dudley, president of the Federal Reserve Bank of New York.
“The transition could be bumpy … potential for financial market disruption,” cautioned Bank of England Governor Mark Carney.
“Paramount risk of very low interest rates is to entertain the illusion that governments can continue to borrow rather than make difficult and yet necessary choices and indefinitely put off the implementation of structural reforms,” admitted Bank of France Governor Christian Noyer.
“The bottom line is there is a very good question about whether more stimulus is the answer,” said Reserve Bank of India Governor Raghuram Rajan.
Perhaps the most honest and telling statement from Malaysian central banker Zeti Akhtar Aziz: “In this highly connected world, you would be kindest to your neighbors when your keep your own house in order.”
That’s a whole lot of central banker warnings—and it’s always a mistake to ignore the people who control the world’s printing presses.
30-year market expert Tony Sagami leads the Yield Shark and Rational Bear advisories at Mauldin Economics. To learn more about Yield Shark and how it helps you maximize dividend income, click here.
To learn more about Rational Bear and how you can use it to benefit from falling stocks and sectors, click here.
The article Connecting the Dots: Not Yet Time to Celebrate a Market Turnaround was originally published at mauldin economics
Get our latest FREE eBook "Understanding Options"....Just Click Here!
Labels:
banks,
bear,
Bull,
Bullish,
Dow Jones,
Fed,
Mauldin Economics,
rally,
Russell 2000,
stocks,
Volatility,
Wall Street,
yield
Tuesday, October 14, 2014
Is this the "Sea Change" some have warned us about?
By John Mauldin
Did you feel the economic weather change this week? The shift was subtle, like fall tippy toeing in after a pleasant summer to surprise us, but I think we’ll look back and say this was the moment when that last grain of sand fell onto the sand pile, triggering many profound fingers of instability in a pile that has long been close to collapse. This is the grain of sand that sets off those long chains of volatility that have been gathering for the last five years, waiting to surprise us with the suddenness and violence of the avalanche they unleash.
I suppose the analogy sprang to mind as I stepped out onto my balcony this morning. Texas has been experiencing one of the most pleasant summers and incredibly wonderful falls in my memory. One of the conversations that seem to occur regularly among locals who have a few decades under their belts here, is just how truly remarkable the weather has been. So it was a bit of a surprise to step out and realize the air had turned brisk. In retrospect it shouldn’t have fazed me. The air has been turning brisk in Texas at some point in October for the six decades that my memory covers, and for quite a few additional millennia, I suspect.
But this week, as I worked through my ever-growing mountain of reading, I felt a similar awareness of a change in the economic climate. Like fall, I knew it was coming. In fact, I’ve been writing about it for years! But just as fall tells us that it’s time to get ready for winter, at least in more northerly climes, the portents of the moment suggest to me that it’s time to make sure our portfolios are ready for the change in season.
Sea Change
Shakespeare coined the marvelous term sea change in his play The Tempest. Modern day pundits are liable to apply the word to the relatively minor ebb and flow of events, but Shakespeare meant sea change as a truly transformative event, a metamorphosis of the very nature and substance of a man, by the sea.
In this week’s letter we’ll talk about the imminent arrival of a true financial sea change, the harbinger of which was some minor commentary this week about the economic climate. This letter is arriving to you a little later this week, as I had quite some difficulty writing it, because, while the signal event is rather easy to discuss, the follow on consequences are myriad and require more in-depth analysis than I’ve been able to bring to them on short notice. As I wrestled with what to write, I finally came to realize that this sea change is going to take multiple letters to properly describe. In fact, it might eventually take a book.
So, in a departure from my normal writing style, I am going to offer you a chapter by chapter outline for a book. As with all book outlines, it will be simply full of bones but without much meat on them, let alone dressed up with skin and clothing. I will probably even connect the bones in the wrong order and have to go back later and replace a leg bone with a rib, but that is what outlines are for. There is clearly enough content suggested by this outline to carry us through the next several months; and given the importance of the subject, I expect to explore it fully with you. Whether it actually becomes a book, I cannot yet say.
I should note that much of what follows has grown out of in depth conversations with my associate Worth Wray and our mutual friends. We’ve become convinced that the imbalances in the global economic system are such that the risks are high that another period of economic volatility like the Great Recession is not only likely but is now in the process of developing. While this time will be different in terms of its causes and symptoms (as all such stressful periods differ from each other in many ways), there will be a rhyme and a rhythm that feels all too familiar. That should actually be good news to most readers, as the last 14 years have taught us a little bit about living through periods of economic volatility. You will get to use those skills you learned the hard way.
This will not be the end of the world if you prepare properly. In fact, there will be plenty of opportunities to take advantage of the coming volatility. If the weatherman tells you winter is coming, is he a prophet of doom? Or is it reasonable counsel that maybe we should get our winter clothes out?
Three caveats before we get started. One, I am often wrong but seldom in doubt. And while I will marshal facts and graphs aplenty to reinforce my arguments, I would encourage you to think through the counter factuals presented by those who will aggressively disagree.
Two, while it goes without saying, you are responsible for your own decisions. It is easy for me to say that I think the bond market is going to go in a particular direction. I can even bet my personal portfolio on my beliefs. I can’t know your circumstances, but if you are similar to most investors, this is the time to make sure you have a truly balanced portfolio with serious risk management in the event of a sudden crisis.
Three, give me (and Worth, whom I am going to draft to write some letters) some time to develop the full range of our ideas. To follow on with my weather analogy, the air is just starting to get crisp, and winter is still a couple months away. Absent something extraordinary, we are not going to get snow and a blizzard in Dallas, Texas, tomorrow. We may still have some time to prepare, but at a minimum it is time to start your preparations. So with those caveats, let’s look at an outline for a potential book called Sea Change.
Prologue
I turned publicly bearish on gold in 1986. At the time (a former life in a galaxy far, far away), I was actually writing a newsletter on gold stocks and came to the conclusion that gold was going nowhere – and sold the letter. I was still bearish some 16 years later. Then, on March 1, 2002, I wrote in Thoughts from the Frontline that it was time to turn bullish on gold. Gold at that time was languishing around $300 an ounce, near its all time bottom.
What drove that call? I thought that the future directions of gold and the dollar were joined at the hip. A bit over a year later I laid out the case for a much weaker dollar in a letter entitled “King Dollar Meets the Guillotine,” which later became the basis for a chapter in Bull’s Eye Investing. As the chart below shows, the dollar had risen relentlessly through the early Reagan years, doubling in value against the currencies of America’s global neighbors, causing exporters to grumble about US dollar policy. Then the bottom fell out, as the dollar made new lows in 1992. From 1992 through 2002 the dollar recovered about half of its value, getting back to roughly where it was in 1967. Elsewhere about that time, I predicted that the euro, which was then at $0.88, would rise to $1.50 before falling back to parity over a very long period of time. I believe we are still on that journey.
One of the biggest drivers of economic fortunes in the global economy is the currency markets. The value of your trading currency affects every aspect of your business and investments. It is fundamental in nature. While most Americans never even see a piece of foreign currency, every time we walk into Walmart, we are subject to the ebb and flow of global currency valuations, as are Europeans and indeed every person who participates in the movement of goods and services around the globe. In fact, globalization means that currency values are more important than ever. The world is more tightly interconnected now than it has ever been, which means that events which previously had no effect upon global affairs can trigger cascades of events that affect everyone.
I believe we are in the early stages of a profound currency valuation sea change. I have lived through five major changes in the value of the dollar in the 45 years since Nixon closed the gold window. And while we are used to 40% to 50% moves in the stock market and other commodity prices happening in just a few years (or less), large movements in major trading currencies typically take many years, if not decades, to develop. I believe we are in the opening act of a multi-year US dollar bull market.
To continue reading this article from Thoughts from the Frontline – a free weekly publication by John Mauldin, renowned financial expert, best selling author, and Chairman of Mauldin Economics – please click here.
The article Thoughts from the Frontline: Sea Change was originally published at mauldin economics
Get our latest FREE eBook "Understanding Options"....Just Click Here!
Sunday, October 12, 2014
The Broken State and How to Fix It
By Casey Research
The United States of America is not what it used to be. Unsustainable mountains of debt, continuous meddling by the government and Fed to “stimulate the economy,” and the U.S. dollar’s dwindling status as the world’s reserve currency are very real threats to Americans’ standard of living. Here are some opinions from the recently concluded Casey Research Fall Summit on the state of the state and how to fix it.Marc Victor, a criminal defense attorney from Arizona and a staunch liberty advocate, says there’s really no such thing as “the state”—“it’s just some people bossing other people around.”
Not everyone wants to fix things, he says; the bosses like the status quo. For example, aside from drug lords, DEA agents are the ones benefiting most from the “War on Drugs.”
Victor believes that democracy and freedom are incompatible, since “democracy is majority rule, and freedom is self-rule.” If you want to bring true freedom to America, he says, winning hearts and minds is the only way to reboot this country and create a free society.
Paul Rosenberg, adventure capitalist, Casey Research contributor, and editor of “A Free Man’s Take,” views America’s future similarly. He thinks the United States is in a state of entropy.
The bad news, says Rosenberg, is that there will be no revolution. The good news is that the peak of citizens’ obedience to the state is behind us, and people are getting fed up with the government’s shenanigans.
Real change is slow, he says, so we must work persistently to create a better world.
Stephen Moore, chief economist at the Heritage Foundation, says the problem is liberal economic policy: Red states in the US, he says, have blown away blue states in job creation since 1990. Texas alone accounts for the entire net growth of the US economy over the past five years.
As another proof point in favor of a free market economy, Moore emphasizes that both Obama and Reagan took office during terrible economic times. While Obama has raised taxes and instituted Obamacare, Reagan cut taxes and regulation. As a result, the Reagan economic recovery was almost twice as robust as the Obama “recovery.”
One of the US’s biggest problems, says Moore, is that companies can’t reinvest profits because dividend, capital gains, and income taxes all have increased under Obama. Corporate taxes in the rest of the world have dramatically declined in the last 25 years, but in the US, they haven’t budged. The average corporate tax rate around the world is 24%—in the US, it’s 38%.
Overall, though, Moore is bullish on the U.S. economy. American companies, he says, are the best run in the world, if only the US government would adopt less economically destructive policies.
Doug Casey, chairman of Casey Research, legendary speculator, and best-selling financial author, isn’t so optimistic. First of all, he says, we’re in the Greater Depression right now, which began in 2008. He fears it’s too late to repair America, but says if anyone would attempt to do so, the following seven step program would help:
- Allow the collapse of “zombie companies” (companies that are only being held up by government handouts and other cash infusions).
- Abolish all regulatory agencies.
- Abolish the Federal Reserve.
- Cut the size of the military by at least 90%.
- Sell all US government assets.
- Eliminate the income tax.
- Default on the national debt.
He recommends owning significant assets outside your home country: for example, by buying foreign real estate. You should also buy and store gold, “the only financial asset that’s not simultaneously someone else’s liability.”
Casey’s suggestions include going short bubbles that are about to burst (like Japanese bonds denominated in yen), selling expensive assets like collectible cars and expensive real estate in major cities, as well as looking toward places like Africa as contrarian investment opportunities.
Nick Giambruno, senior editor of International Man, agrees that internationalizing your wealth—and yourself—is the most prudent way to go for today’s high net worth investors. It ensures that “no single government can control your destiny,” and that you put your money, business, and yourself where they are treated best.
You should internationalize each of these six aspects of your life, says Giambruno: our assets; your citizenship; your income/business; your legal residency; your lifestyle residency; and your digital presence.
Regarding your assets, you can find better capitalized, more liquid banks abroad, and using international brokerage accounts can provide you access to new investment markets.
To hear all of Nick Giambruno’s detailed tips on how to go global, as well as every single presentation of the Summit, order your 26+-hour Summit Audio Collection now. It’s available in CD and/or MP3 format.
Learn More Here
The article The Broken State and How to Fix It was originally published at Casey Research.
Get our latest FREE eBook "Understanding Options"....Just Click Here!
Labels:
bonds,
Bullish,
capitalist,
Casey Research,
DEA,
Debt,
dividend,
economy,
Federal Reserve,
military,
Nick Giambruno,
Obamacare,
tax,
wealth
Tuesday, July 29, 2014
We’re Ready to Profit in the Coming Correction....Are You?
By Laurynas Vegys, Research Analyst
Sometimes I see an important economic or geopolitical event in screaming headlines and think: “That’s bullish for gold.” Or: “That’s bad news for copper.” But then metals prices move in the opposite direction from the one I was expecting. Doug Casey always tells us not to worry about the short term fluctuations, but it’s still frustrating, and I find myself wondering why the price moved the way it did.As investors we’re all affected by surges and sell offs in the investments that we own, so I want to understand. Take gold, for example. Oftentimes we find that it seems to tease us with a nice run up, only to give a big chunk of the gains back the next week. And so it goes, up and down…..
Get your seat for our next free webinar "How to Trade Options Like a Professional with John Carter"....Just Click Here!
The truth is, and it really is this simple, but so obvious that people forget, that there are always rallies and corrections. The timing is rarely predictable, but big market swings within the longer term megatrends we’re speculating on are normal in our sector.
Since 2001, the gold price had 20 surges of 12% or greater, including the one that kick-started 2014. Even with last year’s seemingly endless “devil’s decline,” we got one surge. If we were to lower the threshold to 8%, there’d be a dozen more and an average of three per year, including two this year.
Here at Casey Research, we actually look forward to corrections. Why? We know we’ll pay less for our purchases—they’re great for new subscribers who missed the ground floor opportunities years ago.
This confidence, of course, is the product of decades of cumulative experience and due diligence. We’re as certain as any investor can ever be that today’s data and the facts of history back our speculations on the likely outcomes of government actions, including the future direction of the gold price.
When you keep your eye firmly on the ball of the major trends that guide us, you can see rallies and corrections for what they are: roller-coaster rides that give us opportunities to buy and take profits. This volatility is the engine of “buy low, sell high.” Understanding this empowers the contrarian psychology necessary to buy when prices on valuable assets tank, and to sell when they soar.
There have been plenty of opportunities to buy during the corrections in the current secular gold bull market. The following chart shows every correction of 6% or more since 2001.
As you can see, there have been 28 such corrections over the past 13 years—two per year, on average. Note that the corrections only outnumber surges because we used a lower threshold (6%). At the 12% threshold we used for surges, there wouldn’t be enough to show the somewhat periodic pattern we can see above. It’s also worth noting that our recent corrections fall well short of the sharp sell off in the crash of 2008.
Of course, there are periods when the gold price is flat, but the point is that these kinds of surges and corrections are common.
Now the question becomes: what exactly drives these fluctuations (and the price of gold in general)?
In tackling this, we need to recognize the fact that not all “drivers” are created equal. Some transient events, such as military conflicts, political crises, quarterly GDP reports, etc., trigger short-lived upswings or downturns (like some of those illustrated in the charts above). Others relate to the underlying trends that determine the direction of prices long term. Hint: the latter are much more predictable and reliable. Major financial, economic, and political trends don’t occur in a vacuum, so when they seem to become apparent overnight, it’s the people watching the fundamentals who tend to be least surprised.
Here are some of the essential trends we are tracking…...
The Demise of the US Dollar
Gold is priced around the world in United States dollars, so a stronger US dollar tends to push gold lower and a weaker US dollar usually drives gold higher. With the Fed’s money-printing machine (“quantitative easing”) having been left on full throttle for years, a weaker dollar ahead is a virtual certainty.
The end of the USD’s reign as reserve currency of the world won’t end overnight, but the process has been set in motion. Its days are all but numbered.
The consequences are not favorable for the US and those living there, but they can be mitigated, or even turned into opportunities to profit, for those who see what’s coming. Specifically, this big league trend is extremely bullish for real, tangible assets, especially gold.
Out-of-Control Government Debt and Deficits
Readers who’ve been with us for a while know that another major trend destined for some sort of cataclysmic endgame can be seen in government fiscal policy: profligate spending, debt crises, currency crises, and ultimately currency regime change. This covers more than the demise of the USD as reserve currency of the world (as mentioned above); it also covers a loss of viability of the euro, and hyperinflationary outcomes for smaller currencies around the world as well.
Such an unmanageable debt load has made deficits even worse. Interest payments on debt compound, so in time, interest rates will come to dominate government spending. Neither the dollar nor the economy can survive such a massive imbalance so something is bound to break long before the government gets to the point where interest gobbles up 80%+ of the budget.
Gold Flowing from West to East
The most powerful trend specifically in gold during the past few years has been the tidal shift in the flow of gold from West to East. China and India are the names of the game with the former having officially overtaken the latter as the world’s largest buyer of gold in 2013. Last year alone, China imported over 1,000 tonnes of gold through Hong Kong and mined some 430 tonnes more.
India presents just as strong a bullish case, if only slightly tainted with Indian government’s relentless crusade to rein in the country’s current account deficit by maintaining the outrageously high (i.e., 10%) import duty on gold and silver. Of course, this just means more gold smuggling, which casts official Indian stats into question, as more and more of the industry moves into the black and grey markets. World Gold Council research estimates that 75% of Indian households would either continue or increase their gold buying in 2014. Even without gold-friendly policies in place, this figure is extremely bullish for gold and in line with the big picture we’re betting on.
So What?
Nobody can predict when the next rally will occur nor the depth of the next sell-off. I can promise you this: as an investor you’ll be much happier about those surges if you stick to buying during the corrections. But it has to be for the right reasons, i.e., buying when prices drop below reasonable (if not objective) valuation, and selling when they rise above it. Focusing on the above fundamental trends and not worrying about short-term triggers can help.
Here’s what I suggest: test drive the International Speculator for 3 months with a full money back guarantee, and if it’s not everything you expected, just cancel for a prompt, courteous refund of every penny you paid. Click Here to get Started Now.
The article We’re Ready to Profit in the Coming Correction....Are You? was originally published at Casey Research
Get your seat for our next free webinar "How to Trade Options Like a Professional with John Carter"....Just Click Here!
Labels:
Bullish,
Casey Research,
china,
Debt,
Dollar,
Gold,
investments,
Laurynas Vegys,
profits,
sector,
trends,
U.S.,
USD
Subscribe to:
Posts (Atom)