Showing posts with label Bull. Show all posts

Tuesday, April 2, 2019

Waiting for the Russell 2000 to Confirm the Next Big Move

While we have recently suggested the US stock market is poised for further upside price activity with a moderately strong upside price “bias”, our researchers continue to believe the U.S. stock markets will not break out to the upside until the Russell 2000 breaks the current price channel, Bull Flag, formation. Even though the U.S. stock markets open with a gap higher this week, skilled traders must pay attention to how the Mid-Caps and the Russell 2000 are moving throughout this move.

As we continue to advise our clients that the upside pricing cycle in the U.S. stock market is being underestimated, see this research post: we also believe that increased volatility and price rotation will continue to drive larger rotations in price before the final breakout upside move takes place. We want to continue to warn traders that we still don’t have any confirmed upside breakout with price continuing to stay within this price channel in the Russell 2000. Eventually, when and if the price does breakout to the upside, we will have a very clear indication that continued higher prices and a larger upside move is happening. Until then, we need to stay cautious about the types and levels of rotation that continue within the markets.


Recently, volatility has started to increase as can be seen in this VIX chart. If the Russell 2000 is not able to break this trend channel with this current upside price move, then we fully expect continued price rotation in the U.S. stock markets and another increase in the VIX as this rotation takes place. The NQ recently rotated downward by nearly 4% while historical volatility continues to narrow. When volatility diminishes in extended price trends, we’ve learned to expect aggressive price rotation can become more of a concern. We expect the VIX to spike above 16~18 on moderate volatility as we get closer to the cycle inflection date near June/July 2019.


Overall, our researchers believe the upside price bias in the U.S. stock market will continue for another 30+ days as our research and predictions regarding precious metals and the longer term equities price cycles continue to play out. Skilled traders need to be aware that this upside price bias may include larger price rotation and volatility as we get closer to the May/June/July 2019 cycle inflection points. Stay aware of the risks as 4~6%+ price rotations should be expected over the next 30+ days throughout this upside price bias.

Do you want to find a team of dedicated researchers and traders that can help you find and execute better trades in 2019 and beyond? Please visit The Technical Traders to learn how we can help you prepare for the big moves in the global markets and find better opportunities for greater success in the future. Our team of researchers and traders continue to scan the markets for new trades and unique opportunities.

Chris Vermeulen


Wednesday, April 8, 2015

Will Gold Win Out Against the US Dollar?

By Louis James

It is an essential impossibility to solve problems created by excess debt and artificial liquidity with more of the same. That’s our credo here at Casey Research, and the reason why we believe the gold price will turn around and not only go higher, but much, much higher.

While fellow investors around the world may not agree with gold loving contrarians like us, they are buyers: gold is up in euros and almost everything else, except the dollar.

The dollar’s rise has been strong and seems all but unstoppable. But look at it in big picture terms, as in the chart below, and ask yourself how sustainable the situation is.


I’m skeptical of reading too much into such charts. A peak like the one in the early 1980s would certainly take the USD much higher, and for several years to come. But still, this is an aberration. It’s not the new normal, but rather the new abnormal.

More to the point, gold hasn’t collapsed since the dollar began its latest surge last July. Just look at this one-year chart of gold vs. the US dollar. The dollar is up sharply (in EUR, as a proxy for everything-not-the-dollar and for comparability to the chart below), but gold is only moderately down.

Gold has been trading almost sideways over the last year.

That might seem like damnation by faint praise, but it’s critically important. With the USD skyrocketing and commodities plummeting, gold should be dropping like—well, like a gold balloon—if the critics are right and it has no practical value at all, except to dentists and fashion accessory designers.

But gold is money, the best store of wealth millennia of human experience have devised, and more and more people are recognizing this. Consider this chart of gold vs. the euro, which documents my contention that people outside the US do not see gold as a barbarous relic, but as an essential holding to safeguard their future.

Pretty much everywhere but in the US, gold is up, not down.

This chart supports my view that gold rebounded last November when it breached its 2013 low because international buyers saw that as an opportunity. The US has gone from primarily exporting inflation to exporting gold and inflation.

The fact that the dollar has risen faster than gold has dropped has important, positive effects on miners operating outside the US. If costs are paid in Canadian dollars, Mexican pesos, euros, or really hard-hit currencies like the Brazilian real, then those costs have just gone way down relative to the price of gold.

Of course, there’s a good chance that there’ll be more sell-offs before the gold bull resumes its charge… but they should be regarded as opportunities. Because once the gold market rises again, the best small-cap mining stocks have the potential to go vertical.

Watch eight industry experts discuss where we are in the gold cycle, and how to prepare your portfolio for gains of up to 500% or even 1,000%, in Casey’s recent online event, GOING VERTICAL. Click here for the video.


Get our latest FREE eBook "Understanding Options"....Just Click Here!

Thursday, January 15, 2015

A Five Year Forecast: Is this a Tsunami Warning?

By John Mauldin

It is the time of the year for forecasts; but rather than do an annual forecast, which is as much a guessing game as anything else (and I am bad at guessing games), I’m going to do a five year forecast to take us to the end of the decade, which I think may be useful for longer term investors. We will focus on events and trends that I think have a high probability, and I’ll state what I think the probabilities are for my forecasts to actually happen. While I could provide several dozen items, I think there are seven major trends that are going to sweep over the globe and that as an investor you need to have on your radar screen. You will need to approach these trends with caution, but they will also provide significant opportunities.

There is a book in here somewhere, but I do not intend to write one today. In fact, my New Year’s resolution is to write shorter letters in 2015. Over the last decade and a half, the letter has tended to get longer. A little more here, a little more there, and pretty soon it just gets to be a bit too much to read in one sitting. That means I need to either be more concise, break up my topics into two sessions or, if further writing is necessary, post the additional work on the website for those interested.

Take a minute to grab our free eBook "Understanding Options" while it's still available.....Just Click Here

So I’m writing today’s letter in that spirit. Each of the major topics we’ll be covering will show up in other letters over the next few months. I would appreciate your feedback and any links to articles and/or data points that you think I should know about regarding these topics.

But first, this is generally the most downloaded letter of the year. I want to invite new readers to become one of my 1 million closest friends by simply entering your email address here. You can follow my work throughout the year, absolutely free (and see how my prognostications are turning out). And if you’re a regular reader, why not send this to a few of your friends and suggest they join you? At the very least, Thoughts from the Frontline should make for some interesting conversations this year. Thanks. Now let’s get on with the forecasting.

Seven Significant Changes for the Next Five Years

Let’s look at what I think are six inexorable trends or waves that will each have a major impact in its own right but that when taken together will amount to a tsunami of change for the global economy.

1. Japan will continue its experiment with the most radical quantitative easing attempted by a major country in the history of the world… and the experiment is getting dangerous. The Bank of Japan is effectively exporting the island nation’s deflation to its trade competitors like Germany, China, and South Korea and inviting a currency war that could shake the world. I’ve been saying this for years now, but the story took a nasty turn on Halloween Day, when the Bank of Japan announced it was greatly expanding and changing the mix of its asset purchases. The results have been downright scary, and a major slide in the JPY/USD exchange rate is almost certain over the next five years. I give it a 90% probability. All this while the population of Japan shrinks before our very eyes.

2. Europe is headed for a crisis at least as severe as the Grexit scare was in 2012 – and for the resulting run-up in interest rates and a sovereign debt scare in the peripheral countries. After all these years of struggle, the structural flaws in the EMU’s design remain; and now major economies like Italy and France are headed for trouble. In the very near future we will finally know the answer to the question, “Is the euro a currency or an experiment?” The changes required to answer that question will be wrenching and horrifically expensive. There are no good answers, only difficult choices about who pays how much and to whom. Again, I see the deepening of the Eurozone crisis as a 90% probability.

3. China is approaching its day of reckoning as it tries to reduce its dependency on debt in its bid for growth, while creating a consumer society. The world is simply not prepared for China to experience an outright “hard landing” or recession, but I think there is a 70% probability that it will do so within the next five years.

And the probability that China will suffer either a hard landing OR a long period of Japanese style stagnation (in the event that the Chinese government is forced to absorb nonperforming loans to prevent a debt crisis) is over 95%. To be sure, it is still quite possible that the Chinese economy will be significantly larger in 2025 (ten years from now) than it is today, but realizing that potential largely depends on President Xi Jinping’s ability to accomplish an extremely difficult task: deleveraging the debt overhang that threatens the country’s MASSIVE financial system while rebalancing the national economy to a more sustainable growth model (either through either a vast expansion of China’s export market or the rapid development of “new economy” sectors like technology, services, and consumption; or both).

This will not be the end of China, which I’m quite bullish on over the very long term, but such transitions are never easy. Even given this rather stark forecast, it is still likely (in my opinion) that the Chinese economy will be 20 to 25% bigger as 2020 opens than it is today; and every other major economy in the world (including the US) would be thrilled to have such growth. At the very least, though, China’s slowdown and rebalancing is going to put pressure on commodity exporters, which are generally emerging markets plus Australia, Canada, and Norway.

4. All of the above will tend to be bullish for the dollar, which will make dollar-denominated debt in emerging market countries more difficult to pay back. And given the amount of debt that has been created in the last few years, it is likely that we’ll see a series of crises in emerging-market countries, along with an uncomfortably high level of risk of setting off an LTCM-style global financial shock.

My colleague Worth Wray spoke about this new era of volatile FX flows and growing risk of capital flight from emerging markets at my Strategic Investor Conference last May, and he has continued to remind us of those risks in recent months (“A Scary Story for Emerging Markets” and “Why the World Needs the US Economy to Struggle”).

Now that Russia has tumbled into a full-fledged currency crisis with serious signs of contagion, Worth’s prediction is already playing out, and I would assign an 80 to 90% probability that it will continue to do so, as a function of (1) the rising US dollar and a reversal in cross border capital flows, (2) falling commodity prices, or (3) both. This massive wave is going to create a lot of opportunities for courageous investors who are ready to surf when countries are cheap.

5. I do not believe that the secular bear market in the United States that I began to describe in 1999 has ended. Secular bull markets simply do not begin from valuations like those we have today. Either we began a secular bull market in 2009, or we have one more major correction in front of us.

Obviously, I think it is the latter. It has been some time since I’ve discussed the difference between secular bull and bear markets and cyclical bull and bear markets, and I will briefly touch on the topic today and go into much more detail in later letters. For US focused investors, this is of major importance. The secular bear is not something to be scared of but simply something to be played. It also offers a great deal of opportunity.

If I am right, then the next major leg down will bring on the end of the secular bear and the beginning of a very long term secular bull. We will all get to be geniuses in the 2020s and perhaps even before the last half of this decade runs out. Won’t that be fun? Let’s call the end of the secular bear a 90% probability in five years and move on.

6. Finally, the voters of the United States are going to have to make a decision about the direction they want to take the country. We can either opt for growth, which will mean a new tax and regulatory regime, or we can double down on the current direction and become Europe and Japan. I’ve traveled to both Europe and Japan, and they’re both pleasant enough places to live, but I wouldn’t want to be a citizen of either Japan or the Eurozone for the rest of this decade. (I particularly love Italy, but it is beginning to resemble a basket case, with last year’s optimistic drive for reforms seemingly stalled.)

However, I would rather live and work and invest in a high-growth country, with opportunities all around me, a country where we reduce income inequality by increasing wealth and opportunities at the lower end of the income scale instead of trying to legislate parity by increasing taxes and imposing government mandated wealth redistribution, which slows growth and squelches opportunity for everyone.

A restructuring of the US tax and regulatory regime does not mean a capitulation to the wealthy, big banks, or big business. Properly conceived and constructed, it will allow the renewal of the middle class and result in higher income for all. Sadly, it is not clear to me that either the Republican or Democratic parties are up to the task of making the difficult political decisions necessary. They each have constituencies that tend to opt for the status quo. But I see hope on both sides of the political spectrum that change is possible. The course they set will give us an idea where we will want to focus our portfolios in the decade of the ’20s. It is a 100% probability that we will have to make a decision. It is less than 50% that we will make the right one – or at least the one that I think is the right one.

7.  We have entered the Age of Transformation. We’re going to see the development of new technologies that will simply astound us – from increasingly capable robots and other applications of AI to huge breakthroughs in biotechnology.

The winners are going to be those who identified the truly transformational technologies early on in their development and invested wisely. While riskier (potentially far riskier) than most of your investments should be, a basket of new-technology stocks should be considered for the growth part of your portfolio. I see the Age of Transformation as a 100% probability.

Just for the record, I also see a continuation of the global deflationary environment and a slowing of the velocity of money until we have some type of resolution concerning sovereign debt. Central banks will continue to try to solve the “crises” I mentioned above with monetary policy, but monetary policy will simply not be enough to stem the tide. Central banks can paddle as hard as they like into the waves of change, but they cannot reverse their powerful flow.

Now, let’s look further at each of the waves that are forming into a potential tsunami.

To continue reading this article from Thoughts from the Frontline – a free weekly publication by John Mauldin, renowned financial expert, best-selling author, and Chairman of Mauldin Economics – please click here.


Get our latest FREE eBook "Understanding Options"....Just Click Here!

Thursday, November 13, 2014

Connecting the Dots: Not Yet Time to Celebrate a Market Turnaround

By Tony Sagami


The Wall Street crowd liked what they heard last week and pushed the Dow Jones to a new high. In particular, the trio of the Republican landslide victory, an overall positive Q3 earning season, and a good jobs report that showed unemployment dropping to 5.8% was behind the rally.

And what a rally it was. Since the start of earnings season on October 8, the S&P 500 has increased by 3% and has bounced by an eye popping 9.1% from the October 15 low. Many of my peers have already popped the champagne and drunkenly declared a coast-is-clear resumption of the great bull market.

Not so fast. There was a trio of negative news pieces last week that tells me there is more to be worried about than there is to celebrate.

“V” Is for Vulnerable… Not Victory


You shouldn’t trust “V”-shaped bottoms.

Instead of being encouraged by the 9% moonshot since the October 15 low, I am even more skeptical. The S&P 500 shot up by 220 points in just three weeks, which tells me that the rubber band of stock market psychology is overstretched.


The stock market’s massive mood swing from fear to greed can change just as quickly to the other direction. Sharp trend reversals followed by sharp rebounds is not a kind of bottom building behavior.

The rally has been accomplished with low trading volume—a classic definition of an unsustainable bounce because it shows that the rally was more from a lack of sellers rather than an abundance of buyers.

And don’t forget about the drastic underperformance of small stocks. The Russell 2000 is up less than 1% for the year compared to 11% for the Nasdaq and 10% for the S&P 500.

Earnings: Look Ahead, Not Behind


Overall, corporate America had an impressive third quarter. 88% of the companies in the S&P 500 have reported their third-quarter earnings; of those, 66% exceeded Wall Street expectations.

Impressive, right? Not so fast!

When it comes to earnings, you need to be looking through the front-view windshield and not the rear-view mirror.


Even the perpetually bullish analytical community is getting worried. The average estimates for Q4 earnings as well as Q1 2015 are being downwardly adjusted. Since October 1:
  • Q4 earnings growth have been lowered from 11.1% to 7.6%;and
  • Q1 2015 earnings growth has been chopped from 11.5% to 8.8%.
Don’t give Wall Street too much credit for being rational. Those downward revisions are largely based on the cautious outlook given the corporate America itself. The ratio of negative outlooks to positive outlooks is 3.9 to 1!

Both Wall Street and corporate America are concerned, and so should you be.

Don’t Ignore Central Bankers’ Warnings


Many of the world’s central bankers gathered in Paris last week to figure out how to keep the world’s leaky financial boat from sinking, as well as spending more of their taxpayers’ money on fine wine, cuisine, and luxury hotels.

All those central bankers are eager to keep their economies afloat, but judging from the comments, they’re worried that they are running out of monetary bullets.

“Normalization could lead to some heightened financial volatility,” warned Janet Yellen.


“This shift in policy will undoubtedly be accompanied by some degree of market turbulence,” said William Dudley, president of the Federal Reserve Bank of New York.

“The transition could be bumpy … potential for financial market disruption,” cautioned Bank of England Governor Mark Carney.

“Paramount risk of very low interest rates is to entertain the illusion that governments can continue to borrow rather than make difficult and yet necessary choices and indefinitely put off the implementation of structural reforms,” admitted Bank of France Governor Christian Noyer.

“The bottom line is there is a very good question about whether more stimulus is the answer,” said Reserve Bank of India Governor Raghuram Rajan.

Perhaps the most honest and telling statement from Malaysian central banker Zeti Akhtar Aziz: “In this highly connected world, you would be kindest to your neighbors when your keep your own house in order.”

That’s a whole lot of central banker warnings—and it’s always a mistake to ignore the people who control the world’s printing presses.

30-year market expert Tony Sagami leads the Yield Shark and Rational Bear advisories at Mauldin Economics. To learn more about Yield Shark and how it helps you maximize dividend income, click here.

To learn more about Rational Bear and how you can use it to benefit from falling stocks and sectors, click here.


Get our latest FREE eBook "Understanding Options"....Just Click Here!


Friday, September 26, 2014

Are you a "Future Bull"?

By John Mauldin

In a conversation this morning, I remarked how rapidly things change. It was less than 20 years ago that cutting edge tech for listening to music was the cassette tape. We blew right past CDs, and now we all consume music from the cloud on our phones. Boom. Almost overnight.

A lot has changed about the global economy and politics, too. Things that were unthinkable only 10 years ago now seem to be reality. What changes, I wonder, will we be writing about a few years from now that will seem obvious with the advantage of hindsight?

In today’s Outside the Box, my good friend David Hay of Evergreen Capital sends us a letter written from the perspective of a few years in the future. I find myself wishing that some of the more hopeful events he foresees will come true, and my optimistic self actually sees a way through to such an outcome. In that future, I will join David as a bull. But the path that he proposes to take to that more optimistic future is not one that most investors will enjoy, so on the whole it’s a very sobering letter and one that should make all of us think.

Take a break to download our new FREE eBook "Understanding Options".....Just Click Here

I’m back from San Antonio, where I spent four enjoyable days with my friends and participants at the Casey Research Summit. I tried to attend as many of the conference sessions as I could, and I intend to get the “tapes” for some of the ones I missed.

I did a lot of video interviews while in San Antonio, too. And finished up a major documentary. Mauldin Economics will be making all of these available very soon. It’s hard to recommend one interview over another, but Lacy Hunt is just so smart.

And with no further remarks let’s turn it over to David Hay and think about how the next few years will play out. Have a great week.

Your wishing his crystal ball was clearer analyst,
John Mauldin, Editor

Stay Ahead of the Latest Tech News and Investing Trends...
Each day, you get the three tech news stories with the biggest potential impact.

Future Bull

By David Hay
Twitter: @EvergreenGK

“Money amplifies our tendency to overreact, to swing from exuberance when things are going well to deep depression when they go wrong.”
– Economist and historian Niall Ferguson

Future bull.  Let me admit up front that this EVA has been rolling around in my mind for quite awhile. Its genesis may be directly related to the fact that I’ve been desperately yearning to write a bullish EVA – besides on Canadian REITs or income securities that get trounced by the Fed’s utterances. In other words, I want to return to my normal posture of being bullish on the US stock market.

It wasn’t long ago, like in 2011, that clients were chastising me for believing in what I formerly referred to as “the coiled spring effect.” By this I meant that corporate earnings had been rising for over a decade, and yet, stock prices were much lower than they there were in 1999. Consequently, price/earnings ratios were compressed down to low levels, though certainly not to true bear market troughs. My belief was that stocks were poised for an upside explosion once the inhibiting factors, primarily extreme pessimism on the direction of the country, were removed. I even remember one long-time client dismissing my “Buy America” argument on the grounds that in my profession I had to be bullish (regular EVA readers know that is definitely not the case!).

Well, a funny thing happened to my “coiled spring effect” – namely, it became a reality. Additionally, the upward reaction was much stronger than I envisioned. But what really caught me by surprise was that it played out with virtually no improvement on the “extreme pessimism on the direction of the country” front. Perhaps I’m wrong, but I don’t think there has ever been a rally that has taken stocks to such high valuations (time for my usual qualifier – based on mid-cycle profit margins, not the Fed-inflated ones we have today) concurrent with such pervasive fears America is on the wrong track.

Undoubtedly, the pros among you who just read that last sentence are thinking: “That’s great news! All that pessimism will keep this market running. We’re not even close to the peak.” Not so fast, mon amis (and amies)! We’re not talking market pessimism here. As numerous EVAs have documented, US investors are as heavily exposed to stocks as they have ever been, other than during the late 1990s, when stocks bubbled up to valuations that made 1929 look restrained.

Further, please check out the chart below from still-bullish Ned Davis regarding investment advisor sentiment.  The bearish reading is the lowest since the fateful year of 1987, while bulled-up views are in the excessively optimistic zone.  (See Figure 1.)


It is my contention that there are currently millions of fully-invested skeptics. They aren’t bullish long-term – in fact, they believe the underlying fundamentals are alarming (with the usual perma-bull exceptions) – but they feel compelled by the lack of competitive alternatives to remain at their full equity allocation.

Disturbingly, professional investors are increasingly doing so even with money belonging to retired investors who need both cash flow and stability.

Okay, with all that history out of the way, let’s go the other direction  – into the future, to a time several years from now, when conditions are nearly the polar opposite of where they are today.

The Evergreen Virtual Advisor (EVA)

November, 201???

At long last, reforms! Do you remember back in 2014 when the stock market was as hot as napalm? When it just never went down? When millions believed the Fed could control stock prices by whipping up a trillion here and a trillion there?

Looking back from the vantage of today, it all seems so obvious. We should have known better than to believe that the S&P 500 had years more of appreciation left in it after having already tripled by the fall of 2014 from the 2009 nadir. The warning signs were there. But, before we rehash what went wrong, let’s focus on the upside of what some are calling “The Great Unwind” – the hangover after years and years of the Fed recklessly driving asset prices to unsustainable heights.

First of all, let me start with what I think is the biggest positive of all:  the end of the central banks’ era of omnipotence. While that might sound like a major negative, you may have noticed that with the crutch of binge-printing taken away, our nation’s leaders are finally getting around to implementing reforms that should have been enacted years ago. The history of our country is that we are energized by crises, and the latest is no exception. Our most recent financial convulsions have galvanized a bipartisan coalition to attack an array of long-festering problems that have hobbled our country since the start of the millennium.

Arguably, the most important was the recently enacted tax reform legislation. Skeptics believed the US could never move toward the type of simple tax system that has long been used in countries like Singapore, Hong Kong, and even Estonia. It took the realization by both parties that lower tax rates with almost no deductions would actually produce more revenue. Moreover, the elimination of incalculable and massive “friction costs” for millions of businesses and individuals, trying to adhere to and/or game that beastly labyrinth known as the tax code, is quickly catalyzing real economic growth. This is in contrast to the 2010 to 2014 counterfeit version that rolled off the Fed’s printing press.

By 2014, the US was ranked a lowly 32nd out of 34 countries in terms of tax fairness and efficiency. Yet, now, thanks to last year’s drastic tax reform, US corporations are no longer fleeing in droves to other countries, using such tax dodges as inversions (buying out foreign companies and assuming their country of corporate citizenship to access lower tax rates). They have even begun to repatriate their trillion or so of offshore profits since the formerly onerous tax rate of 35%, the highest in the developed world, has been reduced. And, thanks to the eradication of the aforementioned legalized tax dodges, corporate tax receipts are actually beginning to rise sharply, despite the fact that our economy is in the early stages of recovering from the latest recession.

As we all know, the rationalization of our national business model involves much more than even the essential aspect of tax code simplification. At long last, meaningful tort reform has been enacted. No longer will the rule of lawyers be allowed to dominate the rule of law. The enormous, but insidiously hidden, costs of a subsector of the legal system whose chief mission is to squeeze unjustifiable sums from the private sector is finally being reined in.

Similarly, regulatory overkill is also being addressed by the very entity that created this monster in the first place: the government itself. Absurd, overlapping, and often conflicting directives that hobbled the most essential element of the private sector – small businesses – have been abolished, replaced by a much simpler and unified set of rules.

Even America’s dysfunctional and wasteful healthcare system is being revamped using rational economic solutions, rather than by piling on more incomprehensible rules, requirements, and panels. Consumers can now easily compare prices among service providers thanks to technology as instituted by for-profit providers. Along with significantly improved visibility, they also now have far greater control over how their healthcare dollars are spent.  Medical outlays are now in a decided downtrend.

Incredibly, Congress is actually beginning to behave like a representative of the people rather than an ATM dispensing taxpayer money to the most politically connected. The intense implosions of the multiple bubbles the Fed intentionally inflated triggered a backlash of voter ire toward its legislative enablers. Since then, we’ve seen a dramatic House – and Senate – cleaning. This new “coalition of the thinking” is now following the proven path to recovery that numerous countries – such as Germany, Sweden, and Canada – blazed when their economic and financial systems hit previous roadblocks. As in those nations, moving away from excessive socialism, while simultaneously supporting the business community, rather than vilifying and hindering it, is already beginning to elevate America out of its long stagnation.

Collectively, these sweeping reforms are as dramatic as those seen in the 1980s and promise to unleash a growth boom equally as powerful as the ones that followed those overhauls. Yet, despite these dramatic and highly promising changes, investors remain hunkered down in their bomb shelters.

Fool me once, fool me twice, fool me thrice!  After the third devastating bear market since 1999, investor hostility toward stocks has reached a level unseen since the 1970s. Far too many were lured in by the last up-leg of the great bull market that started in the depths of pessimism in March of 2009. As the market resolutely climbed higher and higher, even beyond the five-year length of most bull cycles, millions of investors succumbed to either greed or complacency.


Indicative of the feverish conditions prevailing then—despite the widely disseminated myth that it was the most hated bull market of all time—headlines like those shown below, and graphics such as the one above, began to dominate the financial press.


Remarkably, at least to me, investors once again ignored warnings from the savviest savants, almost all of whom had waxed cautious about the tech and housing manias: Bob Shiller, Jeremy Grantham, Rob Arnott, John Mauldin, Seth Klarman, and John Hussman. As the esteemed Mohamed El-Erian had prophetically written in June of 2014, “In their efforts to promote growth and jobs, central banks are trading the possibility of immediate economic gains for a growing risk of financial instability later.”

Conversely, Janet Yellen didn’t do her legacy any favors by uttering these words in July, 2014: “Because a resilient financial system can withstand unexpected developments, identification of bubbles is less critical.” At the time, I was pretty sure she would come to regret that statement as much as Ben Bernanke did his equally ill-advised assurances back in 2007 that the problems in sub-prime mortgages were contained. Based on how fragile the “resilient financial system” turned out to be, I’ll say no more.

It did surprise me that despite having called out those previous bubbles, as well as several others including the 2008 blow-offs in commodities and Chinese stocks, I received such intense resistance from other professionals and even clients. After awhile, I was getting so much push back I started to feel like the nose of a commercial airliner being readied for take-off.

Ignorance wasn’t bliss. Another aspect of the late stages of the last bull market was how many investment professionals – who should have known better – dismissed Robert Shiller’s namesake P/E. To clarify, Shiller believes (as did Warren Buffett’s mentor, Ben Graham) that the stock market needs to be valued based on normalized earnings, not bottom- or top-of-the cycle profits. Despite the unassailable logic of this approach, a legion of perma-bulls repeatedly sought to discredit Shiller and his valuation methodology. Some even went so far as to deride his process as “Shiller Snake Oil,” notwithstanding Dr. Shiller’s Nobel Prize and, more meaningfully in my view, the fact that he had forewarned of both the tech and housing bubbles – unlike almost all of those throwing stones at him back in 2014.

The main criticism from those who were “hatin’ on” Shiller in 2014 was that his P/E had produced only two buy signals over a 25-year period. This was a valid critique but it missed an essential point: Despite the reality that the stock market from 1990 to 2014 traded at valuations far higher than it had in any previous quarter-century timeframe, the Shiller P/E accurately predicted future returns. In other words, when the Shiller P/E was very elevated – like in the late 1990s, 2007, and 2014 (so far) – stocks went on to generate extremely disappointing future returns (it also did so in decades going all the way back to the 1920s but this was not the era that the Shiller debunkers were criticizing). The graphic on the next page vividly illustrates this fact, even though it was created before the most recent bear market further underscored the danger of ignoring high Shiller P/Es. (See Figure 2.)


It also shocked and dismayed me at the time how many contortions Wall Street strategists, and even money managers, performed in order to dismiss concerns about the extreme variability of earnings. Somehow charts like the one below from Capital Economics were blown-off despite (or, perhaps, because) it so clearly highlighted the tendency of corporate profits to return back down to the long-term trend-line of nominal GDP growth, with stocks closely following. As we all now know, this time wasn’t different. (See Figure 3.)


The legions of market cheerleaders also ignored the heavy reliance on profits from the financial sector, a notoriously unstable source of earnings. This proved to be a disaster in 2007 and, unsurprisingly, was again once the Fed’s “Great Levitation” fell victim to gravitational forces. (See Figure 4.)


Even David Rosenberg, one of the few economists who saw the housing debacle coming, but who briefly flirted with drinking the Fed-spiked bubble-aid in 2014, noted that 60% of earnings growth from 2010 through 2013 came from share buy-backs. He calculated that the market’s “organic” P/E, backing out the influence from share repurchases, was over 20, even prior to normalizing for peak profit margins. Additionally, the reality that corporations buy the most stock at high prices, and the least at low prices, was forgotten – another costly oversight. (See Figure 5, above.)

It was also overlooked during this era of Fed-induced euphoria, that low interest rates – so often cited by bulls as a justification for lofty P/Es – historically coincided with lower earnings multiples. (See Figure 6.)


As Japan and Europe have repeatedly shown over the last two decades, when low interest rates are a function of chronic economic stagnation, P/Es actually contract, not expand. The fact that the latest recession has reduced America’s anemic 1.8% annual growth rate since 2000 to even lower levels is a key reason why stocks have been thrashed over the last couple of years, despite interest rates on the 10-year treasury note falling to 1%.

Another massive mistake was to overlook the strident warning from Evergreen’s favorite valuation metric, the price-to-sales (P/S) ratio. By the summer of 2014, the median stock in the S&P 500 was trading at its highest P/S ratio on record. Sadly, this attracted little attention. (See Figure 7.)


But perhaps the most egregious oversight of all was to forget the theorem from the late, great economist Hyman Minsky who long ago warned that stability breeds instability. As was the case from 2002 through 2007, the exceptionally low volatility of the years leading up to the latest crisis numbed market participants to the steadily rising risks. Even professional investors convinced themselves they could get out in time once conditions became unstable, an arrogance that has been severely punished, as well it should. Alas, we’ve had to learn Dr. Minsky’s lesson the hard way, once again.

But let’s close this EVA by focusing on the stunning opportunity for investors created by the Fed’s latest misadventure…...

Investors, start your engines! It is certainly understandable that US investors are thoroughly disenchanted with the stock market. The fact that the powers-that-be, or at least used-to-be, allowed securities trading to become so heavily dominated by computers was, like the tolerance of the Fed’s asset inflation, inexcusable. The influence of computerized, black box trading was unquestionably a huge factor in the speed-of-light-in-a-vacuum drop in stock prices. Also as feared, many ETFs poured kerosene on the fire as investors became terrified by the nearly overnight erosion in these prices, causing them to sell en masse. The plethora of ETFs holding illiquid underlying securities were particularly crushed, with many simply halting trading for long stretches. Now, instead of rapturous paeans about the wonders of ETF liquidity and low costs, the financial press is full of horror stories about their fundamental flaws (fortunately, higher quality and more liquid ETFs, performed as expected during the worst of the panic).

Further, based on the failure of the Fed’s desperate maneuver to stabilize stocks after their first big break, by launching another $1 trillion QE, this time directly buying US shares, investors have rationally lost faith in the Fed’s ability to make stocks dance to its tune. While QE 4 did cause a sharp counter-trend rally after it was initially launched, the supportive effects soon waned, as we all are now painfully aware. The resumption of the bear market after the Fed’s frantic triage effort was reminiscent of Dorothy, the Tinman, the Lion, and Toto discovering that behind the green curtain was a scared old man instead of The Wizard of Oz.

The extreme negativity by investors toward the stock market today is reflected in the high level of outflows being seen from equity mutual funds, including ETFs. Cash levels are high everywhere as institutional and retail investors, as well as corporations, have become excessively risk averse. This provides the rocket fuel for the next bull market which might just be much closer than almost everyone believes.

Rampant investor pessimism is also being manifested in the drop in the Shiller P/E to the mid-teens from 26 at the peak of the last bull romp.  As a direct result, future returns on stocks are now projected by the aforementioned Jeremy Grantham and John Hussman to be in the low double digits over the next seven to ten years.  Yet, no one seems interested. Even Warren Buffett’s ragingly bullish comments, which were considerably premature, are being attributed to the ramblings of a soon-to-be nonagenarian.

Naturally, I have considerable empathy for Mr. Buffett because, as usual, Evergreen was early to shift into bullish mode. We waited much longer than most people and actually did a fairly commendable job of cutting back into the Fed’s QE4 driven rally, after raising our equity exposure during the initial steep sell-off. But once stocks fell hard after that sugar-high wore off, we were guilty of our typical “premature accumulation syndrome.”

However, we did the same thing way back in October of 2008 when we published our client newsletter, “A Bull is Born” (and wrote a series of “buy the panic” EVAs), only to watch the market slide another 30%.  Yet, buying when almost the entire world was in liquidation mode, much of it forced, in the fall of 2008 proved to be extremely lucrative over the next two years. We are convinced the same will be true following this latest episode of market mayhem.

From a longer-term standpoint, a perspective most investors seem unwilling to take given their still-fresh pain and suffering, conditions look highly encouraging. In addition to the previously described remedies our policy makers are belatedly adopting, many of the key positive trends the bulls used to justify over-the-top valuations for stocks back in 2014 are still in place. Admittedly, the enthusiasm got ahead of reality but the energy renaissance continues apace in the US, despite the well-publicized fracking problems. Re-shoring of manufacturing, which has been slower than the uber-optimists forecast, appears to be now accelerating. Relatedly, robotic adoption is rapidly spreading through the US industrial base, supporting Evergreen’s belief that re-shoring is a reality, not a fantasy. Yet, there’s even more to like.

Nanotechnology and solar power innovators continue to provide breathtaking breakthroughs. Today, nanotech is becoming as ubiquitous as the microprocessor was a decade ago. Meanwhile, solar power, thanks to miniaturization advances similar to Moore’s Law, has achieved “grid parity,” or even lower, in over a dozen US states. Power is becoming increasingly cheap and abundant and that’s terrific news for humanity.

Finally, and perhaps most significantly, we are far closer to achieving that wondrous, if slightly scary, state known as “singularity.” As most us now know, this means that humans are becoming one with computers.

The proliferation of wearables has essentially elevated the intelligence of anyone who can afford to spend $150 for an iWatch or Google Glass, to the level of a supercomputer. We now take for granted being able to whisper a few instructions into our watches, like Dick Tracy, and have all the information of the Cloud at our disposal. (It may soon be feasible to actually have a computer implanted into our brains, possibly even curing Alzheimer’s.) Clearly, the implications for productivity are nearly limitless. Already, we are beginning to see this in the data and we believe we are in the very early innings of a true revolution – with no apologies to gloomsters like Northwestern University’s Robert Gordon who believed, and still do, that the era of radical innovation ended long ago.

One of the biggest challenges a professional investor faces is the tyranny of current prices. When they are relentlessly rising, as they were back in 2013 and 2014, clients extrapolate those indefinitely, and, for a long time, they are right to do so. The same thing happens on the downside in periods such as we are in right now.  But rising markets always turn down and falling ones always turn up. Those are unquestionable facts. We are getting closer to the point where this bear goes back into its cave for a nice long nap while a powerful young bull is ready to bust out of the pen it’s been cooped up in for what seems like an eternity. Get out your checkbook – it’s time to bet on the bull!

Back to the here and now. A wise man once said that if you are going to predict that something will happen, don’t be so foolish as to say when it will happen. You may have noticed, I’ve followed that advice, perhaps to an irritating degree, mainly because I truly have no clue when our current bull market, already so long in the horns, will succumb.

It also goes without saying, but I will anyway, that the sequence and details of future financial events are almost certain to be dramatically different than what I’ve suggested in this EVA edition. However, I believe the broad outline is likely to be roughly along these lines, including my exceedingly optimistic long-term outlook for America.

It dawned on me as I wrote the section about tax, tort, healthcare, and regulatory reforms that many readers were probably thinking: “Not in my lifetime – and I’m only 50!” First, of all, let me say that I’m jealous you’re just 50. Second, it is highly unlikely stocks will remain in a long-term bull market, or even continue to hover at such generous valuations, unless our country makes some truly dramatic changes. It can’t remain business as usual, persistently avoiding essential reforms, relying almost totally on the Fed.

Believe me, I will be a bull again, and likely a very lonely one at that. But it’s going to take a combination of lower valuations and a serious makeover of how this country operates. We can do it and I’m convinced we will do it. Hopefully, I’ll be able to convince some of you the next time fear is on the rampage.


Like Outside the Box?
Sign up today and get each new issue delivered free to your inbox.


It's your opportunity to get the news John Mauldin thinks matters most to your finances.

Important Disclosures

The article Outside the Box: Future Bull was originally published at mauldineconomics.com.


Make sure to get our FREE eBook "Understanding Options"....Just Click Here!

Monday, August 18, 2014

Low and Expanding Risk Premiums Are the Root of Abrupt Market Losses

By John Mauldin


Risk premiums. I don’t know anyone who seriously maintains that risk premiums are anywhere close to normal. They more closely resemble what we see just before a major bear market kicks in. Which doesn’t mean that they can’t become further compressed. My good friend John Hussman certainly wouldn’t argue for such a state of affairs, and this week for our Outside the Box we let John talk about risk premiums.

Hussman is the founder and manager of the eponymous Hussman Funds, at www.Hussmanfunds.com. Let me offer a few cautionary paragraphs from his letter as a way to set the stage. I particularly want to highlight a quote from Raghuram Rajan, who impressed me with his work and his insights when we spent three days speaking together in Scandinavia a few years ago. At the time he was a professor at the University of Chicago, before he moved on to see if he could help ignite a fire in India.

Raghuram Rajan, the governor of the Reserve Bank of India and among the few economists who foresaw the last financial crisis, warned last week that “some of our macroeconomists are not recognizing the overall build-up of risks. We are taking a greater chance of having another crash at a time when the world is less capable of bearing the cost. Investors say ‘we will stay with the trade because central banks are willing to provide easy money and I can see that easy money continuing into the foreseeable future.’ It’s the same old story. They add ‘I will get out before everyone else gets out.’ They put the trades on even though they know what will happen as everyone attempts to exit positions at the same time.”

As a market cycle completes and a bull market gives way to a bear market, you’ll notice an increasing tendency for negative day-to-day news stories to be associated with market “reactions” that seem completely out of proportion. The key to understanding these reactions, as I observed at the 2007 peak, is to recognize that abrupt market weakness is generally the result of low risk premiums being pressed higher. Low and expanding risk premiums are at the root of nearly every abrupt market loss. Day-to-day news stories are merely opportunities for depressed risk premiums to shift up toward more normal levels, but the normalization itself is inevitable, and the spike in risk premiums (decline in prices) need not be proportional or “justifiable” by the news at all. Remember this, because when investors see the market plunging on news items that seem like “nothing,” they’re often tempted to buy into what clearly seems to be an overreaction. We saw this throughout the 2000-2002 plunge as well as the 2007-2009 plunge.

Yesterday evening, another astute market observer in the form of my good friend Steve Cucchiaro, founder of Windhaven, joined a few other friends for an entertaining steak dinner; and then we talked long into the night about life and markets. It is difficult to be “running money” at a time like this. The market is clearly getting stretched, but there is also a serious risk that it will run away for another 10 or 15%. If you are a manager, you need to be gut-checking your discipline and risk strategies. If you’re a client, you need to be asking your manager what his or her risk strategy is. It’s not a matter of risk or no risk but how you handle it.

What is your discipline? What non-emotional strategy instructs you to enter markets and to exit markets? Is it all or nothing, or is it by sector? Are you global? If so, do you have appropriate and different risk premiums embedded in your strategies? Just asking…. John’s piece today should at least get you thinking. That’s what Outside the Box is supposed to do.

It’s an interesting week around the Mauldin house. All the kids were over Sunday, and we grilled steaks and later ended up in the pool, shouting and horsing around, all of us knowing that three of the seven would be off to different parts of the country the next day. I know that’s what adult children do, and as responsible parents we all want our children to be independent, but the occasion did offer a few moments for reflection. Sunday night we just told stories of days past and laughed and tried not to think too much about the future.

A friend of mine just came back from California and Oregon complaining about the heat. Dallas has been rather cool, at least for August. If this weather pattern somehow keeps up (and it won’t), I can see lots of tax refugees streaming into Texas from California.

Tomorrow (Thursday) my mother turns 97, and we will have an ambulance bring her to the apartment, where she wants to have her birthday party. She is bedridden but is absolutely insisting on this party, so my brother and I decided to let her have her way. Which isn’t any different from the way it’s always been. Have a great week.

You’re rich in family and friends analyst,
John Mauldin, Editor
Outside the Box

Stay Ahead of the Latest Tech News and Investing Trends...
Each day, you get the three tech news stories with the biggest potential impact.

Low and Expanding Risk Premiums Are the Root of Abrupt Market Losses

By John P. Hussman, Ph.D.
Through the recurrent bubbles and collapses of recent decades, I’ve often discussed what I call the Iron Law of Finance: Every long-term security is nothing more than a claim on some expected future stream of cash that will be delivered into the hands of investors over time. For a given stream of expected future cash payments, the higher the price investors pay today for that stream of cash, the lower the long-term return they will achieve on their investment over time.

The past several years of quantitative easing and zero interest rate policy have not bent that Iron Law at all. As prices have advanced, prospective future returns have declined, and the “risk premiums” priced into risky securities have become compressed. Based on the valuation measures most strongly correlated with actual subsequent total returns (and those correlations are near or above 90%), we continue to estimate that the S&P 500 will achieve zero or negative nominal total returns over horizons of 8 years or less, and only about 2% annually over the coming decade. See Ockham’s Razor and The Market Cycle to review some of these measures and the associated arithmetic.

What quantitative easing has done is to exploit the discomfort that investors have with earning nothing on safe investments, making them feel forced to extend their risk profile in search of positive expected returns. The problem is that there is little arithmetic involved in that decision. For example, if a “normal” level of short-term interest rates is 4% and investors expect 3-4 more years of zero interest rate policy, it’s reasonable for stock prices to be valued today at levels that are about 12-16% above historically normal valuations (3-4 years x 4%). The higher prices would in turn be associated with equity returns also being about 4% lower than “normal” over that 3-4 year period. This would be a justified response. One can demonstrate the arithmetic quite simply using any discounted cash flow approach, and it holds for stocks, bonds, and other long-term securities. [Geek's Note: The Dornbusch exchange rate model reflects the same considerations.]

However, if investors are so uncomfortable with zero interest rates on safe investments that they drive security prices far higher than 12-16% above historical valuation norms (and at present, stocks are more than double those norms on the most reliable measures), they’re doing something beyond what’s justified by interest rates. Instead, what happens is that the risk premium – the compensation for bearing uncertainty, volatility, and risk of extreme loss – also becomes compressed. We can quantify the impact that zero interest rates should have on stock valuations, and it would take decades of zero interest rate policy to justify current stock valuations on the basis of low interest rates. What we’re seeing here – make no mistake about it – is not a rational, justified, quantifiable response to lower interest rates, but rather a historic compression of risk premiums across every risky asset class, particularly equities, leveraged loans, and junk bonds.

My impression is that today’s near-absence of risk premiums is both unintentional and poorly appreciated. That is, investors have pushed up prices, but they still expect future returns on risky assets to be positive. Indeed, because all of this yield seeking has driven a persistent uptrend in speculative assets in recent years, investors seem to believe that “QE just makes prices go up” in a way that ensures a permanent future of diagonally escalating prices. Meanwhile, though QE has fostered an enormous speculative misallocation of capital, a recent Fed survey finds that the majority of Americans feel no better off compared with 5 years ago.

We increasingly see carry being confused with expected return. Carry is the difference between the annual yield of a security and money market interest rates. For example, in a world where short-term interest rates are zero, Wall Street acts as if a 2% dividend yield on equities, or a 5% junk bond yield is enough to make these securities appropriate even for investors with short horizons, not factoring in any compensation for risk or likely capital losses. This is the same thinking that contributed to the housing bubble and subsequent collapse. Banks, hedge funds, and other financial players borrowed massively to accumulate subprime mortgage-backed securities, attempting to “leverage the spread” between the higher yielding and increasingly risky mortgage debt and the lower yield that they paid to depositors and other funding sources.

We shudder at how much risk is being delivered – knowingly or not – to investors who plan to retire even a year from now. Barron’s published an article on target-term funds last month with this gem (italics mine): “JPMorgan's 2015 target-term fund has a 42% equity allocation, below that of its peers. Its fund holds emerging-market equity and debt, junk bonds, and commodities.”

On the subject of junk debt, in the first two quarters of 2014, European high yield bond issuance outstripped U.S. issuance for the first time in history, with 77% of the total represented by Greece, Ireland, Italy, Portugal, and Spain. This issuance has been enabled by the “reach for yield” provoked by zero interest rate policy. The discomfort of investors with zero interest rates allows weak borrowers – in the words of the Financial Times – “to harness strong investor demand.” Meanwhile, Bloomberg reports that pension funds, squeezed for sources of safe return, have been abandoning their investment grade policies to invest in higher yielding junk bonds. Rather than thinking in terms of valuation and risk, they are focused on the carry they hope to earn because the default environment seems "benign" at the moment. This is just the housing bubble replicated in a different class of securities. It will end badly.


Raghuram Rajan, the governor of the Reserve Bank of India and among the few economists who foresaw the last financial crisis, warned last week that "some of our macroeconomists are not recognizing the overall build-up of risks. We are taking a greater chance of having another crash at a time when the world is less capable of bearing the cost. Investors say 'we will stay with the trade because central banks are willing to provide easy money and I can see that easy money continuing into the foreseeable future.' It's the same old story. They add 'I will get out before everyone else gets out.' They put the trades on even though they know what will happen as everyone attempts to exit positions at the same time."

While we’re already observing cracks in market internals in the form of breakdowns in small cap stocks, high yield bond prices, market breadth, and other areas, it’s not clear yet whether the risk preferences of investors have shifted durably. As we saw in multiple early sell offs and recoveries near the 2007, 2000, and 1929 bull market peaks (the only peaks that rival the present one), the “buy the dip” mentality can introduce periodic recovery attempts even in markets that are quite precarious from a full cycle perspective. Still, it's helpful to be aware of how compressed risk premiums unwind. They rarely do so in one fell swoop, but they also rarely do so gradually and diagonally. Compressed risk premiums normalize in spikes.

As a market cycle completes and a bull market gives way to a bear market, you’ll notice an increasing tendency for negative day-to-day news stories to be associated with market “reactions” that seem completely out of proportion. The key to understanding these reactions, as I observed at the 2007 peak, is to recognize that abrupt market weakness is generally the result of low risk premiums being pressed higher. Low and expanding risk premiums are at the root of nearly every abrupt market loss. Day-to-day news stories are merely opportunities for depressed risk premiums to shift up toward more normal levels, but the normalization itself is inevitable, and the spike in risk premiums (decline in prices) need not be proportional or “justifiable” by the news at all. Remember this because when investors see the market plunging on news items that seem like “nothing,” they’re often tempted to buy into what clearly seems to be an overreaction. We saw this throughout the 2000-2002 plunge as well as the 2007-2009 plunge.

As I’ve frequently observed, the strongest expected market return/risk profile is associated with a material retreat in valuations that is then joined by an early improvement across a wide range of market internals. These opportunities occur in every market cycle, and we have no doubt that we will observe them over the completion of the present cycle and in those that follow. In contrast, when risk premiums are historically compressed and showing early signs of normalizing even moderately, a great deal of downside damage is likely to follow. Some of it will be on virtually no news at all, because that normalization is baked in the cake, and is independent of interest rates. All that’s required is for investors to begin to remember that risky securities actually involve risk. In that environment, selling begets selling.

Remember: this outcome is baked in the cake because prices are already elevated and risk premiums are already compressed. Every episode of compressed risk premiums in history has been followed by a series of spikes that restore them to normal levels. It may be possible for monetary policy to drag the process out by helping to punctuate the sell offs with renewed speculation, but there’s no way to defer this process permanently. Nor would the effort be constructive, because the only thing that compressed risk premiums do is to misallocate scarce savings to unproductive uses, allowing weak borrowers to harness strong demand. We don’t believe that risk has been permanently removed from risky assets. The belief that it has is itself the greatest risk that investors face here.

Like Outside the Box?

Sign up today and get each new issue delivered free to your inbox.


It's your opportunity to get the news John Mauldin thinks matters most to your finances.

Important Disclosures


Get your seat for our next free webinar "Trading ETF'S for Profits, Protection and Peace of Mind"....Just Click Here!

Saturday, June 21, 2014

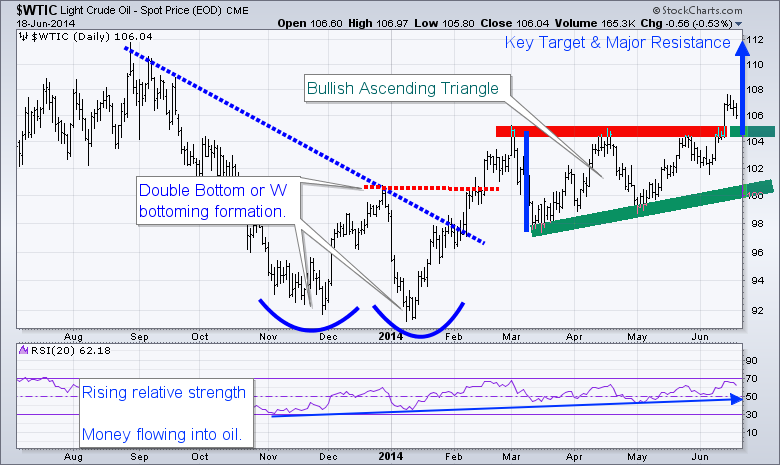
WTI Crude Oil on the Move $112 Next Stop

The energy sector has surged during the last two months which can be seen by looking at the XLE Energy Select Sector Fund. If crude oil continues to climb to the $112 level, XLE will likely continue to rally for another few days or possibly week as energy stocks are considered a leveraged way to play energy price movements.

Another way to look at this info is through the USO United States Oil Fund. This tracks much closer to the price of oil. The only issue is that many ETFs that “try to track” an underlying commodity is in how the funds are built. They own multiple contracts further into the future which does not exactly provide us with the short term news/event driven price movements in the current front month contract as they should.

What does this mumbo jumbo mean? Well, it means funds like USO and the highly respected UNG, and VIX ETFs… (just joking about the highly respected part), fail to track the underlying commodity or index very well when it comes to short term price movements. This means, you can nail the timing of a trade, and the commodity or index will move in your favor, yet your fund loses money, or goes nowhere...

Let’s Focus on the Technicals Now….


WTI crude oil has formed a bullish ascending triangle pattern from March to May of this year. The breakout to the upside is bullish and should be traded that way until the chart says otherwise. This breakout and first pullback must hold, or I will consider it a failed breakout. So if price dips and closes 2 days below the breakout level, it will be a major negative for oil in my opinion.

The range of the ascending triangle provides us with a measured move to the upside which is $112. Typically the first pullback after a breakout can be bought. The first short term target to scalp some gains would be $109, and at that point moving your stop to breakeven is a wise decision. Trading is all about managing capital and risk, if you don’t, then the market will take advantage of your lack in discipline.

Looking further back on the chart, you can see the double bottom formation also known as a “W” formation. Once the high of the “W” formation is broken the trend should be considered neural or up.

Also note that the RSI (relative strength) has been trending higher for some time now. This means money is rotating into this commodity. This is in line with my interview this week with Kerry Lutz and my recent article talking about the next bull market in commodities and the TSX (Toronto Stock Exchange).

clfutures


WTI Crude Oil Trading Conclusion:


In short, oil has some extra risk around it. The recent move has been partly fueled by news overseas. So at any time oil could get a lift or take a hit by news that hits the wires. I tent to trade news related events with much less capital than I normally do because of this risk.

Happy Trading,
Chris Vermeulen

WANT MORE TRADE IDEAS? GET THEM HERE: THE GOLD & OIL GUY.COM


Thursday, May 8, 2014

Is it Time to Admit That Gold Peaked in 2011?

By Jeff Clark, Senior Precious Metals Analyst

Have you seen this “real price of gold” chart that’s been making waves? Among other things, it purports to show the gold price adjusted for inflation over the past 223 years. Notice the 1980 vs. 2011 levels.


The chart makes it seem that on an inflation-adjusted basis, gold has matched its 1980 peak in 2011, or nearly so. A mainstream analyst who still thinks of gold as a “barbarous relic,” a government official who doesn’t want people to think of gold as money, or an Internet blogger looking for some attention might try to convince you that this proves that the gold bull market is over, arguing that the 2011 peak of $1,921 is the equivalent of the 1970s mania peak of $850 in January of 1980.

The logic is flawed, however; even if it were true that gold has matched its 1980 peak in inflation-adjusted prices, it would not prove that the top is in this time. This is not the 1970s, the global economy is under very different pressures, and there’s no rational basis at all for saying the top this time has to be at the same or similar level as last time.

That’s even if it were true that gold has matched its 1980 peak—but it hasn’t.

Inflation-Adjusted Gold Has NOT Matched Its 1980 Peak


First, if you go by official U.S. Bureau of Labor Statistic numbers, $850 in 1980 is equivalent to $2,320 in 2011, when gold hit its peak thus far in the current cycle. (It’s $2,403 in 2013 dollars, as is said to be used in the chart.)

We don’t know what data the authors of the chart used, nor their inflation adjustment method, so it’s hard to say what the problem is, but at the very least, we can say the chart is very misleading.

But there’s more. As you probably know, the government has made numerous changes to the way it calculates inflation—the Consumer Price Index (CPI)—since 1980. So, even the BLS number we’ve given grossly underestimates the real difference between the 2011 and 1980 peaks.

For a more apples to apples comparison, we should adjust for inflation using the government’s 1980 formula. And for that, whom better to ask than John Williams of Shadow Government Statistics (AKA Shadow Stats), the world’s leading expert on phony US government statistics?

I asked John to apply the CPI formula from January 1980 to the $1,921 gold price in 2011, to give us a more accurate inflation adjusted picture. Here’s what his data show.


Using the 1980 formula, the monthly average price of gold for January 1980 would be the equivalent of $8,598.80 today. The actual peak—$850 on January 21, 1980—isn’t shown in the chart, but it would equate to a whopping $10,823.70 today.

The Shadow Stats chart paints a completely different picture than the first chart. The current CPI formula grossly dilutes just how much inflation has occurred over the past 34 years. It’s so misleading that investment decisions based on it—like whether to buy or sell gold—could wreak havoc on a portfolio.

This could easily be the end of the discussion, but there are many more reasons to believe that the gold price has not peaked for the current bull cycle…...

Percentage Rise Has Been Much Smaller


Inflation adjusted numbers are not the only measure that matters. The percentage climb during the 1970s bull market was dramatically greater than what we experienced from 2001 to 2011. Here’s a comparison of the percentage gain during both periods.


From the 1970 low to the January 1980 peak, gold rose 2,346%. It climbed only 535% from the 2001 low to the September 2011 high—nowhere near mimicking that prior bull market.

Silver Scantly Participated in the 2011 Run-Up


After 31 years of trading, silver has yet to even reach its nominal price from 1980. It surged to $48.70 in 2011—but it hit $50 in January 1980.

On an inflation-adjusted basis, using the same data from John Williams, silver would need to hit $568 to match its 1980 equivalent.

The fact that silver has lagged this much—when its greater volatility would normally move its price by a greater percentage than gold—further shows that 2011 was not the equivalent of 1980.

No Bubble Characteristics in 2011


I’ll get some arguments from the mainstream on this one. “Of course gold was in a bubble in 2011—look at the chart!”

Yes, gold had a nice run-up that year. It rose 38.6% from January 1 to the September 6 peak. Anyone holding gold at that time was very happy. But that’s not a bubble. One of the major characteristics of a bubble is that prices go parabolic.

And that’s exactly what we saw in 1979-1980:
  • In the 12 months leading up to its January 21, 1980 peak, gold surged an incredible 270%.
  • In contrast, the year leading up to the September 6, 2011 peak, the price climbed 48%—very nice, but hardly parabolic, and less than a fifth of the 1970s runaway move.

No Global Phenomenon in 1980 (Next Time It Will Be)


In the 1970s, the “mania” was mostly a North American phenomenon. China and most of Asia didn’t participate. When inflation grips the world from all the money printing governments almost everywhere have engaged in, there will be a much greater demand for gold than in 1980.

When that day comes, there will be severe consequences for those who don’t have enough bullion. Not only will the price relentlessly move higher, but finding physical gold to buy may become very difficult.

Comparable Price Moves? So What?


The argument we started with is really the clincher. It doesn’t matter how today’s gold prices compare to those from prior bull markets; what matters are the factors likely to impact the price today. Are there reasons to own gold in the current environment—or not?

First, a comparison: Apple shares surged 112% in 2007. After such a run up, surely investors should’ve dumped it, right? Well, those who did likely regretted it, since it ended that year at $180 and trades over $590 today. In fact, even though it had already risen dramatically and in spite of it crashing with the market in 2008, there were plenty of solid reasons to buy the stock then, not the least of which was the introduction of the iPhone that year.

So should we sell gold because it rose 535% in a decade? As with the Apple example above, that’s not the right question.

There are, in fact, several more relevant questions for gold today:
  • What will happen with the unprecedented amount of money that’s been printed around the world since 2008?
  • Why are economies still sluggish after the biggest monetary experiment in history?
  • Global debt and “unfunded mandates” are at never-before-seen levels; how can this conceivably be paid off?
  • Interest rates are at historically low levels—what happens when they start to rise?
  • Regardless of your political affiliation, do you trust that government leaders have the ability and willingness to do what’s necessary to restore the economy to health?
If these issues were absent, maybe we’d change our position on precious metals. But until the word “healthy” can honestly be used to describe the fiscal, monetary, and economic state of our global civilization, gold should be held as an essential wealth-protection asset.

Today’s volatile world is exactly the kind of circumstance gold is best for.

The message here is clear, my friends. Regardless of the measure, gold has not matched its 1980 peak. And the reasons to own it have not faded. Indeed, they have grown. Continue to accumulate.

Learn about the best ways to invest in gold—how and when to buy it, where to store it for maximum safety, and how to find the best gold stocks—in the free 2014 Gold Investor’s Guide.

The article Time to Admit That Gold Peaked in 2011? was originally published at Casey Research


Check out our Advanced Study on Trading the Opening Gap in Crude Oil CL


Tuesday, February 25, 2014

Why the Resource Supercycle Is Still Intact

By Rick Rule, Chairman and Founder, Sprott Global Resource Investments

Natural resource based industries are very capital intensive, and hence extremely cyclical. It is not unreasonable to say that as a natural resource investor, you are either contrarian or you will be a victim.

These markets are risky and volatile!


Why Cyclicality?


Let's talk about cyclicality first. Some of the cyclicality of these industries is a function of their being extraordinarily capital intensive. This lengthens the companies' response times to market cycles.

Don't miss this weeks free webinar "The Big Trade with John Carter"....Just Click Here

Strengthening copper prices, for example, do not immediately result in increased copper production in many market cycles, because the production cycle requires new deposits to be discovered, financed, and constructed......a process that can consume a decade.

Price declines—even declines below the industry's total production costs—do not immediately cause massive production cuts. The "sunk capital" involved in discovery and construction of mining projects and attendant infrastructure (such as smelters, railways, and ports) causes the industry to produce down to, and sometimes below, their cash costs of production.

Producers often engage in a "last man standing" contest, to drive others to mothball productive assets, citing the high cost of shutdown and restart. They fail to mention their conflicts of interest as managers, whose compensation is linked to running operational mines.

Interest-rate cycles can raise or lower the cost and availability of capital, and the accompanying business cycles certainly influence demand. Given the "trapped" nature of the industry's productive assets, local political and fiscal cycles can also influence outcomes in natural-resource investments.

Today, I believe that we are still in a resource "supercycle," a long-term period of increasing commodity prices in both nominal and real terms. The market conditions of the past two years have made many observers doubt this assertion. But I believe the current cyclical decline is a normal and healthy part of the ongoing secular bull market.

Has this happened in the past?


The most striking analogy to the current situation occurred in the epic gold bull market in the 1970s. Many of you will recall that in that bull market, gold prices advanced from US$35 per ounce to $850 per ounce over the course of a decade. Fewer of you will recall that in the middle of that bull market, in 1975 and 1976, a cyclical decline saw the price of gold decline by 50%, from about $200 per ounce down to about $100 per ounce. It then rebounded over the next six years to $850 per ounce.

Investors who lacked the conviction to maintain their positions missed an 850% move over six short years. The current gold bull market, since its inception in 2000, has experienced eight declines of 10% or greater, and three declines—including the present one—of more than 20%.

This volatility need not threaten the investor who has the intellectual and financial resources to exploit it.

The natural-resources bull market lives…


The supercycle is a direct result of several factors. The most important of these is, ironically, the deep resource bear markets which lasted for almost two decades, commencing in 1982.

This period critically constrained investment in a capital-intensive industry where assets are depleted over time.

Productive capacity declined in every category; very little exploration took place; few new mines or oilfields replenished reserves; infrastructure and processing assets deteriorated. Critical human-resource capabilities suffered as well; as workers retired or got laid off, replacements were neither trained nor hired.

National oil companies (NOCs) exacerbated this decline in many nations by milking their oil and gas industries to subsidize domestic spending programs for political gain. This was done at the expense of sustaining capital investments. The worst examples are Mexico, Venezuela, Ecuador, Peru, Indonesia, and Iran. I believe 25% of world export crude capacity may be at risk from failure of NOCs to maintain and expand their productive assets.

Demands for social contributions in the form of taxes, royalties, carried equity interests, social or infrastructure contributions, and the like have increased. Voters are not concerned that producers need real returns to recover from two decades of underinvestment or to fund capital investments to offset depletion. Today this is actively constraining investment, and hence supply.

Poor people getting richer…


The supercycle is also driven by globalization and the social and political liberalization of emerging and frontier markets. As people become freer, they tend to become richer.

As poor countries become less poor, their purchases tend to be very commodity centric, especially compared to Western consumers. For the 3.5 billion people at the bottom of the economic pyramid, the goods that provide the most utility are material goods and consumables, rather than the information services or "high value-added" goods.

A poor or very poor household is likely to increase its aggregate calorie consumption—both by eating more food and more energy-dense food like meat. They will likely consume more electrical power and motor fuel and upgrade their home from adobe or thatch to higher-quality building materials. As people's incomes increase in developing and frontier markets, the goods they buy are commodity-intensive, which drives up demand per capita. And we are talking billions of "capitas."

Rising incomes and savings among certain cultures in the Middle East, South Asia, and East Asia—places with a strong cultural affinity for bullion—have increased the demand for gold, silver, platinum, and palladium bullion. Bullion has been a store of value in these regions for generations, and rising incomes have generated physical bullion demand that has surprised many Western-centric analysts.

Competitive devaluation


The third important driver in this cycle has been the depreciation of currencies and the impact that has had on nominal pricing for resources and precious metals.

Most developed economies have consumed and borrowed at worrying levels. The United States federal government has on-balance-sheet liabilities of over $16 trillion, and off-balance-sheet liabilities estimated at around $70 trillion.

These numbers do not include state and local government liabilities, nor the likely liabilities from underfunded private pensions. Not to mention increased costs associated with more comprehensive health care and an aging population!

Many analysts are even more concerned about the debts and liabilities of other developed economies—Europe and Japan. In both places, debt-to-GDP ratios are greater than in the US. Europe and Japan are financing themselves through a combination of artificially low interest rates and more borrowing and money printing. This drives down the value of their currencies, helping their exports.

But which nations' leaders will stand firm and allow their export industries to wither as their domestic producers suffer from cheap competing foreign goods? If Japan's Abe is successful at increasing his country's exports at the expense of its competitors like Taiwan, Korea, or China, then his policies could lead to competitive devaluation. And how will the European community react, for that matter?

Loss of purchasing power in fiat currencies increases the nominal pricing of commodities and drives demand for bullion as a preferred savings vehicle.

The factors that have driven this resource supercycle have not changed. Demand is increasing. Supplies are constrained. Currencies are weakening. Thus I believe we remain in a secular bull market for natural resources and precious metals.

With that in mind, I would call the current market for bullion and resource equities a sale.

Where to invest?


Let's talk about a type of company most of us follow: mineral exploration companies, or "juniors." We often confuse the minerals exploration business with an asset-based business. I would argue that is a mistake.

Entities that explore for minerals are actually more similar to "the research and development" space of the mining industry. They are knowledge based businesses.

When I was in university, I learned that one in 3,000 "mineralized anomalies" (exploration targets) ended up becoming a mine. I doubt those odds have improved much in 40 years. So investors take a 1-in-3,000 chance in order to receive a 10-to-1 return.

These are not good odds. But understanding the industry improves them substantially.

Exploration companies are similar to outsourcing companies. Major mining companies today conduct relatively little exploration. Their competitive advantage lies in scale, financial stability, and engineering and construction expertise. Similar to how big companies in other sectors outsource certain tasks to smaller, more specialized shops, the big miners let the juniors take on exploration risk and reward the successful ones via acquisitions.

Major companies are punished rather than rewarded for exploration activities in the short term. Majors therefore tend to focus on the acquisition of successful juniors as a growth strategy.

Today, the junior model is broken. Many public exploration companies spend a majority of their capital on general and administrative expenses, including fundraising. Overlay a hefty administrative load on an activity with a slim probability of success, and these challenges become even more severe.

One response from the exploration and financial community has been to put less emphasis on exploration success and focus instead on "market success." In this model, rather than "turning rocks into money," the process becomes "turning rocks into paper, and paper into money."

One manifestation of that is the juniors' habit of recycling exploration targets that have failed repeatedly in the past but can be counted on to yield decent confirmation holes, and the tendency to acquire hyper-marginal deposits and promote the value of resources underground without mentioning the cost of actually extracting them.

The industry has been quite successful, during bull markets, at causing "sophisticated" investors to focus on exciting but meaningless criteria.

Being successful in natural resource investing requires you to make choices. If your broker convinces you to buy the sector as a whole, they will have lived up to their moniker—you will become "broker" and "broker."
We have already said that exploration is a knowledge-based business. The truth is that a small number of people involved in the sector generate the overwhelming majority of the successes. This realization is key to improving our odds of success.

"Pareto's law" is the social scientists' term for the so-called "80-20 rule," which holds that 80% of the work is accomplished by 20% of the participants.

A substantial body of evidence exists that it is roughly true across a variety of disciplines. In a large enough sample, this remains true within that top 20%—meaning 20% of the top 20%, or 4% of the population, contributes in excess of 60% of the utility.

The key as investors is to judge management teams by their past success. I believe this is usually much more relevant than their current exploration project.

It is important as well that their past successes are directly relevant to the task at hand. A mining entrepreneur might have past success operating a gold mine in French speaking Quebec. Very impressive, except that this same promoter now proposes to explore for copper, in young volcanic rocks, in Peru!

In my experience, more than half of the management teams you interview will have no history of success that shows that they are apt at executing their current project.

Management must be able to identify the most important unanswered question that can make or break the project. They must be able to say how that question or thesis was identified, explain the process by which the question will be answered, the time required to answer the question, how much money it will take. They also need to know how to recognize when they have answered the question. Many of the management teams you interview will be unable to address this sequence of questions, and therefore will have a very difficult time adding value.

The resource sector is capital intensive and highly cyclical, and we expect that the current pullback is a cyclical decline from an overheated bull market. The fundamental reasons to own natural resource and precious metals have not changed. Warren Buffett says, "Be brave when others are afraid, be afraid when others are brave." We are still "gold bugs." And even "gold bulls."

Rick Rule is the chairman and founder of Sprott Global Resource Investments Ltd., a full-service brokerage firm located in Carlsbad, CA. He has dedicated his entire adult life to different aspects of natural-resource investing and has a worldwide network of contacts in the natural-resource and finance worlds.

Watch Rick and an all-star cast of natural-resource and investment experts—including Frank Giustra, Doug Casey, John Mauldin, and Ross Beaty—in the must-see video "Upturn Millionaires," and discover how to play the turning tides in junior mining stocks, for potentially life changing gains. Click here to watch.

The article Why the Resource Supercycle Is Still Intact was originally published at Casey Research.com.


Don't miss this weeks free webinar "The Big Trade with John Carter"....Just Click Here