Showing posts with label RSI. Show all posts

Monday, January 26, 2015

Is this ETF Laying the Foundation for a Rally in Crude Oil?

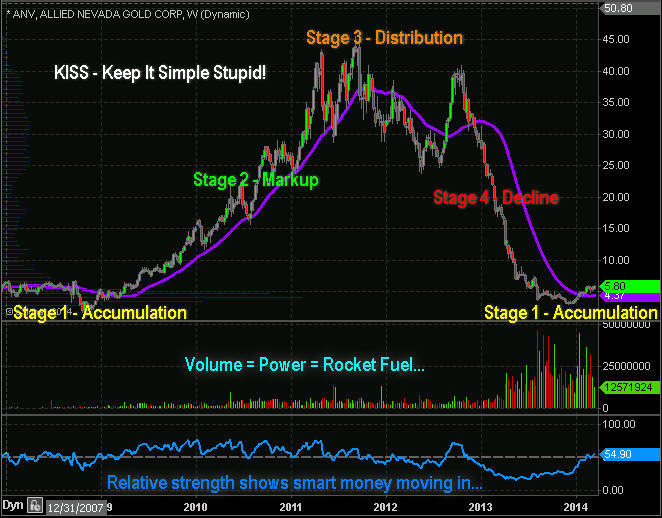
Picking bottoms is not something one should do if you're going to be a successful trader. But looking at market that may be forming a bottom is a good exercise, and one that you should be doing on a regular basis. I had done this before gold reversed to the upside traded over $1300 an ounce. Maybe it's time to look at crude oil and see if it's beginning to set itself up for a move to the upside.
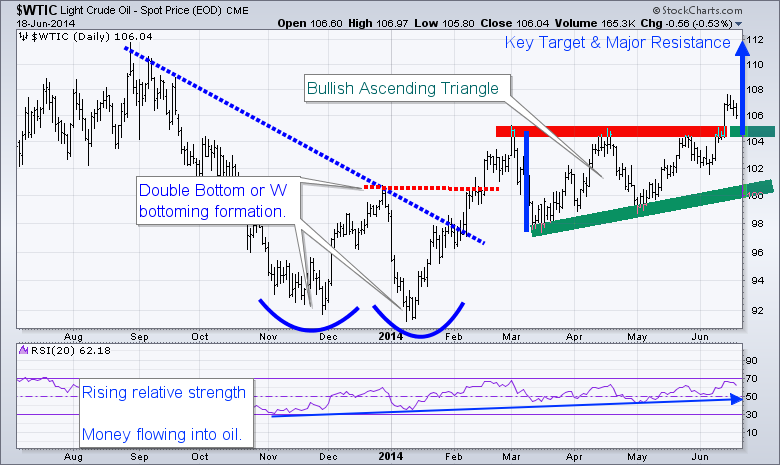
Technically, the Trade Triangles remain negative on crude oil, so there is no reversal showing up with those technical tools. The story is a little bit different with the RSI indicator. This particular indicator is showing that there is a big positive divergence on the Energy Select Sector SPDR ETF (PACF:XLE), and it is one that spans months.
Today I'm looking at the ETF XLE and the fact that if it closes higher for the week, it will be a positive sign. The previous week saw a very important Japanese candlestick formation call a "Dragon Fly Doji" this can be interpreted as a strong indication of reversal. It all depend's on how XLE closes this Friday.
Should XLE close higher than ($76.56) the market will have created a "Bullish Engulfing Line" confirming that the previous weeks, "Dragon Fly Doji" was indeed a reversal to the upside.
Take a look at both charts, one is a daily graph showing a large positive divergence on the RSI indicator. The other graph is a weekly Candlestick chart highlighting the “Dragon Fly Doji” and the potential for a “Bullish Engulfing Line” to occur this week.
So here is my 3 step strategy for the Energy Select Sector SPDR ETF (PACF:XLE):
1. I'm going to watch this market closely and have it on my radar.
2. I want to watch the 50 line on the RSI. A close over this line will be another important clue and strong indication that this market is bottoming or has bottomed out.
3. I'm also watching the weekly Trade Triangle on crude oil, should this Trade Triangle turn green, you'll want to BUY XLE, as it closely tracks crude oil.
Now let's see how the Energy Select Sector SPDR ETF (PACF:XLE) does in the future.
Every success with MarketClub,
Adam Hewison
President, INO.com
Co-Creator, MarketClub

Get all of Adams articles in your inbox and it's FREE....Just Click Here!

Saturday, June 21, 2014

WTI Crude Oil on the Move $112 Next Stop

The energy sector has surged during the last two months which can be seen by looking at the XLE Energy Select Sector Fund. If crude oil continues to climb to the $112 level, XLE will likely continue to rally for another few days or possibly week as energy stocks are considered a leveraged way to play energy price movements.

Another way to look at this info is through the USO United States Oil Fund. This tracks much closer to the price of oil. The only issue is that many ETFs that “try to track” an underlying commodity is in how the funds are built. They own multiple contracts further into the future which does not exactly provide us with the short term news/event driven price movements in the current front month contract as they should.

What does this mumbo jumbo mean? Well, it means funds like USO and the highly respected UNG, and VIX ETFs… (just joking about the highly respected part), fail to track the underlying commodity or index very well when it comes to short term price movements. This means, you can nail the timing of a trade, and the commodity or index will move in your favor, yet your fund loses money, or goes nowhere...

Let’s Focus on the Technicals Now….


WTI crude oil has formed a bullish ascending triangle pattern from March to May of this year. The breakout to the upside is bullish and should be traded that way until the chart says otherwise. This breakout and first pullback must hold, or I will consider it a failed breakout. So if price dips and closes 2 days below the breakout level, it will be a major negative for oil in my opinion.

The range of the ascending triangle provides us with a measured move to the upside which is $112. Typically the first pullback after a breakout can be bought. The first short term target to scalp some gains would be $109, and at that point moving your stop to breakeven is a wise decision. Trading is all about managing capital and risk, if you don’t, then the market will take advantage of your lack in discipline.

Looking further back on the chart, you can see the double bottom formation also known as a “W” formation. Once the high of the “W” formation is broken the trend should be considered neural or up.

Also note that the RSI (relative strength) has been trending higher for some time now. This means money is rotating into this commodity. This is in line with my interview this week with Kerry Lutz and my recent article talking about the next bull market in commodities and the TSX (Toronto Stock Exchange).

clfutures


WTI Crude Oil Trading Conclusion:


In short, oil has some extra risk around it. The recent move has been partly fueled by news overseas. So at any time oil could get a lift or take a hit by news that hits the wires. I tent to trade news related events with much less capital than I normally do because of this risk.

Happy Trading,
Chris Vermeulen

WANT MORE TRADE IDEAS? GET THEM HERE: THE GOLD & OIL GUY.COM


Thursday, June 19, 2014

Commodities Are Building Bases and About To Rally – Steel Market

Commodities in general have been under pressure for the last couple years. This can be seen by looking at the GCC Greenhaven Continuous Commodity ETF which holds a basket of resources. The weekly chart has formed a bullish bottom pattern, and as of last January it looks as though it’s now building a basing pattern. Overall commodities are in the very early stages of a stage 1 basing pattern and it looks as though it will be a few more months before any significant breakout will occur. But there could be some early entry points if you know what to look for…

A few days ago I talked about how commodities tend to perform well near the end of a bull market in the United States stock market. I also pointed out which hot index was going to benefit from this. In this article I want to bring your attention to the steel market. Using the SLX Steel ETF you can clearly see the bottoming pattern and basing pattern for this commodity. Currently steel is underperforming the stock market and is vulnerable to lower prices. But if we see a few things come together in the coming days or weeks, this could be a screaming buy.

My technical take on steel is this:


SLX has formed a bottoming pattern from January – mid March. It has since put in a strong impulse rally to make a higher high, and is now consolidating above key support. The RSI (Relative Strength) remains in a down trend, but if this starts to rise and SLX breaks above its recent highs around the $47.75 level I feel steel will start to rally with $50 being the next major whole number and previous high for steel to find some resistance.

Also price has been riding along the 200 day moving average which is acting as support. If price closes a couple of days below the 200 moving average I would consider this to be a bearish sign.

SLX


Steel Trading Conclusion:


In short, we are looking for the relative strength to start making new highs. Also we want to see a reversal bar on the SLX chart to the upside which we got on Tuesday. Or you can wait for a breakout and close above $47-48 area. Stop would be somewhere around the $45.75 area to start, then raise it as price rallies using intraday pivot lows on the 30 minute chart.

GET THESE REPORTS DELIVERED TO YOUR INBOX FREE > The Gold & Oil Guy.com


Sign up for one of our Free Trading Webinars....Just Click Here!


Sunday, March 16, 2014

Is this Gold's "Best of the Breed" a Golden Rocket!

Gold and gold stocks have be stabilizing for months and have been quietly rising. Many gold stocks are up 30% even 50% in the past three months. The $HUI AMEX Gold Bugs Index is up over 30% from the lows.

If you think you have missed most of the move already you are wrong. The truth is most of the biggest rallies in stocks take place after a basing pattern with 30 -50% or more has formed. This is signaling massive accumulation in gold stocks and its happening right now by the institutions.

So in this exclusive report I want to share one golden rocket stock pick which I feel has huge upside potential “IF” the precious metals market and miners can breakout of this stage 1 pattern it has formed.

One thing that excites me is about precious metals and gold stocks is the fact that we have heard nothing about gold, silver or mining stocks in the media for months… almost like the big institutions have told the media to avoid putting the spot light on it until they accumulate all they can in terms of physical bullion and stock shares.

This is the same for a few other sectors I have been watching build massive stage 1 bases in over the past few months and will be investing and actively trading them also once they break out of the basing stage.


Gold Stock Trading & Investing Success Formula

1. KISS – Keep It Simple Stupid! – Non one likes or follows complicated trading strategies

2. Understand and know how to identify the four market stages – Read My Book: Click Here

3. Know why and how stages must be traded for timing your entry, profit taking and exits.

4. Scan the market for the top performing sectors and focus on stocks/ETFs within those sectors.

5. Review all stocks and funds to meet setup criteria and trade only the best looking charts primed to start a new bull market (low overhead resistance nearby, strong relative strength, strong volume on breakout, 30 week SMA moving up etc..) Get this done for you: Click Here

6. Sit back, watch and monitor position for possible change in the stage, to adjust stops and identify profit taking levels.


Golden Rock Stock Pick

The chart below is top quality gold stock which has all the characteristics of a big winner. Just to be clear, I normally do not mention individual stocks within public reports. I am not compensated in any way to post this report. This is nothing more than my technical outlook on a stock and not investment advice. I do plan on buying some shares of this company this week or next.

Gold Forecast - Gold Stock Picks


Golden Rocket Conclusion:

While it still my be a little early for precious metals to bottom, it looks as though the stage (pardon the pun) has been set for a precious metals bull market to start. As they say, there is always a bull market somewhere… the key is finding it and taking the proper action.

If you want simple, hassle free trading and investing join my newsletter today.

  Just visit The Gold & Oil Guy

Sincerely,

Chris Vermeulen
Founder of Technical Traders Ltd. - Partnership Program

Check out our other "Gold and Crude Oil Trading Ideas"


Monday, February 3, 2014

Mondays Market Summary - Gold, Crude Oil, Natural Gas, SP 500 and Coffee

The DOW closed sharply lower on Monday as it extends the decline off January's high. Today's sell off was triggered by a sharp decline in telephone stocks, disappointment over auto sales by Ford and General Motors and reports that Jos. A. Bank Clothiers will not enter into takeover talks.

Are you one of the "New Millionaires"

The SP500 closed sharply lower [March contract] on Monday and below the 2012-2013 uptrend line crossing near 1744.00 confirming that am intermediate trend change is taking place. The low range close sets the stage for a steady to lower opening when Tuesday's night session begins trading. Stochastics and the RSI are oversold but remain neutral to bearish signaling that additional weakness is possible near term. If March extends this year's decline, the 25% retracement level of the 25% retracement level of 2012's rally crossing at 1692.03 is the next downside target. Closes above the 20 day moving average crossing at 1811.38 are needed to confirm that a short term low has been posted. First resistance is the 10 day moving average crossing at 1791.33. Second resistance is the 20 day moving average crossing at 1811.38. First support is today's low crossing at 1735.50. Second support is the 25% retracement level of 2012's rally crossing at 1692.03.


Get our Gold, Crude Oil& Index ETF Trading Analysis Newsletter

Crude oil closed lower due to profit taking on Monday as it consolidated some of the rally off January's low. Today's low range close sets the stage for a steady to lower opening when Tuesday's night session begins. Stochastics and the RSI are overbought but are turning neutral to bearish hinting that a short term top might be in or is near. Closes below the 20 day moving average crossing at 95.00 would confirm that a short term top has been posted. If March extends the aforementioned rally, the 87% retracement level of the December-January decline crossing at 99.58 is the next upside target. First resistance is the 75% retracement level of the December-January decline crossing at 98.47. Second resistance is the 87% retracement level of the December-January decline crossing at 99.58. First support is today's low crossing at 96.26. Second support is the 20 day moving average crossing at 95.06.

We are offering INO TV for FREE right now!

Natural gas [March contract] closed lower on Monday. The high range close sets the stage for a steady to higher opening on Tuesday. Stochastics and the RSI are bearish hinting that a pause in the rally is possible or that a short term top has been posted. Closes below the 20 day moving average crossing at 4.528 would confirm that a short term top has been posted. If March renews this winter's rally, monthly resistance crossing at 6.108 is the next upside target. First resistance is last Wednesday's high crossing at 5.486. Second resistance is monthly resistance crossing at 6.108. First support is the 10 day moving average crossing at 4.843. Second support is the 20 day moving average crossing at 4.528.

Here's detailed analysis on the March Natural Gas contract

Gold closed higher [April contract] on Monday. The mid range close sets the stage for a steady opening when Tuesday's night session begins trading. Stochastics and the RSI are neutral to bearish signaling that sideways to lower prices are possible near term. If April extends last week's decline, the reaction low crossing at 1215.30 is the next downside target. If April renews the rally off December's low, the 50% retracement level of the August-December decline crossing at 1306.20 is the next upside target. First resistance is last Monday's high crossing at 1280.10. Second resistance is the 50% retracement level of the August-December decline crossing at 1306.20. First support is the reaction low crossing at 1230.80. Second support is the reaction low crossing at 1215.30.

Here's our complete FREE trading webinar schedule, courtesy of Premier Trader University

Coffee closed sharply higher on Monday [March contract] as it extends this rally off November's low. The high range close set the stage for a steady to higher opening on Tuesday. Stochastics and the RSI are bullish signaling that sideways to higher prices are possible near term. If March extends the rally off November's low, last July's high crossing at 13.80 is the next upside target. Closes below the 10 day moving average crossing at 11.87 would confirm that a short term top has been posted.

Get our "Gold and Crude Oil Trade Ideas"


Tuesday, September 13, 2011

Adam Hewison: The Big Picture and the SP 500

Let’s take a look at the big picture and what it means today. There are a number times when the markets trade erratically. When this happens, you get out of the market with some quick move either up or down against you. Then, the market immediately goes your way the next day and afterwards you say to yourself, “I should’ve stayed in!”

That’s why it’s important to look at the big picture, and the big trends. What looked like a possible reversal yesterday, did not change the big trends in the markets. It just doesn’t happen in one day.

So let’s look at the big trends in the various markets we cover. Equity markets, the big trend is down. Metal markets, the big trend is up. Crude oil, the big trend is down. The dollar index, the big trend is up. And lastly, the CRB index, the big trend is down. Providing you are trading in the direction of the major trend, you have the odds in your favor. Always remember to keep your trading logs and game plan up to date. They will help you become a better trader.

Now let's look at where the SP 500 is headed.....

The two important lows that were established on August 26th and again on September 6th, around the 1140 area, are shaping up to be an important battleground for traders. The Bulls need to have this area remain intact in order for the market to go higher. The Bears must break through this area to continue the market’s downward trend. Long term traders should continue to be short or be out of the market completely, and in a cash position. Intermediate term traders should be on the sidelines waiting for either a buy or sell signal based on our Trade Triangle technology.

Monthly Trade Triangles for Long Term Trends = Negative
Weekly Trade Triangles for Intermediate Term Trends = Positive
Daily Trade Triangles for Short Term Trends = Negative
Combined Strength of Trend Score = – 75

The S&P 500 index closed higher due to short covering on Tuesday as it rebounds off August's uptrend line crossing near 1145.63. The high range close sets the stage for a steady to higher opening when Wednesday's night session begins trading. Stochastics and the RSI are bearish signaling that sideways to lower prices are possible near term.

Closes below the aforementioned uptrend line would confirm an end to the corrective rally off August's low while opening the door for a possible test of August's low crossing at 1093.50 later this fall. Closes above last Thursday's high crossing at 1197.70 would temper the near term bearish outlook.

First resistance is last Thursday's high crossing at 1197.70. Second resistance is the late August high crossing at 1223.00. First support is the reaction low crossing at 1113.20. Second support is August's low crossing at 1093.50.


An Alternative to Gold That You May Find Interesting

Tuesday, April 5, 2011

Sign up to Receive Your FREE, 10 Lesson Email Trading Course Now

Discover the tactics, tools, and tips the Pros use to go for bigger gains

Sign-up to receive your FREE, 10-lesson email trading course now.

Many investors believe there is some very good money to be made from trading, and they're right, there is.

Unfortunately, the instant they dip their toes in water, they are bombarded with complex sounding concepts and names, like stochastics and Fibonacci retracements, quickly feel overwhelmed, and give up before even getting started...

That's a real shame because taking advantage of these tools and techniques is actually much easier than it seems.

All in all, we've been in the trading biz for many years and credit our financial success to our trading mentors. We created this course as a way to give back and share the trading tips and techniques that we still use in our trading today.

We've specifically designed it to 'demystify' the trading basics and help you launch your success rate, and profits, to a whole new level.

Sign up now to receive these Ten FREE trading lessons and you'll discover...

* Why attitude is a trader's biggest advantage
* The importance of psychology in price movement
* How to spot mega trends
* Understanding of technical price objectives
* How to picture price objectives
* How to trade with moving averages
* How to use the RSI indicator
* How to correctly use stochastics in your trading
* How to use the ADX indicator to capture trends
* How to capitalize on natural market cycles

Plus, you will you will learn all about Fibonacci retracements, MACD, Bollinger Bands and much more.

Use this registration link to Sign-up to receive your FREE, 10 lesson email trading course now!


Share

Monday, September 20, 2010

Diversification Doesn't Work Anymore

Find out how Wall Street has sold the myth of safety in diversification for years to unsuspecting investors everywhere.

Now you can learn from this timely 10 page report that exposes the myth of diversification and how it can cripple your financial future if you do it the Wall Street way.

This Is Not About Derivatives
Before I go any further, we are not talking about exotic derivatives, the kind that tanked the economy and sent a financial tsunami through Wall Street. No, we’re talking about the major markets, mainstream shares, the kind of shares you hear and read about every day.

We Have A Solution
In this in depth report on diversification, you will learn how one simple adjustment can easily open up the money spigots and turn the tables on Wall Street. This one simple adjustment can put your account in the black faster than you can go to our website. This new solution, which we fully reveal, can turn your retirement account into the financial powerhouse that it deserves to be.

A Non Wall Street Portfolio
Also included in the report is a model portfolio that proves that diversification can work when it's done the right way. Using the Wall Street method of diversification you would have lost close to 30% of your money! In the “Global Strategy Portfolio” included in the report, you would have made a 23% return on your money during the exact same timeframe. That’s an over 50% swing in just 30 short months. In the report we show you not only how to achieve these results, but we also share the rules that you need to follow in order to get the exact same results in half the time, with less risk.

What Is The Cost?
If you do nothing and don’t download this special report, it could cost you thousands of dollars in losses in your portfolio over the next few months. However, if you call or click on the link below, the report is free of charge along with our “Global Strategy Portfolio.”

ACT NOW AND RECEIVE THIS REPORT BY EMAIL

Call or click to receive your personal copy of this timely report and it can be in your hands in the next 3 minutes. This report is free of charge and there is no obligation. We guarantee that this report on diversification will have you laughing all the way to the bank.

Click HERE to get your report immediately!


Share

Monday, August 2, 2010

This Year, Write Your Own Success Story

BEGIN WITH ...

ONLINE EDUCATION: We have hundreds of online trading videos and trading courses to show you how to trade and how the markets really work.

SUPERIOR TECHNOLOGY: "Talking Charts" and our "Trade Triangle" technology are just two winning trading tools that give you unbiased advice and a personal success formula that has produced returns in excess of *100% for each of the past three years.

SUCCESS STORIES: Every day we receive success stories from successful members who are benefiting from our educational and market timing "Trade Triangle" technology.

NOW IT'S YOUR TURN.....to write your very own success story

You begin by taking a 30 day risk free trial to MarketClub. You will have total freedom to try out all of the easy to use features of our service. Be sure to take in as many trading courses and videos as you can during your trial.

Make the rest of your year count.....try us out today. Just Click Here to get your 30 day risk free trial to MarketClub.

You + MarketClub = a winning combination

Every success,
The Team at the Stock Market Club


Share

Tuesday, July 20, 2010

New Video: Is it Time to Buy Gold?

It would appear that the euphoria over gold has quickly diminished and many of gold's greatest proponents, who were calling for gold to go over $2,000 an ounce, appear to be disheartened and shell shocked by the recent sharp downturn in gold.

There's an old adage in trading and it goes like this, "they slide faster than they glide." This is true of all markets and what it means is they go down faster than they go up.

In our new video on gold, we share with you some of the thoughts we have right now on this market. We could be looking at some great buying opportunities if just a few components fall into place.

As always there is no charge and no registration required to watch this video.

Watch > Is it Time to Buy Gold?


Share

Friday, June 25, 2010

New Video: Do You Know About Market Divergences?

In the market there are two types of market divergences that can occur....a bullish divergence and a bearish divergence. Both of these divergences are important and you need to know how they work and how you can benefit from this knowledge.

In this short educational trading video, we will show you the tools we use to spot market divergences. We will be using the Relative Strength Indicator (RSI) and the Moving Average Convergence Divergence indicator (MACD) which was developed by our friend Gerald Appel.

As always our videos are free to watch and there are no registration requirements. Please feel free to leave a comment on this or any of our other videos.


Watch "Do You Know About Market Divergences?"


Share

Friday, June 11, 2010

New Video: The Battle of the Bull and Bears

The battle between the Bulls and Bears continues with very choppy trading action. The rally from a potential double bottom is cause for concern for the Bears, however the Bulls are in a similar situation as they have to prove their case with sustained market action.

In our new video, we outline some of the key levels that we think are important in the S&P 500 market. Volume continues to to be light and that is why the markets are moving around and are so volatile at the moment.

This is our first video this week, but expect many more as the market rotates. Don't miss our special risk free trial offer to MarketClub, my premium charting service, offered at the end of this video.


Just click here to watch "The Battle of the Bull and Bears"


Share

Friday, March 26, 2010

New Video: Dollar Index Going Higher?


It has been a while since we looked at the dollar index, so today we decided to dissect this market and look at it step by step.

What is happening in this market is very interesting and we think you will see in this short video just what we have in mind.

Just click here to watch "Dollar Index Going Higher" and as always, our videos are free to watch and there are no registration requirements. Do you agree with our analysis of the dollar index? Please feel free to leave a comment and let us know what you think.


Also, take a few minutes to watch "Swoosh Goes Nike"


Share

Wednesday, January 20, 2010

Markets Continue to Slide, Bears Enjoy The Near Term Advantage


The S&P 500 closed lower on Wednesday and below the 10 day moving average crossing at 1138.36. The mid range close sets the stage for a steady to lower opening on Thursday. Stochastics and the RSI are neutral to bearish signaling that sideways to lower prices are possible near term. Closes below the 20 day moving average crossing at 1129.08 are needed to confirm that a short term top has been posted. If March resumes this winter's rally, the 62% retracement level of the 2007-2008 decline crossing at 1155.15 is the next upside target. First resistance is last Monday's high crossing at 1147.90. Second resistance is the 62% retracement level of the 2007-2008 decline crossing at 1155.15. First support is today's low crossing at 1125.30. Second support is the reaction low crossing at 1110.00.

The NASDAQ 100 closed lower on Wednesday and below the 20 day moving average crossing at 1870.77. The mid range close sets the stage for a steady to lower opening on Thursday. Stochastics and the RSI remain bearish signaling that sideways to lower prices are possible near term. Closes below last Tuesday's low crossing at 1850.0 are needed to confirm that a short term top has been posted. If March renews this winter's rally, the 75% retracement level of the 2007-2008 decline on the weekly continuation chart crossing at 1947.00 is the next upside target. First resistance is last Monday's high crossing at 1900.00. Second resistance is the 75% retracement level of the 2007-2008 decline crossing at 1947.00. First support is last Tuesday's low crossing at 1850.00. Second support is today's low crossing at 1845.50.

The Dow closed lower on Wednesday as tightening credit in China; changes in the U.S. political landscape and lackluster earnings lead to today's sharp sell off. The mid range close sets the stage for a steady to lower opening on Thursday. Stochastics and the RSI are bearish signaling that sideways to lower prices are possible near term. If the Dow extends this week's decline, the reaction low crossing at 11423 is the next downside target. First resistance is Tuesday's high crossing at 10721. Second resistance is the 62% retracement level of the 2007-2008 decline crossing at 11249. First support is today's low crossing at 10,517. Second support is the reaction low crossing at 10,423.

The U.S. Dollar closed sharply higher on Wednesday and above the 20 day moving average crossing at 77.79 confirming that a low has been posted. The high range close sets the stage for a steady to higher opening on Thursday. Stochastics and the RSI are bullish signaling that sideways to higher prices are possible near term. If March extends this week's rally, December's high crossing at 78.77 is the next upside target. Closes below the 10 day moving average crossing at 77.48 would confirm that a short term top has been posted. First resistance is today's high crossing at 78.64. Second resistance is December's high crossing at 78.77. First support is the 20 day moving average crossing at 77.79. Second support is Tuesday's low crossing at 77.09.

Share

Wednesday, January 13, 2010

Bulls Struggle Against Bearish Stochastic/RSI Signals


The S&P 500 was slightly higher due to short covering overnight as it consolidates some of Tuesday's decline. Stochastics and the RSI have turned bearish hinting that a short term top might be in or is near. Closes below the 20 day moving average crossing at 1121.14 are needed to confirm that a short term top has been posted.

If March extends this winter's rally, the 62% retracement level of the 2007-2008 decline crossing at 1155.15 is the next upside target.

Wednesday's pivot point, our line in the sand is 1137.27

First resistance is Monday's high crossing at 1147.90
Second resistance is the 62% retracement level of the 2007-2008 decline crossing at 1155.15

First support is the 10 day moving average crossing at 1131.71
Second support is the 20 day moving average crossing at 1121.14

Double Tops and Pivot Points Explained

The NASDAQ 100 was steady to slightly higher overnight as it consolidates some of Tuesday's decline. However, stochastics and the RSI have turned bearish hinting that a short term top might be in or is near. Closes below the 20 day moving average crossing at 1854.50 would confirm that a short term top has been posted.

If March renews this winter's rally, the 75% retracement level of the 2007-2008 decline on the weekly continuation chart crossing at 1947.00 is the next upside target.

First resistance is Monday's high crossing at 1900.00
Second resistance is the 75% retracement level of the 2007-2008 decline on the weekly continuation chart crossing at 1947.00

First support is the 20 day moving average crossing at 1854.50
Second support is Tuesday's low crossing at 1850.00

Dennis Gartman’s 22 Rules of Trading

The U.S. Dollar was lower overnight as it extends this week's decline. Stochastics and the RSI remain bearish signaling that additional weakness is possible near term. If March extends the decline off December's high, the 50% retracement level of the November-December rally crossing at 76.66 is the next downside target. Closes above the 20 day moving average crossing at 77.87 are needed to confirm that a short term low has been posted.

First resistance is the 10 day moving average crossing at 77.68
Second resistance is the 20 day moving average crossing at 77.87

First support is the overnight low crossing at 76.86
Second support is the 50% retracement level of the November-December rally crossing at 76.66

Free trade school video....Candlestick Formations You Need To Learn

Share

Thursday, January 7, 2010

Stock Market Club Commentary For Thursday Evening


The S&P 500 closed higher on Thursday as it extends this week's rally. The high range close sets the stage for a steady to higher opening on Friday. Stochastics and the RSI are overbought but remain bullish signaling that sideways to higher prices are possible near term. If March extends this week's rally, the 62% retracement level of the 2007-2008 decline crossing at 1155.15 is the next upside target. Closes below the 20 day moving average crossing at 1113.39 are needed to confirm that a short term top has been posted. First resistance is today's high crossing at 1135.80. Second resistance is the 62% retracement level of the 2007-2008 decline crossing at 1155.15. First support is the 10 day moving average crossing at 1124.44. Second support is the 20 day moving average crossing at 1113.38.

The NASDAQ 100 closed lower on Thursday and below the 10 day moving average crossing at 1872.45 signaling that a short term top has likely been posted. The low range close sets the stage for a steady to lower opening on Friday. Stochastics and the RSI are overbought and are neutral hinting that a short term top might be in or is near. Closes below the 20 day moving average crossing at 1838.35 are needed to confirm that a short term top has been posted. If March extends last month's rally, the 75% retracement level of the 2007-2008 decline on the weekly continuation chart crossing at 1947.00 is the next upside target. First resistance is Wednesday's high crossing at 1891.75. Second resistance is the 75% retracement level of the 2007-2008 decline crossing at 1947.00. First support is today's low crossing at 1865.75. Second support is the 20 day moving average crossing at 1838.35.

The Dow closed higher on Thursday and the high range close sets the stage for a steady to higher opening on Friday. Stochastics and the RSI are overbought but are bullish signaling that sideways to higher prices are possible near term. If the Dow extends this week's rally, the 62% retracement level of the 2007-2008 decline crossing at 11249 is the next upside target. Closes below the 20 day moving average crossing at 10474 are needed to confirm that a short term top has been posted. First resistance is Monday's high crossing at 10604. Second resistance is the 62% retracement level of the 2007-2008 decline crossing at 11249. First support is today's low crossing at 10,505. Second support is last Thursday's low crossing at 10,423.


How To Find Winning Trades In Any Market


Share

Wednesday, June 17, 2009

New Video: S&P 500 - A Correction or a Major Turn?


With the S&P 500 falling to a fresh two week low, the big question is....is this a correction, or the start of a major trend on the downside?

We have just finished a short video that details many of the key concerns that we have for this market. If you have not seen our videos before you may enjoy this one. This video does not require a plug-in.

The video is free to watch and there is no need to register. We would like to get your feedback about this video so please leave a comment here on our blog.

Just Click Here To Watch Video


Wednesday, June 10, 2009

My Favorite Indicator Of Inflation....And It's Not Gold

There is an indicator which has been around since 1957. It has accurately forecasted every inflationary and deflationary cycle since.

This is my number one indicator for large cyclic trends. You may want to watch this index carefully should you want to invest in certain stocks and commodity related markets.

Over the last half century, this index has seen some remarkable moves both on the upside and more recently on the downside. I believe that this is the indicator that everyone should watch. If you trade stocks or futures and are interested in world trade trends, this is the indicator to track.

Click here to watch video

The tenth revision of this index renamed it the Reuters-Jefferies CRB Index (NYBOT_CR) You can easily track this indicator everyday using MarketClub.

You can learn more about this index from our Trader’s Blog.
Here is a list of the 19 markets that are included in the RJ/CRB index as implemented in the 2005 revision:

Metals: aluminum, copper, gold, nickel, silver
Energies: crude oil, heating oil, natural gas, unleaded gas
Grains: corn, soybeans, wheat
Food & Fiber: cocoa, coffee, cotton, orange juice, sugar
Livestock: lean hogs, live cattle

Take a few minutes to watch this Your keywordshort video and see how you can benefit from this indicator. There is no fee and there is no registration required.

Enjoy the video and please feel free to leave a comment, letting our readers know what you think.

Click here to watch video

Free online tour of MarketClub...Just Click Here For a risk FREE 30 day test drive

Today’s Stock Market Club Trading Triangles

Tuesday, May 26, 2009

New Trading Video: SP 500 17 Week Cycle?

I was just looking at the S&P 500 and noticed a very pronounced cycle in this market that I want to share with you.

In my new video I explain exactly what I’ve seen and what I expect will happen to this market if this cycle continues on track.

You can view this new video with my compliments. There are no registration requirements. Please enjoy and give your feedback by leaving a comment for us.

Today’s Stock Market Club Trading Triangles

Friday, May 15, 2009

New Video "Apple vs. RIMM, The Battle Of The Titans"


It is the battle of the tech titans as both RIMM and Apple battle for the smartphone market share. Although Research In Motion is a well established tech giant as the creator of the BlackBerry, they may have hit a wall with Apple, Inc.’s launch of the phenomenally popular iPhone.

This tech battle may create a way to trade these markets with a lower risk. During this latest rally, RIMM did not perform well, nor were the changes in price as exuberant as the shares for AAPL.

We are looking for the general market to show weakness through the next week… with that said, we expect to see RIMM slide faster than AAPL. It may be conservative trading strategy to buy Apple and short Research In Motion. Take an equal amount of money for each market and buy a corresponding number of shares to balance the positions and decrease risk.

This is what we call “pair trading.” You’re looking for the percentage change in the market between RIMM and Apple to move in Apple’s favor no matter which direction APPL or RIMM head.

In our new short video, you will learn why I came up with this strategy and why it may offer a low-risk trade in the current market environment.


As always, the videos are free to watch and there is no requirement for registration.


Where do you think Apple and RIMM are header, or the NASDAQ as an index? Please feel free to leave a comment!


Today’s Stock Market Club Trading Triangles


=====================================================================================