Our research team believes Crude Oil and Energy, in general, has stalled near major resistance and maybe setting up a big downside move as the COVID-19 virus continues to roil regional and global economies.
The recent news that the COVID-19 virus cases have skyrocketed suggests further economic shutdowns may push oil prices below $35 ppb over the next few weeks and months. Our researchers believe Oil has already set up a resistance level near $42 and will begin to move lower as concerns about the economic recovery transition through expectations related to oil demand going forward. We believe the renewed global economic demand for oil will present a very real possibility that oil could collapse below $35 ppb over the next 30 days.
We believe this pending downside move in Crude Oil will set up a great trade opportunity in ERY, the Direxion Bear Energy 2x ETF. At this point in time, we are just waiting for the technical confirmation of this trade trigger. Once we receive confirmation from our price modeling systems, we believe ERY may rally 20% to 30% or more from current levels....Continue Reading Here.
Our research team warned of this move in crude oil back on October 7, 2018. At that time, we warned that oil may follow a historical price pattern, moving dramatically lower and that lows near $65 may become the ultimate bottom for that move. Here we are with a price below that level and many are asking “where will it go from here?”.
We believe the support near $65, although clearly broken, may eventually become resistance for a future upside price move. Our proprietary Fibonacci price modeling system is suggesting a new target near $52.00 - $53.00 and we believe this downside move in crude oil is far from over at this point.
The current global climate for oil is that suppliers are pumping more and more oil into the market at a time when, historically, prices should continue to decline. One of our research tools includes the ability to identify overall bias models for each week, month or quarter. Historically, crude oil is dramatically weaker in the month of November and relatively flat for the month of December.
Analysis for the month of November = 11
* Total Monthly Sum : -44.52000000000001 across 36 bars
Analysis for the month of December = 12
* Total Monthly Sum : -0.699999999999922 across 36 bars
We believe the price of oil will continue to drift lower to target the $52.00 - $53.00 Fibonacci support level before attempting to find any real price support. This equates to an addition -6 to -8% price decline for skilled traders. We will alert you with a new research post as this downward price move continues or new research becomes available.
We have been calling these types of market moves all year and recently called the top in the U.S. equity markets nearly 40 days before it happened. Want to know what we think is going to happen for the rest of 2018 and into early 2019? Visit the Technical Traders Free Research to read all of our public research posts. Isn’t it time you invested in a team of researchers and tools to assist you in finding greater trading success?
Our research team is writing this message to alert all investors and traders of a pending rotation in the U.S. stock market that may happen between now and November 15th. The upside price breakout that is occurring on November 7th, the day after the US mid-term elections, is an incredible display of global investor sentiment regarding the GOP success in the Senate and the continued business friendly expectations originating out of Washington DC. The move, today, shows how clearly a global capital market shift is still engaged in the U.S. markets and how much global investors are counting on the US to drive ROI and economic growth going forward.
Yet, we feel it is important to urge investors that our modeling systems are still suggesting an ultimate price bottom should be setting up near November 8th - 15th and that we could still see a bit of downward price rotation over the next few days before this ultimate price bottom completes. It might be too easy to get caught up in this move, today, and fail to properly understand the price rotation risks that are still active in the time/price horizon.
The ES is currently +48.00 as of the creation of this post (+1.74%). This is an incredible move higher and the 2790 level becomes critical support for the markets as long as price is able to stay above that level.
The NQ is currently +172.50 (+2.45%) and shows just how clearly investors are piling into technology, healthcare and bio-tech after the US elections. This is a real vote from investors that they believe President Trump will be able to navigate any issues going forward and that the US economy will continue to push out strong numbers.
Follow our analysis to read our most recent research posts. We have already positioned our members for this “ultimate bottom” that our predictive modeling systems suggest is in the midst of forming. We called this entire downside move, bottom rotation and the ultimate bottom pattern setting up near November 12th back on September 17. If you want to learn how we can help you find and execute better trades, visit The Technical Traders to learn more.
* The 10 chart patterns ALL traders should know
* How to know when a chart pattern is producing an actionable signal
* What chart patterns are the most powerful
* Spot reversals using patterns
* How to call the top using patterns
And a whole lot more!
Take your emotions out of trading positions like.....crude oil, gold, coffee and sugar, just to name a few.
The crude oil, gold, coffee and sugar bulls took another beating this week and it's no surprise traders are dumping positions like crazy. Don't let your emotions get the best of you, put John's simple trading methods to work recognizing those reversals and be ready for them.
Our trading partner Mike Seery brings us his weekly call on crude oil, gold and coffee. Could crude oil really be headed lower? If king dollar gets it's way it just might be headed much lower. Here's what Mike has to say about this and other futures commodity trades.
Crude oil futures are up 30 cents in the January contract trading higher for the 2nd consecutive trading session as a short term bottom may have been placed as China cut their interest rate today sending crude oil sharply higher in early trade trading as high as 77.82 a barrel before retracing while currently trading at 76.22 if you are still short this market I would place my stop above the 10 day high which in Monday’s trade will come down to 77.92 risking around 170 points or $1,700 per contract. The U.S dollar was sharply higher and that’s generally very bearish the commodity markets, however with China cutting their interest rate that combated the negativity coming out of the Euro currency causing short covering across the board as many of the commodities including energies, metals, and the grain sector were all higher today but continue to place your stop loss at that level and see what Monday’s trade brings. The fundamentals in oil still remain very bearish as Saudi Arabia has not cut production & the United States continues its torrid pace of production flooding the world market so even if you are stopped out on this trade sit on the sidelines and wait for another trend to develop as I’m not totally convinced that lower prices aren’t ahead in 2015. Crude oil futures are still trading slightly below their 20 but still far below their 100 day moving average telling you the trend is still to the downside and if the U.S dollar continues to move higher that eventually will put pressure on prices once again in my opinion but on a day to day basis anything can occur.
TREND: LOWER
CHART STRUCTURE: EXCELLENT
As I talked about in yesterday’s blog I am telling investors to remain neutral as I do believe gold prices will remain choppy to lower for the rest of 2014 as prices rallied $9 to trade around $1,200 per ounce as extreme volatility has entered this market and I think today’s price action was very impressive due to the fact that the U.S dollar was up over 50 points which is generally very bearish precious metals, however China cut their interest rate pushing many commodities prices higher. Gold futures are trading above their 20 but below their 100 day moving average moving higher despite the fact that the ECB looks like they’re going to utilize more stimulus which is remarkable in my opinion as I do think if the U.S dollar continues to move higher eventually that will be very bearish gold prices so sit on the sidelines as you do not want to trade a choppy market. This market is extremely volatile with big up price swings and down swings so avoid and move on to a trendy market like the S&P 500. Volatility in gold is amazing lately with many days of a $30 – $50 trading range which is incredible going into the holiday season, however if you remember last year gold’s low was near December 31st and we opened up the next day around $20 higher and I think the same thing will happen because of the fact that stock sales which are losers are sold to offset winning trades come the month of December so I still look for another leg down but still would sit on the sidelines at the current time.
TREND: NEUTRAL
CHART STRUCTURE: POOR
Coffee futures in the March contract sold off around 600 for the trading week currently trading at 190.70 in New York with high volatility in the last week with several sharply higher and lower trading sessions as I am advising investors to stay away from this market as the trend is extremely choppy and difficult to trade successfully in my opinion. Coffee prices are trading right at their 20 & 100 day moving average telling you that the trend is neutral as this volatility will remain for months to come as weather in Brazil is very fickle on a week to week basis as drought concerns are still in the back of traders’ minds as the weather currently is positive for production. The chart structure in coffee presently is very poor as I like to trade markets with tight chart structure which allows you to place tighter stop losses lowering monetary risk in my opinion.
TREND: MIXED
CHART STRUCTURE: POOR
The energy sector has surged during the last two months which can be seen by looking at the XLE Energy Select Sector Fund. If crude oil continues to climb to the $112 level, XLE will likely continue to rally for another few days or possibly week as energy stocks are considered a leveraged way to play energy price movements.
Another way to look at this info is through the USO United States Oil Fund. This tracks much closer to the price of oil. The only issue is that many ETFs that “try to track” an underlying commodity is in how the funds are built. They own multiple contracts further into the future which does not exactly provide us with the short term news/event driven price movements in the current front month contract as they should.
What does this mumbo jumbo mean? Well, it means funds like USO and the highly respected UNG, and VIX ETFs… (just joking about the highly respected part), fail to track the underlying commodity or index very well when it comes to short term price movements. This means, you can nail the timing of a trade, and the commodity or index will move in your favor, yet your fund loses money, or goes nowhere...
Let’s Focus on the Technicals Now….
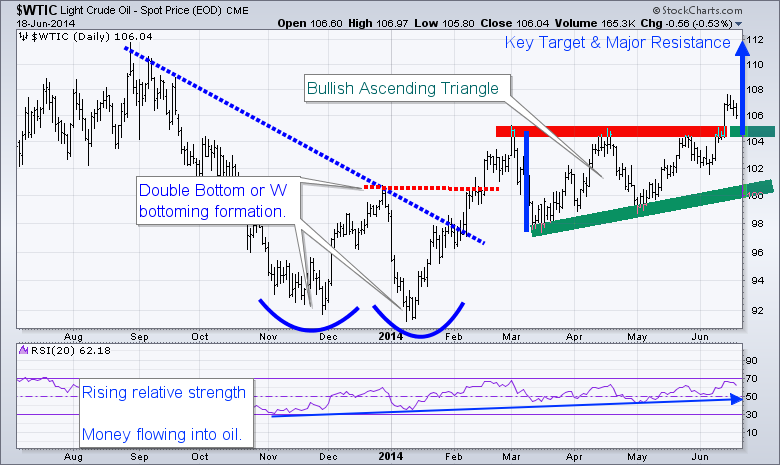
WTI crude oil has formed a bullish ascending triangle pattern from March to May of this year. The breakout to the upside is bullish and should be traded that way until the chart says otherwise. This breakout and first pullback must hold, or I will consider it a failed breakout. So if price dips and closes 2 days below the breakout level, it will be a major negative for oil in my opinion.
The range of the ascending triangle provides us with a measured move to the upside which is $112. Typically the first pullback after a breakout can be bought. The first short term target to scalp some gains would be $109, and at that point moving your stop to breakeven is a wise decision. Trading is all about managing capital and risk, if you don’t, then the market will take advantage of your lack in discipline.
Looking further back on the chart, you can see the double bottom formation also known as a “W” formation. Once the high of the “W” formation is broken the trend should be considered neural or up.
Also note that the RSI (relative strength) has been trending higher for some time now. This means money is rotating into this commodity. This is in line with my interview this week with Kerry Lutz and my recent article talking about the next bull market in commodities and the TSX (Toronto Stock Exchange).
WTI Crude Oil Trading Conclusion:
In short, oil has some extra risk around it. The recent move has been partly fueled by news overseas. So at any time oil could get a lift or take a hit by news that hits the wires. I tent to trade news related events with much less capital than I normally do because of this risk.
Crude oil was THE commodity to trade back in 2007-2008 when prices rocketed above $145 per barrel then dropped like a rock all the way back down to $35 per barrel leaving many investors and traders either greatly rewarded or dead broke.
Since then the focus of the world has moved to gold and silver as currencies spiral out of control with more and more reasons why individuals and entire countries should focus on owning physical metals rather than eroding currencies.
Just because a commodity is not under the direct spot light does not mean you can’t trade it or make money from it. With that said here is my analysis on how to trade oil if $100 per barrel is reached in the coming trading days.
Here you can see how oil is trading round the $100 level. When the price is trading below it then $100 will act as resistance and when oil is above then it becomes support.
How To Trade Oil ETF
Intermediate Term Daily Oil Trading Chart:
This is more of a close up look at oil and the $100 price point. Notice how oil has moved higher for an entire month without any real pullbacks and that it has a clean support trend line underneath. If oil sees some big sellers step in here at the $100 – $104 level then I expect the green support trend line to be broken. If that takes place oil could quickly and easily drop back down to the $90-$92 area.
How To Trade Crude Oil
How to Trade Oil Using an Oil ETF
This chart shows a long (bullish) oil ETF along with its price by volume levels. I like to review the price by volume analysis from time to time when nearing a major support or resistance level on a chart. For those who have difficulty finding support and resistance levels then this indicator/volume analysis tool will take most of your guess work out of the equation.
To make a long story short, the longer the volume bars on the left side of the chart are then the more people either bought or sold crude oil at that price. Keep in mind that it does not matter if they bought or sold here… the key to remember is that there are a lot of new positions here and that is where people exit their positions at breakeven because they held such a large draw down over the past few months and just want their money back.
Most traders and investors who trade off pure emotions (fear/greed) would have held a losing position through the August – October selloff and are now going to be more than happy to exit the trade at breakeven and move on to the next emotional roller coaster. It’s this type of trading which allows the non-emotional traders who thrive off of price action and mass psychology to catch price swings in the oil market.
The chart below clearly shows that oil is entering into resistance level and a pullback is becoming more likely each day. Those looking for an etf how to trade oil should look at buying SCO ETF. This oil ETF goes up in value when oil loses value.
How To Trade Oil ETFs
How to Trade Oil and Oil ETFs Conclusion:
In short, oil is becoming overbought meaning it has moved up to far too fast and should have some profit taking shortly. The fact the oil is reaching a century number ($100) I feel there will be a couple days of selling starting soon. Traders looking to play this support trendline breakdown should look at trading SCO oil etf.
If you would like to receive my Free Weekly Trading AnalysisJoin Now at Gold and Oil Guy.com
Over the years we have seen the stock market make some pretty exciting moves for share holders. This year alone there have been some interesting events unfold causing wild market swings which most of us did not think could happen. Things like countries going bankrupt and the May flash crash. Also the BP Oil well leak which looks as though its about to kill not only businesses around the world but a large population of animals and fish which our planet will never be able to get back… It’s been a crazy year!
It sure would be nice if the financial situations between all he countries could be resolved, and if we could have some proper regulations on banks and the financial system to minimize fraud and manipulation. From the looks of everything we have a few years still before things get sorted out, fixed and some what stabilized.
Below are some charts showing where the Dow, Gold and Oil are currently trading and my thoughts on them.
DIA – Dow Jones Industrial Average ETF – Daily Chart
The past 12 years we have seen the DJIA go through some large bull and bear markets providing those with trading experience to generate large profits in both the bull and bear markets.
Recently we have seen the DJIA pullback and test the key pivot point and has started to bounce. Although this price action is positive I have my doubts about another bull market rally because of how the chart looks. I focus most of my analysis on chart patterns, volume and market internals. These allow me to monitor the overall heath of the market on a daily, week and monthly basis. Using these techniques I am able to pull money from the market consistently.
This year we saw some extremely heavy selling in May which could have been strong enough to shift the trend from an up trend to a down trend. I call these large volume candles Get Ready Spikes. If they are green then we are looking for higher prices but when they are red it means distribution is starting and lower prices could start to form in the coming months.
The DIA chart below looks to be forming a very large head and shoulders pattern which is currently trading near the top of the right shoulder. This pattern is very bearish and points to much lower prices in the next couple years if the major support level (neckline) is broken.
GLD – Gold Exchange Traded Fund – Daily Chart
The chart of gold shows the same cup and handle pattern which I have been talking about for a while now. Last week the price of gold made a new high breaking out of this pattern. We could see the price of gold start to work its way up to the $1400-1500 level over the next 3-6 months which calculates to $140-150 on the GLD etf.
USO – Crude Oil Fund – Daily Chart
USO oil fund has been trend down for a couple months and recently put in a nice bounce from the May low. I feel as though oil is forming a bear flag and could head lower in the coming weeks. Until it breaks the key resistance level traders must be cautious if they have any long trades right now.
Weekend Dow, Gold and Oil Trading Conclusion:
In short, I’m bullish on stocks for the short term and think we could retest the April high in the next month or two. But after that the market could roll over and from there we could see much lower prices. Or we could see the indexes breakout and start another leg higher… During volatile times like we are in now… we must trade with caution until the overall health of the market clearly indicates the direction of stocks. Until then focusing on low risk setups and taking profits quickly is the safest trading strategy.
Gold looks to be setup for a strong move higher. I am hoping for another dip to shake out some investors before it continues its march upwards. Oil on the other hand is trading near a key resistance level. Only time will tell if it can break through and start a rally. If not then we will see the market struggle.
Last week looked and felt like a pivotal week for both stocks and commodities. The past two weeks have had investors and traders in a panic as they try to find safe investments for their money. After watching and reviewing the panic selling in the market it looks as though the majority decided to sell everything and be in cash for the time being. This is bullish for the stock market.
I will admit it has been tougher to trade recently because of increased risk levels due to the large 2-4% sell offs and rallies happening within minutes… While this is amazing for disciplined and experienced traders who are able to pull the trigger getting in and out with quick profit in the matter of minutes, this same price action can blow up trading accounts of those who do not have a trading strategy, money management and the discipline to take profits and cut losses very quickly. The speed of the rallies and sell offs is the matter of being up or down thousand of dollars in the matter of 5-10 minutes… That is one of the reasons I have stepped back from being aggressive and into more of an observation mode playing with small amounts of money and focusing on the larger trends at.
My #1 goal is to make subscribers money with the least amount of risk and watching the market swing 2-4% in minutes makes it extremely difficult to get everyone in and out positions with a profit before the market changes directions. As much as I love trading, some times the best position is to have small ones or be in cash.
GLD – Gold ETF Trading
Here is my weekly updated chart of gold as it works its way through the correction from last year. The daily chart looks to be forming a larger Cup & Handle pattern which is extremely bullish. If this pattern does a text book move then we could see GLD reach $140 and spot gold would reach the $1400 area.
That being said this pattern still has to complete the handle portion which could easily last another 4 weeks, so I am not in a panic to add more to our position.
SLV – Silver ETF Trading
Silver is in much of the same situation. Because of the added volatility in silver the charts do not look quite the same but they are similar in many ways… Silver is used a lot for industrial purposes and because the economy which is very weak still (though it is getting better) we are not seeing silver demand rise much. If silver can break this large resistance level then we could see silver surge to $25 (25%) this year.
USO – Oil Fund Trading
USO (Oil) has held up really well in the past 12 months but the recent sell off has seriously damaged the bullish outlook I had not long ago. While it is oversold and looks to have started a bounce last week the chart is pointing to lower prices over the longer term… This USO fund does have contago which makes this fund under perform the actual price of oil. The current prices of oil are still trading at a key support level and could post nice bounce if not trigger a new rally. The problem with following some ETF’s which have contago is that you do not see the real price action of the commodity. But that is were I come in as I track the underlying commodity and relate it to ETFs for you.
SPY – SP500 ETF Trading
The Stock Market (SP500) sure has been a roller coaster. The chart below shows you what happened in January for the last correction and where we stand currently in comparison. If a setup is obvious in the financial market there is a very high chance it will not work out as planned and by knowing this it allows us to be cautious and take profits at key short term support and resistance levels.
Trend Trading Conclusion:
In short, I feel gold and silver will drift around to digest the recent move up and to form the handle portion. Oil looks to have put in a short term bottom and if we get a small pullback in the coming days to test the intraday chart breakout level and touch the support trend line we could look to take a position.
We tend to see the most price appreciation during the final stages of a trend and we could have seen that on the US Dollar over the past 6 weeks. It looks as though the dollar could have put in a double top. If the dollar rolls over it would help boost precious metals, oil and stocks… But we will not know it’s a top until there is a clear trend reversal which in any case will be weeks before that type of price action can unfold.
As for the SP500, we have seen the same level of selling as we did in Feb-March 2009. High volume panic selling has ruled the market since late April. There are equal arguments for saying the market has bottomed with all the panic selling and that we should start another large rally lasting 8-12 months or one could argue this is capitulation volume signaling massive distribution of shares and now every rally/bounce will be sold… Personally I am torn between the two… but lean more towards higher prices with a multi month grind up at slow rate…
Last week the market slowly recovered from the recent sell off in stocks and commodities. So far the market is unfolding as we expected and with any luck there will be a surge of low risk setups across the market in the near future. Take a look at the charts below.
GLD – Gold Chart GLD/Gold is trading at a key pivot point. This week there will most likely be a sizable move either up or down. Past chart analysis is pointing to lower prices which would complete an ABC trace pattern and this makes for a larger and stronger rally once prices to turn back up. Silver is trading in much the same situation. Gold and silver tend to move together with silver having more volatility than gold.
UNG – Natural Gas Chart Natural Gas continues to try and bottom and posted some solid gains last Thursday & Friday with rising volume. But we have seen this pattern form over and over again in the past year so I am not excited yet. Once the base is formed and the trend starts up we will find low risk entry points for this commodity. I would look for shorting opportunities but natural gas is so oversold I feel the risk is higher than I prefer.
USO – Crude Oil Chart Looks like the trend line break down flushed out a lot of weak positions as seen in the volume surge. Oil momentum is still down but we are now starting to look for a buy signal.
SPY – SP500 Chart Equities recovered nicely from the previous week’s sharp sell off. We saw volume rise with higher prices which is a strong sign of the overall strength of the market. But it is important to note that the market sentiment has reached an extreme level with 53% of traders now being bullish on the market and only 17% being bearish. This extreme level is the same level reached just before the January correction earlier this year.
Equities and Commodity Trading Conclusion: If recent historical prices repeat again then we are looking for a small move higher on Monday and then a couple days of weakness for both stocks and commodities later in the week. The market is very close to generating several low risk trading signals which is very exciting.
This week has been playing out as expected with prices grinding their way higher and lots of sharp intraday sell offs and rallies which is indicative of a market getting toppy.
Seems like the masses feel as though they are getting left behind which is why we are starting to see the panic buying in the market (new money buying at these lofty overbought prices).
Each time there is a new intraday or daily high on the major indexes there is a renewed bullishness created as breakout traders and novice traders buy into the market hoping for the next surge in price. It is these volume surges of new money entering the market which the big guys (smart money) are selling into. You can see it clear as day light on the intraday charts as new money gets sucked into the market new high and then 2 minutes later larger waves of selling hit the bids. I did explain and show a chart of how this looks to members of the FuturesTradingSignals.com today.
We have some very exciting times ahead and it’s just a matter of letting the market unfold over time as we take advantage of these carefully measured low risk setups.
On to the charts....
GLD ETF Trading – Gold Exchange Trading Fund
You can see how this chart has evolved from pattern to pattern as it bottomed over time.
Today we had a breakout and I expect to see a pullback which is normal when prices gap up and breakout of a pattern. An entry point would be considered on a pullback if the proper criteria are met.
SLV ETF Trading – Exchange Traded Fund
Silver has always been much more volatile than gold which is why the pullback early this year was so strong and why the recent rally has also covered so much ground. As you can see silver has broke out above resistance but is now looking overbought. A pullback in precious metals is expected, or a pause at least.
USO Crude Oil Fund
Oil has made a nice move higher the past week but I feel it will pullback also in the coming days for a breather. There are a couple sizable gaps to fill all the way back down to $40.50.
UNG Natural Gas Fund
This natural gas chart looks very interesting. In the chart I am comparing the 2009 low to today’s price action.
From looking at the chart, natural gas is way oversold and in dire need of a relief rally. As you can see the sharp rallies which occurred just before both the 2009 and the current possible bottom look identical. This type of price action is very common to see.
Let me explain: When an investment is this over sold, meaning it has sold lower for weeks if not months, then there is a large growing number of traders looking to pick a bottom. Once these traders see prices start to move higher they all jump in thinking its “The Bottom”. Some times it is but more times than not it’s just a suckers rally.
General rule is, if everyone can see it, then its most likely not going to happen.. this is also part of the reason the major indexes keep going up. It looks like a great short and a tone of traders are in cash waiting to take advantage of the drop. But the market will keep pushing higher until fear its not going to pullback. That’s when the new money buys back in fueling the GRIND higher.
Anyways, so after all the bottom pickers jump on the train and there are not any more buyers and the price tends to drift lower scaring these traders back out of the position. Eventually a new low is made and everyone is shaken out of the investment. The crazy part is that just as they get out, the price usually turns around and does exactly what they new was going to happen –Go Up.
Most traders have the direction correct, it’s just their timing is off. My general rule is when I see something I wait another bar, sometimes I keep saying that to my self after each new bar until I am confident in the predicted move or price I can get into the position at.
Mid-Week Trading Conclusion:
In short, the bull market continues to grind its way higher. Unfortunately we cannot do much until there is some type of correction because buying way up here after a 2 month rally is outside of my comfort zone.
I foresee a 3-5% correction starting any day now so I am keeping my gunpowder dry.
Last week was nothing special as stock market continued to drift higher on light volume and the Volatility Index (VIX) reaching a new multi year low. This mix of higher prices on light volume, multi year lows in the VIX and an overbought market paints a clear picture to a market technician – Be Ready for a Pullback!
Last Wednesday we posted Chris' report covering sector rotation comparing the price performance of these sectors from the January peak with last weeks price action. It was very interesting and it pointed to a sharp sell off Thursday or Friday.
Last week gold gap higher then traded sideways for a few days. I will admit it was very tempting to buy into the move but I stuck with my trading strategy which is to not chase moves which gap in my direction.
Gaps are known to get filled about 70% of the time. What that means in this situation is that the price will most likely sell back down to fill that gap before trying to move higher.
All that said the problem I see now on the daily chart is the possibility of the mini Head & Shoulders pattern breaking down. If gold moves any lower then I would expect a sharp pullback. The measured move would equal a pullback to the $104 area on the GLD chart and the $1070 level for spot gold.
SLV Silver ETF Trading Chart
The silver chart looks much different than gold’s but in reality they are trading in a similar situation. If silver moves any lower then sellers will flood the market and take the price down to the next support level. But if we get a bounce then it should surge and rally almost a $1 per ounce from this point.
Only time will tell as we let this trade unfold with a stop at $16.52.
Natural Gas – Weekly Trading Chart
Natural gas has been selling down for almost 2 months. The chart is starting to show a possible buy point if all goes well in the next few weeks.
What I like about this chart is that we saw a break of a support level and heavy selling which tells me the general herd is getting shaken of their long positions. This extended sell off is now entering a support zone and could provide us with a low risk setup in the next 2-3 weeks.
Crude Oil – Weekly Trading Chart
Oil is trading similar to gold and silver. It is trading at a key pivot point and could go either way quickly. I will be keeping my eye on the daily and 60 minute charts for a possible low risk entry point.
Weekend Stock & Commodity Trading Conclusion:
In short, the overall market is trading at level were there is not much to we can do. Day traders are able to take advantage of this price action but not swing traders.
I feel the major indexes have another 1-2 down day left in them before a bounce, but it’s more difficult to gauge the momentum with a cool down period in the middle of it all (the weekend).
The market is on the edge of some exciting moves as I can feel something brewing. With any luck there could be some great opportunities in the coming days.