Showing posts with label rally. Show all posts

Friday, January 3, 2020

ADL Gold Prediction Confirms Our Targets

The Gold rally we predicted to happen in late 2018 took place, almost perfectly, based on our ADL predictive modeling systems results. This rally took place in May through September 2019 and pushed Gold up to levels near $1600. The rest of the year, Gold consolidated near $1500 as a strong US Stock Market rally took hold in Q4 of 2019.

Our original prediction was that Gold would rally to levels near $1750 before the end of 2019 based on our Adaptive Dynamic Learning predictive modeling system (ADL). This did not happen in 2019 as out ADL modeling systems suggested, but it appears Gold is setting up for another massive upside rally in 2020.

Taking a look at our ADL predictive modeling systems on Monthly charts for Gold and Silver, we see two very interesting suggestions setting up :

  • First, Gold may attempt a rally to a level above $1700 before March/April 2020 and potentially extend this rally to well above $1850 by August/September 2020.


  • Second, Silver appears to lag behind this Gold rally by about 7 to 8 months. Silver does not appear to want to start a rally until well after July or August 2020.

If we consider what happened in 2008/09 with the global credit market crisis, both Gold and Silver contracted lower near the start of this crisis (in late 2008). Eventually, Gold began to move higher in August/September 2009 (well into the crisis event). Silver didn’t really start to accelerate higher will August 2010 – a full 12 months after the Gold rally started.

Our ADL system is suggesting that the Silver rally will lag behind the gold rally by about 10 to 14 months given the ADL predictions for price activity in 2020. Thus, Gold may continue to rally much higher fairly early in 2020, yet we won’t see much upside movement in Silver till after July 2020.

Monthly Gold ADL Chart

This first Monthly Gold ADL chart highlights the ADL predictive modeling systems suggestion related to future price targets. We can see the upside move in Gold should begin with an upside target near $1600-1625 over the next 60+ days. After that, the rally should accelerate higher in April/May 2020 with another move higher towards $1700-1725. By August/September 2020, Gold should attempt a rally to levels above $1800-1850 and then begin to consolidate above $1800 for a few months.


Silver Monthly ADL Chart

This Silver Monthly ADL chart suggests that Metals will react very similar in 2020 to what happened in 2008-09. While Gold began to rally in August 2009, Silver did not begin to accelerate higher till August/September 2010. This delay in the understanding that Silver presents valid protection against risk may take place in this current upside rally in Gold. If the ADL predictions are accurate, then Silver will continue to provide buying opportunities for many months near $17.50-$18.00 before a major upside price advance begin.

By July 2020, Our ADL predictive modeling system is suggesting Silver will advance to levels above $18.25, then begin a major price advance to levels above $19-20 fairly quickly. Please keep in mind the scope of these predictions related to the global markets and the U.S. Presidential elections. We read into this that a lot of chaos/turmoil may be taking place in the US/World after June/July 2020.


Weekly Gold Chart

This last chart is a Weekly Gold chart highlighting our Fibonacci Price Amplitude Arcs and the major resistance level that has just been broken in Gold. The heavy GREEN arc and the BLACKLINE that we’ve drawn on this chart represent massive resistance originating from the lows near August 2018 in Gold. We believe this resistance level, once broken, will prompt a major upside price move in Gold to levels closer to or above $1700. If this price advance in Gold aligns well with our ADL predictions, then we believe fear will continue to drive future a future price advance in Gold and that fear may be related to continued Global stock market concerns and the U.S. elections.


2020 may be a very good year for precious metals traders who are able to identify solid entry trades for these moves. If our ADL predictions are accurate, Gold should rally over 25% before the end of 2020. Silver may rally as much as 15% before the end of 2020. The timing of these moves suggests Gold traders will have opportunities for bigger price advanced early in 2020 and will begin a larger upside price move after February/March 2020. Silver will begin an upside price move after basing near the March/April 2020.

2020 is going to be a fantastic year for skilled technical traders. Join us and our valued members in finding great trades and incredible opportunities in the markets by joining The Technical Traders.

Chris Vermeulen
The Technical Traders Ltd.


Stock & ETF Trading Signals

Monday, July 15, 2019

Could Gold Launch into a Parabolic Upside Rally?

We believe Gold is setting up for an incredible upside breakout move after reaching our predicted target near $1450. For those of you that have been following our research and Gold calls, we’ve nailed this move and our October 2018 predictive modeling call has continued to mirror (almost exactly) the price movement in Gold over the past 10+ months. See the chart below.


Our Adaptive Dynamic Learning (ADL) predictive modeling system suggested that Gold would rally from the $1200 level to above $1300, then stall. It suggested that in April or May of 2019, Gold would settle back below $1300 and set up a “momentum base” before attempting an upside breakout move after forming the base. Our research team identified April 21~24 as the likely “price low” for the “momentum base” using our advanced price cycle and other research tools.

You can see from the chart, above, that our upside price targets from our original research are above $1550~1600. What if we told you we now believe the upside price targets could actually be above $1700 and more like $1750 to $1800 on a parabolic upside price rally initiating after price breaks critical resistance levels?

Take a look at this simple Gold/Silver/USDollar index chart. The purpose of this chart is to relate the price of Gold to the price of Silver in US Dollar price levels. It highlights that Silver is still very undervalued in comparison to Gold and that any attempt to restore a price balance between Silver and Gold would likely result in either two outcomes : A. the price of Gold falls, or B. the price of Silver rallies faster than Gold rallies whereas this ratio will attempt to balance out (as we see back in 2013/2014).

Our Price Amplitude Arcs are a means of measuring price cycles, price waves and allow us to seek out critical price inflection points. As you can see, where multiple arcs align and are breached by price, we typically see some type of increased price volatility and trending. Currently, two separate arcs are setting up to be breached and we believe this is important because of how it aligns with our October 2018 research post.

What would cause Gold to rally above $1600 at this time? Why would this become a period where renewed interest in precious metals could drive such a big move? We believe a number of global economic factors will become more evident over the next 30 to 60+ days and that these critical Price Amplitude Arcs are suggesting price is set up to rally from these levels. We believe the move higher will include both Gold and Silver and that Silver may rally stronger than Gold which would cause this Gold/Silver ratio chart price level to move higher – towards our objective line (MAGENTA).


We believe a key date for all traders/investors to be aware of is August 19, 2019 (+/- 5 days). We believe this will be the date range that the market will break out of existing ranges and when fear and greed will likely solidify in the precious metals markets. We have about 35 days to go before this date and we believe Gold will continue to trade below the “Breakout Resistance” until renewed fear and greed become more evident in the global markets.


This means the US Dollar will likely continue to rally, or at least stay above $96, for the next 25+ days and that upside US Dollar price activity will partially mute the upside price potential in precious metals. Overall, the upside price momentum in metals will push metals prices higher while the US Dollar continues to strengthen moderately. Once the U.S. Dollar breaks lower, metals will skyrocket higher (breaking past the Breakout Resistance level) and begin the upside parabolic move.


Any opportunity you find where Gold is trading below $1400 is an excellent opportunity to prepare for this move. Silver continues to trade below $15.50 and continues to be an incredible opportunity for traders who understand the ratio levels of precious metals. Don’t miss this move. It is just a matter of time (30+ days) now.

Be prepared for these incredible price swings before they happen and learn how you can identify and trade these fantastic trading opportunities in 2019, 2020, and beyond with our Wealth Building & Global Financial Reset Newsletter. You won’t want to miss this big move, folks. As you can see from our research, everything has been setting up for this move for many months – most traders/investors have simply not been looking for it.

Join me with a 1 or 2-year subscription to lock in the lowest rate possible and ride my coattails as I navigate these financial market and build wealth while others lose nearly everything they own during the next financial crisis. Join Now and Get a 1oz Silver Round or Gold Bar Shipped To You Free.

I can tell you that huge moves are about to start unfolding not only in currencies, metals, or stocks but globally and some of these supercycles are going to last years. A gentleman by the name of Brad Matheny goes into great detail with his simple to understand charts and guide about this. His financial market research is one of a kind and a real eye opener. 2020 Cycles – The Greatest Opportunity Of Your Lifetime

As a technical analysis and trader since 1997, I have been through a few bull/bear market cycles. I believe I have a good pulse on the market and timing key turning points for both short-term swing trading and long-term investment capital. The opportunities are massive/life-changing if handled properly.

BILLION GIVEAWAY – REAL GOLD OR SILVER WITH MEMBERSHIPS


So kill two birds with one stone and subscribe for two years to get your
FREE GOLD BAR and enough trades to profit through the next metals
bull market and financial crisis!


Chris Vermeulen – The Technical Traders


Stock & ETF Trading Signals

Tuesday, December 18, 2018

ES Sets Up Major Double Bottom Ahead of the Fed

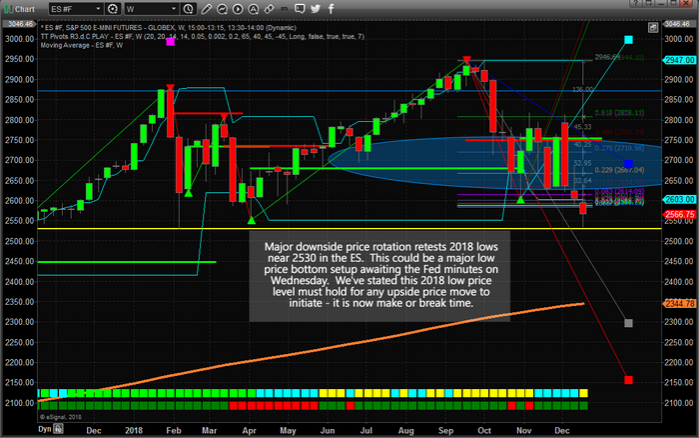
The downside price rotation in the U.S. markets on Monday, December 17, set up a near perfect double bottom formation near the 2530 price level and also prompted a dramatic price recovery after reaching these lows. Currently, the ES has rallied over 35 pts from this low level and will likely pause before the Fed minutes are announced on Wednesday, December 19.

If the Fed holds true to their earlier promises of continued rate increases, we could see this 2530 level broken as price retreats from any relief rally and attempts to find lower support. If the Fed changes the context of their message and adopts a slower and more insightful rate policy, the markets are poised for one heck of a potential rally. The ES if down by a little more than 400 points (-13.75%) from the peak in September 2018.

Check Out Our 3 Hour Trading Strategy Mastery Video 

We believe the markets have already priced in the expected Fed rate hike and we believe an additional rate hike could become a catalyst for a downside move towards 2300 if the 2530 level is breached. We would like to see the Fed pause, or even decrease rate levels by 25 bp, allowing the markets to parse through the credit/debt issues that have started to plague the global markets before it causes the markets to “turn turtle” and prompt a greater crisis event.


Some of our earlier research, from 2013-2014, was a modeling system dedicated to the Fed interest rates, GDP, Population and Asset Valuations. We modeled various outcomes of the global economy over the future 15 to 20 years including massive debt increases, massive debt decreases, slowing GDP, growing GDP, massive changes in population and asset levels and many others. Overall, our research showed that the 2% Fed Funds Rate level should have been an upper boundary and should have been a near term target back in 2015-2016. As or right now, the Fed should be decreasing rates to allow for a smooth transition through a “deleveraging process”.

The Fed is behind the curve and is failing to properly navigate the future outcomes of global assets, debt and credit cycles. If the US Fed is not cautious over the next 12+ months with how they manage the FFR, they could push the entire global economy over a cliff faster than they can spell “Powell”.

Everything rests on Wednesday, December 19 and the U.S. Fed at this point. Our predictive modeling systems are still suggesting we should see strong upside price activity throughout the end of this year and early next year – assuming the Fed does not pull the floor out from under this market and capsize the global credit markets again.

Learn how we can help you find and execute trades for better success. Our analysis has been well ahead of these market moves for months and we’ve nailed some incredible trades.

Visit The Technical Traders to learn more.

Chris Vermeulen


Thursday, October 18, 2018

Are You Going to Ignore Steve This Time?

Steve is going ALL IN on stocks right now. His prediction is appearing on TV, radio and even as full-page segments of USA Today.The Washington Times and Investor’s Business Daily. He predicts the next 9 to 12 months will be the most profitable we’ve seen in the stock market since 1999.

Who is this Steve fellow, and should you really believe him? Here’s what we know. He’s a reclusive multimillionaire in Florida. You could have doubled your money or better 18 times over the last 17 years, by following his investment ideas.

He’s famous for predicting:

    *   The Dot-com Crash in January 2000…
    *   The Gold Boom of 2003…
    *   The Bottom of the Great Recession in 2009…
    *   The Housing Boom in 2011…
    *   The $1 trillion MSCI China Shift in May 2018 and More.

But beginning October 24th, his newest prediction could be the biggest of his career and could have a huge impact on your retirement. And here’s the strange part…

When stocks plummeted 800 points last week, Steve didn’t care at all. He says we could 5 more corrections just like this. But if you get into stocks now, he says, and do one thing with your money – he believes you could make more money over the next year than you’ve likely made over the last 20 years, combined.

I Urge You to Check Out His Full Announcement Here.

Enjoy,

Jared Kelly
Managing Director, Stansberry Research

P.S. Jim Rickards… Tim Sykes… and Robert Kiyosaki are all supporting what Steve will reveal on October 24th. See what’s happening here.

Wednesday, September 12, 2018

How Bitcoin Will Make You Big Money Again

If you are a Bitcoin fan or looking for the next opportunity for a Bitcoin rally, you may not have long to wait before a price breakout takes place. Our research team at The Technical Traders believes a price breakout may occur before the end of 2018 – the only question is will it be a breakout rally or a breakdown crash before the next mega rally?

Cryptos and, in particular, Bitcoin has increased in popularity and adoption over the past 24 months across the globe. Recently, Citigroup has announced new technology making Crypto transactions more secure and reducing the risk of such transactions. Additionally, Circle recently announced a US Dollar based Crypto currency that is backed by Goldman-Sachs. News from Europe is that the EU has been urged to adopt common Crypto Currency rules that will fuel more attention and enterprise on developing suitable Crypto solutions for the European markets.

All of this plays into our research that a breakout/breakdown is inevitable and it is just a matter of time before this coiling price consolidation “apexes” and expands.

This chart shows massive breakdown washout below $6000 taking it back to prices before crypto became popular in early 2017.


This next chart below shows our cycle analysis and how much bitcoin moved from our cycle bottoms to tops. We are now at NEARING a critical juncture of a $6000 breakdown which is clearly a support level, and a potential major cycle bottom or continuation down cycle. Huge money can be made from this extreme volatility that is about to unfold and savvy technical traders can see the profit potential unfolding.


We urge all traders to keep Cryptos in focus over the next few weeks and months. Our research team shares our proprietary analysis and research with our paid members regarding the Crypto currency trends and trades.

If you want to learn what we believe will be the next big move in the Crypto markets, then visit The Technical Traders to learn more. Our proprietary modeling systems are clearly showing us what we should expect over the next few weeks and months. As a member, you will have access to this research and benefit from our Daily Research Videos.

Chris Vermeulen

Saturday, August 13, 2016

Why Corporate America Can’t Prop Up Stocks Much Longer

By Justin Spittler

Corporate America is bracing for tough times. Since you’re reading an investment newsletter, you likely own stocks. And if you’re like most investors, you keep up with how the companies you own are performing. You might even listen to quarterly “earnings calls,” which are when CEOs present results and give their outlook on the business.

Most of the time, CEOs act as cheerleaders on these calls. If business is bad, they’ll say business is good. If business is good, they’ll say it’s great. And CEOs are notoriously optimistic about the economy. After all, thousands of investors and analysts listen to these calls. CEOs know their stock can crash if they’re pessimistic about the business or economy. Because many CEOs will say anything to make their stock go up, we don’t put much stock in their words. We pay much more attention to their actions. And right now, large U.S. companies are acting like very tough economic times are ahead.

Business investment fell 2.2% last quarter..…
This metric measures how much companies spend on property, plant, and equipment. It was the third straight quarter that business investment fell. That hasn’t happened since the 2008-2009 financial crisis. We wouldn’t see this if the economy was headed in the right direction. Companies would be building more factories. They’d be buying more machinery. They’d be spending more money on research and development.

Instead, companies have cut back on investments. This tell us they don’t see many good opportunities. That’s a bad sign for the economy, yet stocks keep rallying. The S&P 500, Dow, and NASDAQ have all recently hit new record highs. At this point, you’re probably wondering what’s keeping stocks afloat if it’s not the economy.

Companies have spent about $2.5 trillion on “share buybacks” since the financial crisis..…
A buyback is when a company buys its own stock from shareholders. This can lift a company's stock price.
According to investment bank Goldman Sachs (GS), buybacks have been the biggest driver of U.S. stock performance since the financial crisis. Buybacks also reduce the number of shares that trade on the market.

This boosts a company’s earnings per share. But buybacks don’t make a company more profitable. They only make profits look bigger “on paper.” Companies have been buying up their own stock for two reasons: 1) They don’t see many growth opportunities. And 2) it’s incredibly cheap to borrow money.

The Federal Reserve has held its key interest rate near zero since 2008..…
The Fed cut rates to encourage households and businesses to borrow and spend more money. Mainstream economists thought this would “stimulate” the economy. It didn’t work. The U.S. economy has grown at an annualized rate of just 2.1% since 2009. This makes the current “recovery” the slowest by far since World War II.

The Fed did get folks to borrow huge sums of money. U.S. corporations have borrowed more than $10 billion in the bond market since 2007. Last year, they issued a record $1.5 trillion in bonds.
Buybacks are a big reason companies borrowed so much. MarketWatch reported last week:
Companies have been taking on piles of debt to finance buybacks, leading the total debt on the S&P 500 to grow 56% during the past five years.
According to Yahoo! Finance, companies in the S&P 500 funded 22% of last year’s buybacks with debt. This year, debt paid for 39% of share buybacks.

Corporate debt is now dangerously high..… 
According to Barron’s, corporate debt now equals 45.3% of gross domestic product (GDP). The only time this key ratio has ever been higher was in 2009, when it hit 45.4%. If the economy was doing well, this wouldn’t be such a big problem. Companies would be making enough money to pay their debts.

But right now, Corporate America is struggling to make money. Profits for companies in the S&P 500 are on track to fall for the fifth straight quarter. That hasn’t happened since the 2008-2009 financial crisis.
There’s no telling when this earnings drought will end either. According to research firm FactSet, analysts expect third quarter corporate profits to fall 1.7%. The third quarter ends on September 30.

Keep in mind, the U.S. economy is technically in a “recovery” right now. Imagine what will happen to corporate profits during the next recession. The more profits fall, the less money companies will have to prop up their shares with buybacks.
  
Companies have already started to cut back on buybacks..…
According to Business Insider, buybacks fell 18% last quarter. This sharp decline in buyback activity followed a near record breaking first quarter, in which companies in the S&P 500 spent an incredible $166 billion on buybacks. That’s the second most ever, and the most in one quarter since 2007. We don’t know exactly why companies are suddenly spending less on buybacks.

Maybe it’s because corporate profits are drying up. Maybe companies are starting to realize they have too much debt. Or maybe it’s because stocks are expensive. According to the popular CAPE ratio, stocks in the S&P 500 are 62% more expensive than their historic average. Since 1881, U.S. stocks have only been more expensive three times: before the Great Depression, during the dot-com bubble, and leading up to the 2008-2009 financial crisis.

Like any investment, buybacks only make sense when stocks are a good deal. With stocks as expensive as they are today, buybacks are a terrible use of money.

Without buybacks, there won’t be much to keep U.S. stocks from falling..…
If you own stocks, take a good look at your portfolio. We recommend that you get out of any company that needs buybacks to retain shareholders. We also encourage you to put 10% to 15% of your wealth in gold. As we often say, gold is real money. It’s preserved wealth for centuries because gold is unlike any other asset. It’s durable, easy to transport, and easily divisible.

Gold is also the ultimate safe haven asset. It’s survived economic depressions, stock market crashes, and full blown currency crises. When investors are nervous about stocks or the economy, they buy gold.
The price of gold has jumped 27% this year. It’s beat the S&P 500 4-to-1.

If you don’t already own gold for protection, we encourage you to do so immediately..…
According to Casey Research founder Doug Casey, the financial system is held together by “chewing gum and bailing wire” right now. When the public wakes up and realizes this, “they’ll flock to gold… just as they’ve done for centuries.” Doug thinks this could cause the price of gold to easily soar 200% in the coming years.

You could make 2x, 5x, or 10x that much money in gold stocks..…
Yesterday, we showed you how leverage works in the resource market. As we explained, this powerful force is why gold stocks can soar even if the price of gold doesn’t rise by that much. This year, gold’s 27% jump caused the VanEck Vectors Gold Miners ETF (GDX), which tracks large gold miners, to soar 128%.

Some folks might see that and think they missed their chance to buy gold stocks. But regular readers know gold stocks can go many times higher. During the 2000-2003 bull market, the average gold stock rose 602%. The best ones returned more than 1,000%. We expect even bigger gains in the coming years. To learn why, watch this short presentation. In it, Doug explains why we’re headed for “the biggest gold mania” he’s even seen.

By the end of this video, you’ll know why there’s never been a better time to own gold stocks. You’ll also learn how to make the most of this new gold bull market. We’re talking gains of 1,000%...2,000%...even 5,000%. Those kind of returns might sound impossible. But as you’ll see, Doug's hit many “home runs” like this throughout his career. And for the first time ever, he's showing the world exactly how he did this.

To learn Doug’s SECRET to making giant gains in gold stocks, watch this free video.

How Will Negative Interest Rates, the War on Cash, and “Helicopter Money” Affect the Markets?

Today, we have something special to share with you. Instead of the usual “Chart of the Day,” you’ll find a six-minute video presentation put together by our colleagues at Palm Beach Research Group.

In the video below, Palm Beach Research Group co-founder Tom Dyson and Palm Beach Letter editor Teeka Tiwari discuss how radical government policies are affecting global financial markets. As Tom and Teeka explain, these central bank “experiments” will have severe side effects. They could even push the price of gold to $5,000. To learn why, watch the video below.


If you like what you saw from Tom and Teeka, we encourage you to sign up for their “speed round” training series. Click here to get started.


Get out latest FREE eBooK "Understanding Options"....Just Click Here

Stock & ETF Trading Signals

Thursday, November 13, 2014

Connecting the Dots: Not Yet Time to Celebrate a Market Turnaround

By Tony Sagami


The Wall Street crowd liked what they heard last week and pushed the Dow Jones to a new high. In particular, the trio of the Republican landslide victory, an overall positive Q3 earning season, and a good jobs report that showed unemployment dropping to 5.8% was behind the rally.

And what a rally it was. Since the start of earnings season on October 8, the S&P 500 has increased by 3% and has bounced by an eye popping 9.1% from the October 15 low. Many of my peers have already popped the champagne and drunkenly declared a coast-is-clear resumption of the great bull market.

Not so fast. There was a trio of negative news pieces last week that tells me there is more to be worried about than there is to celebrate.

“V” Is for Vulnerable… Not Victory


You shouldn’t trust “V”-shaped bottoms.

Instead of being encouraged by the 9% moonshot since the October 15 low, I am even more skeptical. The S&P 500 shot up by 220 points in just three weeks, which tells me that the rubber band of stock market psychology is overstretched.


The stock market’s massive mood swing from fear to greed can change just as quickly to the other direction. Sharp trend reversals followed by sharp rebounds is not a kind of bottom building behavior.

The rally has been accomplished with low trading volume—a classic definition of an unsustainable bounce because it shows that the rally was more from a lack of sellers rather than an abundance of buyers.

And don’t forget about the drastic underperformance of small stocks. The Russell 2000 is up less than 1% for the year compared to 11% for the Nasdaq and 10% for the S&P 500.

Earnings: Look Ahead, Not Behind


Overall, corporate America had an impressive third quarter. 88% of the companies in the S&P 500 have reported their third-quarter earnings; of those, 66% exceeded Wall Street expectations.

Impressive, right? Not so fast!

When it comes to earnings, you need to be looking through the front-view windshield and not the rear-view mirror.


Even the perpetually bullish analytical community is getting worried. The average estimates for Q4 earnings as well as Q1 2015 are being downwardly adjusted. Since October 1:
  • Q4 earnings growth have been lowered from 11.1% to 7.6%;and
  • Q1 2015 earnings growth has been chopped from 11.5% to 8.8%.
Don’t give Wall Street too much credit for being rational. Those downward revisions are largely based on the cautious outlook given the corporate America itself. The ratio of negative outlooks to positive outlooks is 3.9 to 1!

Both Wall Street and corporate America are concerned, and so should you be.

Don’t Ignore Central Bankers’ Warnings


Many of the world’s central bankers gathered in Paris last week to figure out how to keep the world’s leaky financial boat from sinking, as well as spending more of their taxpayers’ money on fine wine, cuisine, and luxury hotels.

All those central bankers are eager to keep their economies afloat, but judging from the comments, they’re worried that they are running out of monetary bullets.

“Normalization could lead to some heightened financial volatility,” warned Janet Yellen.


“This shift in policy will undoubtedly be accompanied by some degree of market turbulence,” said William Dudley, president of the Federal Reserve Bank of New York.

“The transition could be bumpy … potential for financial market disruption,” cautioned Bank of England Governor Mark Carney.

“Paramount risk of very low interest rates is to entertain the illusion that governments can continue to borrow rather than make difficult and yet necessary choices and indefinitely put off the implementation of structural reforms,” admitted Bank of France Governor Christian Noyer.

“The bottom line is there is a very good question about whether more stimulus is the answer,” said Reserve Bank of India Governor Raghuram Rajan.

Perhaps the most honest and telling statement from Malaysian central banker Zeti Akhtar Aziz: “In this highly connected world, you would be kindest to your neighbors when your keep your own house in order.”

That’s a whole lot of central banker warnings—and it’s always a mistake to ignore the people who control the world’s printing presses.

30-year market expert Tony Sagami leads the Yield Shark and Rational Bear advisories at Mauldin Economics. To learn more about Yield Shark and how it helps you maximize dividend income, click here.

To learn more about Rational Bear and how you can use it to benefit from falling stocks and sectors, click here.


Get our latest FREE eBook "Understanding Options"....Just Click Here!


Saturday, October 25, 2014

Blood in the Streets to Create the Opportunity of the Decade

By Laurynas Vegys, Research Analyst

Gold stocks staged spring and summer rallies this year, but haven’t able to sustain the momentum. Many have sold off sharply in recent weeks, along with gold. That makes this a good time to examine the book value of gold equities; are they objectively cheap now, or not?

By way of reminder, a price to book value ratio (P/BV) shows the stock price in relation to the company’s book value, which is the theoretical value of a company’s assets minus liabilities. A stock is considered cheap when it’s trading at a historically low P/BV, and undervalued when it’s trading below book value.

From the perspective of an investor, low price to book multiples imply opportunity and a margin of safety from potential declines in price.

We analyzed the book values of all publicly traded primary gold producers with a market cap of $1 billion or more. The final list comprised 32 companies. We then charted book values from January 2, 2007 through last Thursday, October 15. Here’s what we found.


At the current 1.20 times book value, gold stocks aren’t as cheap as they were when we ran the numbers in June, 2013, successfully pinpointing the all-time low of 0.91 (the turning point before the period in gray). Of course, that P/BV is hard to beat: it was one of the lowest values ever. And while the stocks not quite as cheap now, the valuation multiple still lingers close to its historical bottom. Remember, we’re talking about senior mining companies here—producers with real assets and cash flow selling for close to their book values.

In short, yes, gold stocks are objectively selling cheaply.

The juniors, of course, have been hit harder. It’s hard to put a meaningful book value on many of these “burning matches” with little more than hopes and geologists’ dreams, but valuations on many are scraping the bottom, making them even better bargains, albeit substantially riskier ones.

What does this mean for us investors?

It’s no surprise to see that every contraction in the ratio was followed by a major rally. In other words, the cure for low prices is low prices:
  • The August, 2007 bottom (2.2) and the momentary downtrend that preceded it were quickly erased by a swift price rally leading to a January, 2008 peak (3.8).
  • The bull also made a comeback in 2009-2010, fighting its way up out of what seemed at the time to be the deepest hole (1.04) in October, 2008.
Stocks have been on a long slide since the ratio last peaked at 3.24 in October, 2010, with the downturn in 2013 pushing multiples to previously unseen lows.

No one—us included—has a crystal ball, and so it’s impossible to tell if the bottom is behind us. We can, however, gauge with certainty when an asset is cheap—and cash-generating companies selling for little more than book value are extraordinary values for big-picture investors.

Now let’s see how these valuations look against the S&P 500.


Stocks listed in the S&P500 are currently more than twice as expensive as the gold producers. That’s not surprising given how volatile metals prices can be and how unloved mining is—but is it rational? Note that despite the downtrend in the last month, the multiple for the S&P500 remains close to a multiyear high.

In other words, yes, the S&P 500 is expensive.

This contrast points to an obvious opportunity in our sector.

So is now the time to buy gold stocks? Answer: our stocks are good values now, and, if there is a larger correction ahead, they may well become fantastic values, briefly. Either way, value is value, on sale.

As the most successful resource speculators have repeatedly said: you have to be a contrarian in this sector to be successful, buying low and selling high, and that takes courage based on solid convictions. Yes, it’s possible that valuations could fall further. However:

The difference between prices and clear-cut value argue for going long and staying that way until multiples return to lofty levels again—which they’ve done every time, as the historical record shows.

With a long term time frame in mind, whatever happens in the short term is less of a concern. Building substantial positions at good prices in great companies in advance of what must transpire sooner or later is what successful speculation is all about. This is how Doug Casey, Rick Rule, and others have made their fortunes, and it’s why they’re buying in the market now, seeing market capitulation as one of the prime opportunities of the decade.

That’s worth remembering, especially during a downturn that has even die hard gold bugs giving up.
Bottom line: “Blood in the streets” isn't pretty, but it’s a good thing for those with the liquidity and courage to act.

What to buy? That’s what we cover in BIG GOLD. Thanks to our 3 month full money back guarantee, you have nothing to lose and the potential for gains that only a true contrarian can expect.


Get out latest FREE eBooK "Understanding Options"....Just Click Here


Saturday, June 21, 2014

WTI Crude Oil on the Move $112 Next Stop

The energy sector has surged during the last two months which can be seen by looking at the XLE Energy Select Sector Fund. If crude oil continues to climb to the $112 level, XLE will likely continue to rally for another few days or possibly week as energy stocks are considered a leveraged way to play energy price movements.

Another way to look at this info is through the USO United States Oil Fund. This tracks much closer to the price of oil. The only issue is that many ETFs that “try to track” an underlying commodity is in how the funds are built. They own multiple contracts further into the future which does not exactly provide us with the short term news/event driven price movements in the current front month contract as they should.

What does this mumbo jumbo mean? Well, it means funds like USO and the highly respected UNG, and VIX ETFs… (just joking about the highly respected part), fail to track the underlying commodity or index very well when it comes to short term price movements. This means, you can nail the timing of a trade, and the commodity or index will move in your favor, yet your fund loses money, or goes nowhere...

Let’s Focus on the Technicals Now….


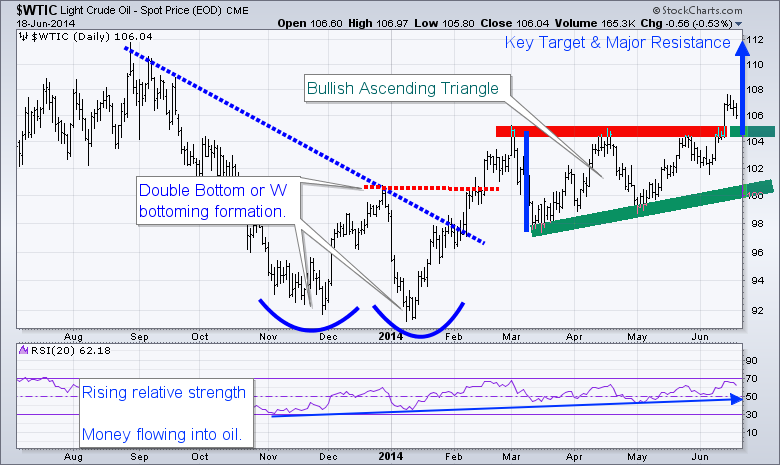
WTI crude oil has formed a bullish ascending triangle pattern from March to May of this year. The breakout to the upside is bullish and should be traded that way until the chart says otherwise. This breakout and first pullback must hold, or I will consider it a failed breakout. So if price dips and closes 2 days below the breakout level, it will be a major negative for oil in my opinion.

The range of the ascending triangle provides us with a measured move to the upside which is $112. Typically the first pullback after a breakout can be bought. The first short term target to scalp some gains would be $109, and at that point moving your stop to breakeven is a wise decision. Trading is all about managing capital and risk, if you don’t, then the market will take advantage of your lack in discipline.

Looking further back on the chart, you can see the double bottom formation also known as a “W” formation. Once the high of the “W” formation is broken the trend should be considered neural or up.

Also note that the RSI (relative strength) has been trending higher for some time now. This means money is rotating into this commodity. This is in line with my interview this week with Kerry Lutz and my recent article talking about the next bull market in commodities and the TSX (Toronto Stock Exchange).

clfutures


WTI Crude Oil Trading Conclusion:


In short, oil has some extra risk around it. The recent move has been partly fueled by news overseas. So at any time oil could get a lift or take a hit by news that hits the wires. I tent to trade news related events with much less capital than I normally do because of this risk.

Happy Trading,
Chris Vermeulen

WANT MORE TRADE IDEAS? GET THEM HERE: THE GOLD & OIL GUY.COM


Saturday, March 8, 2014

What 10 Baggers (and 100 Baggers) Look Like

By Jeff Clark, Senior Precious Metals Analyst

Now that it appears clear the bottom is in for gold, it’s time to stop fretting about how low prices will drop and how long the correction will last—and start looking at how high they’ll go and when they’ll get there. When viewing the gold market from a historical perspective, one thing that’s clear is that the junior mining stocks tend to fluctuate between extreme boom and bust cycles. As a group, they’ll double in price, then crash by 75%..... then double or triple or even quadruple again, only to crash 90%. Boom, bust, repeat.

Given that we just completed a major bust cycle—and not just any bust cycle, but one of the harshest on record, according to many veteran insiders—the setup for a major rally in gold stocks is right in front of us.

This may sound sensationalistic, but based on past historical patterns and where we think gold prices are headed, the odds are high that, on average, gold producers will trade in the $200 per share range before the next cycle is over. With most of them currently trading between $20 and $40, the returns could be stupendous. And the percentage returns of the typical junior will be greater by an order of magnitude, providing life changing gains to smart investors.

What you’re about to see are historical returns of both producers and juniors during three separate boom cycles. These are factual returns; they are not hypothetical. And if you accept the fact that this market moves in cycles, you know it’s about to happen again.

Gold had a spectacular climb in 1979-1980, and gold stocks in general gave a staggering performance at that time—many of them becoming 10-baggers (1,000% gains and more). While this is a well known fact, few researchers have bothered to identify exact returns from specific companies during this era.

Digging up hard data from before the mid-1980s, especially for the junior explorers, is difficult because the information wasn’t computerized at the time. So I sent my nephew Grant to the library to view the Wall Street Journal on microfiche. We also include information we’ve had from Scott Hunter of Haywood Securities; Larry Page, then-president of the Manex Resource Group; and the dusty archives at the Northern Miner.

Note: This means our tables, while accurate, are not at all comprehensive.

Let’s get started…...

The Quintessential Bull Market: 1979-1980

The granddaddy of gold bull cycles occurred during the 1970s, culminating in an unabashed mania in 1979 and 1980. Gold peaked at $850 an ounce on January 21, 1980, a rise of 276% from the beginning of 1979. (Yes, the price of gold on the last trading day of 1978 was a mere $226 an ounce.)

Here’s a sampling of gold producer stock prices from this era. What you’ll notice in addition to the amazing returns is that gold stocks didn’t peak until nine months after gold did.

Returns of Producers in 1979-1980 Mania
Company Price on
12/29/1978
Sept. 1980
Peak
Return
Campbell Lake Mines $28.25 $94.75 235.4%
Dome Mines $78.25 $154.00 96.8%
Hecla Mining $5.12 $53.00 935.2%
Homestake Mining $30.00 $107.50 258.3%
Newmont Mining $21.50 $60.62 182.0%
Dickinson Mines $6.88 $27.50 299.7%
Sigma Mines $36.00 $57.00 58.3%
Giant Yellowknife Mines $11.13 $39.00 250.4%
AVERAGE 289.5%

Today, GDX is selling for $26.05 (as of February 26, 2014); if it mimicked the average 289.5% return, the price would reach $101.46.

Keep in mind, though, that our data measures the exact top of each company’s price. Most investors, of course, don’t sell at the very peak. If we were to able to grab, say, 80% of the climb, that’s still a return of 231.6%.

Here’s a sampling of how some successful junior gold stocks performed in the same period, along with the month each of them peaked.

Returns of Juniors in 1979-1980 Mania
Company Price on
12/29/1978
Price
Peak
Date
of Peak
Return
Carolin Mines $3.10 $57.00 Oct. 80 1,738.7%
Mosquito Creek Gold $0.70 $7.50 Oct. 80 971.4%
Northair Mines $3.00 $10.00 Oct. 80 233.3%
Silver Standard $0.58 $2.51 Mar. 80 332.8%
Lincoln Resources $0.78 $20.00 Oct. 80 2,464.1%
Lornex $15.00 $85.00 Oct. 80 466.7%
Imperial Metals $0.36 $1.95 Mar. 80 441.7%
Anglo-Bomarc Mines $1.80 $6.85 Oct. 80 280.6%
Avino Mines 0.33 5.5 Dec. 80 1,566.7%
Copper Lake $0.08 $10.50 Sep. 80 13,025.0%
David Minerals $1.15 $21.00 Oct. 80 1,726.1%
Eagle River Mines $0.19 $6.80 Dec. 80 3,478.9%
Meston Lake Resources $0.80 $10.50 Oct. 80 1,212.5%
Silverado Mines $0.26 $10.63 Oct. 80 3,988.5%
Wharf Resources $0.33 $9.50 Nov. 80 2,778.8%
AVERAGE 2,313.7%


If you had bought a reasonably diversified portfolio of top-performing gold juniors prior to 1979, your initial investment could have grown 23 times in just two years. If you had managed to grab 80% of that move, your gains would still have been over 1,850%.

This means a junior priced at $0.50 today that captured the average gain from this boom would sell for $12 at the top, or $9.75 at 80%. If you own ten juniors, imagine just one of them matching Copper Lake’s better than 100-bagger performance.

Here’s what returns of this magnitude could mean to you. Let’s say your portfolio includes $10,000 in gold juniors that yield spectacular gains such as the above. If the next boom cycle matches the 1979-1980 pattern, your portfolio could be worth $241,370 at its peak… or about $195,000 if you exit at 80% of the top prices.

Note that this does require that you sell to realize your profits. If you don’t take the money and run at some point, you may end up with little more than tears to fill an empty beer mug. In the subsequent bust cycle, many junior gold stocks, including some in the above list, dried up and blew away. Investors who held on to the bitter end not only saw all their gains evaporate, but lost their entire investments.
You have to play the cycle.

Returns from that era have been written about before, so I can hear some investors saying, “Yeah, but that only happened once.”

Au contraire. Read on…...

The Hemlo Rally of 1981-1983

Many investors don’t know that there have been several bull cycles in gold and gold stocks since the 1979-1980 period.

Ironically, gold was flat during the two years of the Hemlo rally. But something else ignited a bull market. Discovery. Here’s how it happened…...

Back in the day, most exploration was done by teams from the major producers. But because of lagging gold prices and the resulting need to cut overhead, they began to slash their exploration budgets, unleashing a swarm of experienced geologists armed with the knowledge of high potential mineral targets they’d explored while working for the majors. Many formed their own companies and went after these targets.

This led to a series of spectacular discoveries, the first of which occurred in mid 1982, when Golden Sceptre and Goliath Gold discovered the Golden Giant deposit in the Hemlo area of eastern Canada. Gold prices rallied that summer, setting off a mini bull market that lasted until the following May. The public got involved, and as you can see, the results were impressive for such a short period of time.

Returns of Producers Related to Hemlo Rally of 1981-1983
Company 1981
Price
Price
Peak
Date
of High
Return
Agnico-Eagle $9.50 $21.00 Aug. 83 121.1%
Sigma $14.13 $24.50 Jan. 83 73.4%
Campbell Red Lake $16.63 $41.25 May 83 148.0%
Sullivan $3.85 $6.00 Mar. 84 55.8%
Teck Corp Class B $17.00 $21.88 Jun. 81 28.7%
Noranda $33.75 $36.38 Jun. 81 7.8%
AVERAGE 72.5%

Gold producers, on average, returned over 70% on investors’ money during this period. While these aren’t the same spectacular gains from just a few years earlier, keep in mind they occurred over only about 12 months’ time. This would be akin to a $20 gold stock soaring to $34.50 by this time next year, just because it’s located in a significant discovery area.

Once again, it was the juniors that brought the dazzling returns.

Returns of Juniors Related to Hemlo Rally of 1981-1983
Company 1981
Price
Price
Peak
Date
of High
Return
Corona Resources $1.10 $61.00 May 83 5,445.5%
Golden Sceptre $0.40 $31.00 May 83 7,650.0%
Goliath Gold $0.45 $32.00 Mar 83 7,011.1%
Bel-Air Resources $0.81 $1.60 Jan. 83 97.5%
Interlake Development $2.10 $6.40 Mar. 83 204.8%
AVERAGE 4,081.8%

The average return for these junior gold stocks that had a direct interest in the Hemlo area exceeded a whopping 4,000%.

This is especially impressive when you realize that it occurred without the gold stock industry as a whole participating. This tells us that a big discovery can lead to enormous gains, even if the industry as a whole is flat.

In other words, we have historical precedence that humongous returns are possible without a mania, by owning stocks with direct exposure to a discovery area. There are numerous examples of this in the past ten years, as any longtime reader of the International Speculator can attest.

By May 1983, roughly a year after it started, gold prices started back down again, spelling the end of that cycle—another reminder that one must sell to realize a profit.

The Roaring ’90s

By the time the ’90s rolled around, many junior exploration companies had acquired the “intellectual capital” they needed from the majors. Another series of gold discoveries in the mid-1990s set off one of the most stunning bull markets in the current generation.

Companies with big discoveries included Diamet, Diamond Fields, and Arequipa. This was also the time of the famous Bre-X scandal, a company that appeared to have made a stupendous discovery, but that was later found to have been “salting” its drill data (cheating).

By the summer of ’96, these discoveries had sparked another bull cycle, and companies with little more than a few drill holes were selling for $20 a share.

The table below, which includes some of the better-known names of the day, is worth the proverbial thousand words. The average producer more than tripled investors’ money during this period. Once again, these gains occurred in a relatively short period of time, in this case inside of two years.

Returns of Producers in Mid-1990s Bull Market
Company Pre-Bull
Market Price
Price
Peak
Date
of High
Return
Kinross Gold $5.00 $14.62 Feb. 96 192.4%
American Barrick $28.13 $44.25 Feb. 96 57.3%
Placer Dome $26.50 $41.37 Feb. 96 56.1%
Newmont $47.26 $82.46 Feb. 96 74.5%
Manhattan $1.50 $13.00 Nov. 96 766.7%
Cambior $10.00 $22.35 Jun. 96 123.5%
AVERAGE 211.7%

Here’s how some of the juniors performed. And if you’re the kind of investor with the courage to buy low and the discipline to sell during a frenzy, it can be worth a million dollars. Hold on to your hat.

Returns of Juniors in Mid-1990s Bull Market
Company Pre-Bull
Market Price
Price
Peak
Date
of High
Return
Cartaway $0.10 $26.14 May 96 26,040.0%
Golden Star $6.00 $27.50 Oct. 96 358.3%
Samex Mining $1.00 $7.20 May 96 620.0%
Pacific Amber $0.21 $9.40 Aug. 96 4,376.2%
Conquistador $0.50 $9.87 Mar. 96 1,874.0%
Corriente $1.00 $19.50 Mar. 97 1,850.0%
Valerie Gold $1.50 $28.90 May 96 1,826.7%
Arequipa $0.60 $34.75 May 96 5,691.7%
Bema Gold $2.00 $12.75 Aug. 96 537.5%
Farallon $0.80 $20.25 May 96 2,431.3%
Arizona Star $0.50 $15.95 Aug. 96 3,090.0%
Cream Minerals $0.30 $9.45 May 96 3,050.0%
Francisco Gold $1.00 $34.50 Mar. 97 3,350.0%
Mansfield $0.70 $10.50 Aug. 96 1,400.0%
Oliver Gold $0.40 $6.80 Oct. 96 1,600.0%
AVERAGE 3,873.0%

Many analysts refer to the 1970s bull market as the granddaddy of them all—and to a certain extent it was—but you’ll notice that the average return of these stocks during the late ’90s bull exceeds what the juniors did in the 1979-1980 boom.

This is akin to that $0.50 junior stock today reaching $19.86… or $16, if you snag 80% of the move. A $10,000 portfolio with similar returns would grow to over $397,000 (or over $319,000 on 80%).

Gold Stocks and Depression

Those of you in the deflation camp may dismiss all this because you’re convinced the Great Deflation is ahead. Fair enough. But you’d be wrong to assume gold stocks can’t do well in that environment.

Take a look at the returns of the two largest producers in the U.S. and Canada, respectively, during the Great Depression of the 1930s, a period that saw significant price deflation.

Returns of Producers
During the Great Depression
Company 1929
Price
1933
Price
Total
Gain
Homestake Mining $65 $373 474%
Dome Mines $6 $39.50 558%

During a period of soup lines, crashing stock markets, and a fixed gold price, large gold producers handed investors five and six times their money in four years. If deflation “wins,” we still think gold equity investors can, too.

How to Capitalize on This Cycle

History shows that precious metals stocks move in cycles. We’ve now completed a major bust cycle and, we believe, are on the cusp of a tremendous boom. The only way to make the kind of money outlined above is to buy before the boom is in full swing. That’s now. For most readers, this is literally a once in a lifetime opportunity.

As you can see above, there can be great variation among the returns of the companies. That’s why, even if you believe we’re destined for an “all boats rise” scenario, you still want to own the better companies.

My colleague Louis James, Casey’s chief metals and mining investment strategist, has identified the nine junior mining stocks that are most likely to become 10 baggers this year in their special report, the 10-Bagger List for 2014. Read more here.


The article What 10-Baggers (and 100-Baggers) Look Like was originally published at Casey Research.


Wednesday, August 28, 2013

Precious Metals & Miners Flash Short-Sell Signal

It has been a bumpy ride for precious metal investors over the past couple of years and unfortunately we do not think its over just yet. But we feel fortunate to have our trading partner Chris Vermeulen on our team walking us through this.

Today Chris is telling us that the good news is that the bottom has likely been put in for gold, silver and gold miners BUT the recent rally in these metals and miner looks to be coming to an end. While we could see another pop in price over the next week or so the price, volume and momentum seem to be stalling out.

What does this mean? It means we should expect short term weakness and lower prices over the next month or two.

Here are three charts Chris posted several months. Their forecast were based off simple technical analysis using cycles, Fibonacci and price patterns. As you can see we are not trading at our key pivot level which we expect selling pressure to start to increase and eventually overpower the buyers sending the prices lower.....Click here to see Chris' complete chart work and article.


Monday, August 12, 2013

The SP500 Enters Major Correction Period

Our trading partner David A. Banister of Market Trends Forecast releases his call that the SP 500 is close to confirming new correction. Says 1685 support is the key. Here's the details based on his Elliot Wave research.

The SP 500 has been on a tear since late 2012 with the SP 500 bottoming at 1266. The rally though we have been charting out as part of a “Primary wave 3″ uptrend for this Bull market cycle from March 2009, and we are likely entering a Major correction or what we would label “Major wave 4″. Since the 1266 lows, we have had Major Wave 1, 2, and now 3 completed at 1710. We are entering Major wave 4 which should correct 23-38% of the entirety of Major wave 3, which was 444 points.

This correction will be confirmed with any close below 1674 and nails in the coffin begin with any close below 1685 on the SP 500 index. Primary wave 1 of this super bull cycle ended at 1370, a 704 point rally. Primary wave 3 will likely be larger than Primary wave 1 and I am projecting a top between 1900-2000 on the SP 500 before it’s completed. The current correction is Major wave 4 of Primary wave 3, which has 5 Major waves required. With that said, our projections are for 1605 on the shallow side and 1540 on the deeper side for Major wave 4 of Primary wave 3.

Now it is possible that we may extend a bit higher yet in Major wave 3 to 1736-1772, but only if we hold the 1685 support lines which the market is basing around currently. In any event, at our Trading service we have been aggressively taking profits in the past two weeks on multiple positions while still holding a few open at this time.

Below is a chart showing our projected correction pivots of 1605 and 1540, subscribers will be updated on a regular basis. Just click here to join Banister with a 33% discount on his trading service and also receive Precious Metals (GOLD) forecasts on a regular basis every week.

812 SP 500


John Carter releases DVD version of "Spread Trading Strategies for any size Account"....Click Here to get your copy!


Monday, June 17, 2013

SP 500 Extends Rally Off Thursdays Low

The September S&P 500 closed higher on Monday as it extends the rally off last Thursday's low. The mid range close sets the stage for a steady opening when Tuesday's night session begins trading.

Stochastics and the RSI are diverging but have turned neutral to bullish signaling that sideways to higher prices are possible near term. Closes above the 20 day moving average crossing at 1633.22 would confirm that a short term low has been posted. If September renews the decline off May's high, the 38% retracement level of the November-May rally crossing at 1545.59 is the next downside target.

First resistance is the 20 day moving average crossing at 1633.22. Second resistance is May's high crossing at 1678.00. First support is the 25% retracement level of the November-May rally crossing at 1591.35. Second support is the 38% retracement level of the November-May rally crossing at 1545.59.

Make sure to check out "Options Income Access" it's now LIVE!

Friday, April 5, 2013

The Long and Winding Gold....Bull Cycle about to Begin

The dramatic 2-3 day take down in Gold Spot pricing action smells and looks like capitulation to us at The Market Trend Forecast. We have been calling this entire 19-20 month consolidation period as a Primary wave 4 correction pattern, though complicated for sure. It has had multiple false rallies and buy and sell signals the entire time. With that said, the pattern is set up for final 5th wave decline which we are seeing now at the beginning of April.

Traditionally, Gold tends to meander or be weak in April anyways on a seasonal basis. This sets Gold up to rally in May into July with another soft patch, followed by a fall rally. However, our technical analysis is predicated on our Elliott Wave analysis, which says this entire 20 month correction is a “Double Three” correction pattern. Essentially its two ABC patterns with an “X” Wave rally in the middle to really confuse everyone.

The X wave took Gold to 1800 last fall before dumping all the Bulls off and eventually working its way down to the 1540’s levels we see today. This last leg down is a 5 wave decline and you know you’re at the bottom of wave 5 when everyone throws in the towel, the Gold stocks trade at multi year lows and relative valuation extremes. We also have insiders buying 7 to 1 over sellers according to Ink Research in the Gold stock sector. Stocks are valued at $923 per ounce equivalent even though Gold is trading north of $1,500 per ounce still.

We say bring it on and are actively accumulating selected Gold stocks with production profiles and growth metrics that are attractive.

See the Gold Elliott Wave analysis chart we sent to our paying subscribers a few days ago to forewarn of one more leg down. The next rally should be a doozy and have very few people on board. We would simply caution that a drop below $1523 spot pricing could lead to a blast down to the 1440-1460 areas, but its unlikely in our current views.

TMTFGold

Join us for regular updates at The Market Trends Forecast.com


Get our Free Trading Videos, Lessons and eBook today!