Showing posts with label earnings. Show all posts

Wednesday, February 15, 2017

Why It Feels Like the Dot Com Bubble All Over Again

By Justin Spittler

Today, we’re going to do something different. As you can imagine, we hear from our readers a lot. Some of them have nice things to say. Others…not so much. Most importantly, though, we get a lot of questions. Last week, we received a question that was so important, we’re dedicating this entire issue to it. This question might be something you’re wondering yourself…and it could have a huge impact on your money.

It comes from Joseph J., a subscriber to The Casey Report:
I read today’s newsletter (Trump Should Be Careful What He Wishes For) with great interest. In it you stated that “U.S. stocks are incredibly expensive…” But my question is: Based against what? We are in uncharted territory, and every single newsletter writer that I have asked this question of has failed to provide an answer. Perhaps you will be different.
Thank you for putting us in the hot seat, Joseph. Lucky for us, we didn’t make this claim lightly. We have plenty of facts to back it up. Before we show you the proof, you have to realize something: There are many different ways to value stocks. Everyone has their preference. A lot of folks use the price-to-earnings (P/E) ratio. Other investors look at a company’s book value or cash flow.

We prefer to use the cyclically adjusted price-to-earnings (CAPE) ratio.…
This ratio is the cousin of the popular P/E ratio. The only difference is that it uses 10 years’ worth of earnings instead of just the previous year’s. This smooths out the up and downs of the business cycle. It gives us a long-term view of the market. Right now, the CAPE ratio for companies in the S&P 500 is 28.4. That’s 70% higher than its historical average. U.S. stocks haven’t been this expensive since the dot com bubble.


This isn’t a good sign. As you may remember, the S&P 500 fell 41% from 2000–2002. The Nasdaq plunged 78% over the same period.

But the CAPE ratio is just one way to value stocks.…
To prove we’re not cherry picking, let’s look at some other metrics. First up, the price-to-sales (P/S) ratio. This ratio is just like the P/E ratio, but it uses the previous year’s sales instead of earnings. According to credit rating agency Standard & Poor’s, the S&P 500 currently trades at 2.02 times sales. That’s 40% higher than its historical average, and the highest level since at least 2000. Clearly, U.S. stocks are more expensive than normal. But that’s not even the main reason investors are nervous about them.

U.S. stocks seem to have lost touch with reality.…
As we all know, the stock market allows investors to own a piece of publicly traded companies. Most of the companies on the NYSE (New York Stock Exchange) are U.S. companies. Because of this, you would think the stock market would generally follow the health of the economy. If the economy’s booming, stocks should be soaring. If the economy’s struggling, stocks should be, too. That hasn’t been the case lately.

Since 2009, the S&P 500 has surged 239% to record highs. That makes this one of the strongest bull markets in U.S. history. During that same span, the U.S. economy has grown just 2% per year. That makes the current “recovery” one of the weakest since World War II. In short, Main Street hasn’t kept up with Wall Street.

The U.S. stock market is now clearly in “bubble territory”.…
Just look at the chart below. This chart compares the value of the U.S. stock market with the nation’s gross domestic income (GDI). GDI is like gross domestic product (GDP), but instead of measuring how much money a country spends, it measures how much money a country earns. It counts things like wages, corporate profits, and tax receipts. A high ratio means stocks are expensive relative to how much money an economy makes. You can see in the chart below that this key ratio is well above its housing bubble high. It’s now approaching the record high it hit during the dot-com bubble.


This is another serious red flag.…
But it doesn't mean stocks are going to crash next month, or next year. For this bubble to pop, something will have to prick it. We’re not sure what that will be…where it will come from…or when it will happen…
But we do know stocks don’t go up forever. Sooner or later, this bubble is going to end. When it does, many investors are going to take huge losses. Years’ worth of returns could disappear in a matter of months, even weeks.

The good news is that you can still crisis-proof your portfolio. Here are three ways to get started:
  1. Set aside more cash. Holding extra cash will help you avoid big losses if stocks fall. It will also put you in a position to buy stocks when they get cheaper.
  2. Own physical gold. Gold is the ultimate safe-haven asset. It’s survived every financial crisis in history. It will certainly survive the next one.
  3. Close your weakest positions. Start by selling your most expensive stocks. They tend to fall the hardest during major selloffs. You should also get rid of companies that need cheap debt to make money. If problems in the bond market continue, these companies could be in trouble.
These simple strategies could save you tens of thousands, possibly more, when the inevitable happens.

Chart of the Day

Miners are rallying again. Today’s chart shows the performance of the S&P/TSX Global Mining Index. This index tracks the performance of companies that mine commodities like gold, silver, aluminum, and copper. You can see that this index skyrocketed at the beginning of last year. It nearly doubled between January and July. Then, it went almost nowhere for six months.

Three weeks ago, the S&P/TSX Global Mining Index broke out of this sideways trading pattern. It’s now trading at its highest level since early 2015. This is very bullish. It tells us that mining stocks may have just entered a new phase of a bull market. If you’ve been thinking about buying mining stocks, now might be a good time to get in. But don’t worry if you don’t know what to buy.

We recently put together a presentation that talks about one of the richest gold deposits in the world. Our top gold analyst has never seen anything like this in his career. Early investors in the company that owns this deposit could make 1,000% or more. But this opportunity won’t last long. Just two months from now, this world-class mine will “go live.” When it does, this company’s stock should shoot through the roof. For more details on this incredible opportunity, click here.


Stock & ETF Trading Signals

Tuesday, January 31, 2017

Forget Dow 20,000… This Indicator Tells the Real Story

By Justin Spittler

It finally happened. For the last six weeks, the Dow Jones Industrial Average has been bumping against a ceiling. Yesterday, it broke through. The Dow topped 20,000 for the first time ever. Most investors are excited about this. After all, 20,000 is a big, round number. It feels like a psychological win for the bulls.

But it’s not an invitation to dive into stocks…not yet, at least. We need to see if the Dow can hold this level.
If it closes the week above 20,000, stocks could keep rallying. If it doesn’t, nothing has really changed. It could even be a warning sign. Until then, sit tight. Don’t chase stocks higher…stick to your stop losses…and hold on to your gold.

Don’t lose sight of the big picture, either.…

Remember, U.S. stocks are still very risky:
➢ They’re expensive. The S&P 500 is trading at a cyclically adjusted price-to-earnings ratio (CAPE) of 28.4. That means large U.S. stocks are 70% more expensive than their historical average.
➢ We’re still in a profits recession. Profits for companies in the S&P 500 stopped growing in 2014.
➢ And Donald Trump is president of the United States. Trump could do wonders for the economy and stock market. But he could also unleash a major financial crisis. It's still too early to tell.

As you can see, "Dow 2,000" isn't necessarily a reason to celebrate. In fact, as we told you two weeks ago, there's something much more important you should be watching right now.

The bond market is flashing danger.…
The bond market is where companies borrow money. It’s the cornerstone of the global financial system.
It’s also bigger and more liquid than the stock market. This is why the bond market often signals danger long before it shows up in stocks.

The bond market started to unravel last summer.…
Just look at U.S. Treasury bonds. In July, the 10-year U.S. Treasury hit a record low of 1.37%. Since then, it’s nearly doubled to 2.55%. This is a serious red flag. You see, a bond’s yield rises when its price falls. In this case, yields skyrocketed because bond prices tanked. The same thing has happened in long term Treasury, municipal, and corporate bonds.

Bill Gross thinks bonds are entering a long-term bear market.…
Gross is one of the world’s top bond experts. He founded PIMCO, one of the world’s largest asset managers. He now runs a giant bond fund at Janus Capital. Two weeks ago, Gross said the bull market in bonds would come to an end when the 10-year yield tops 2.6%. Keep in mind, bonds have technically been in a bull market since the 1980s.

According to Gross, this number is far more important than Dow 20,000. And we’re only 50 basis points (0.5%) from hitting it. In other words, the nearly four-decade bull market in bonds could end any day now.
When it does, Gross says bonds will enter a secular bear market... meaning bonds could fall for years, even decades. This is why Casey Research founder Doug Casey has urged you to “sell all your bonds.”

If you haven’t already taken Doug’s advice, we encourage you to do so now.…
You should also take a good look at your other holdings. After all, problems in the bond market could soon spill over into the stock market. If this happens, utility stocks could be in big trouble. Utility companies provide electricity, gas, and water to our homes and businesses. They sell things we can’t live without. Because of this, most utility companies generate steady revenues. This helps them pay dependable dividends.

Many investors own utility stocks just for their dividends.…
That’s why a lot of people call them “bond proxies.” Utility stocks don’t just pay generous income like bonds, either. They also trade with bonds. You can see this in the chart below. It compares the performance of the Utilities Select Sector SPDR ETF (XLU) with the iShares 20+ Year Treasury Bond ETF (TLT). XLU holds 28 utility stocks. TLT holds long-term Treasury bonds. XLU has traded with TLT for the better part of the last year. Both funds crashed after the election, too. But XLU has since rebounded.


You might find this odd. After all, the two funds basically moved in lockstep until a couple months ago.
But there’s a perfectly good explanation for this.…

Utility stocks pay more than Treasury bonds.…
Right now, XLU yields 3.4%. TLT yields 2.6%. That might not sound like big deal. But those extra 80 basis points (0.8%) provide a margin of safety. You see, the annual inflation rate is currently running at about 2.1%. That means the U.S. dollar is losing 2.1% of its value every year.

That’s bad news for everyday Americans. It’s also bad for bondholders. It means investors who own TLT are earning a “real” return (its dividend yield minus inflation) of 0.5%. Meanwhile, you’d be earning a real return of 1.3% if you owned XLU. Of course, utility stocks should pay more than government bonds. They’re riskier, after all. Unlike the government, utility companies can’t print money whenever they want. If they run into financial problems, they could go out of business.

Today, investors don’t seem to mind taking on extra risk for more income. But that could soon change…

Inflation could skyrocket under Donald Trump.…
If you’ve been reading the Dispatch, you know why. For one, Trump wants to spend $1 trillion on infrastructure projects. While this could help the economy in the short run, the U.S. government will have to borrow money to fix the country’s decrepit roads, bridges, and power lines. This would likely produce a lot more inflation. If that happens, real returns could shrink even more. And that could trigger a selloff in utility stocks and other "bond proxies," like telecom and real estate stocks. In short, if you own these types of stocks just for their dividends, you might want to consider selling them now.

We recommend sticking to dividend-paying stocks that meet the following criteria.…
The company should be growing. If it isn’t, you probably own the stock just for its dividend. That’s a bad strategy right now. It should have a low payout ratio. A payout ratio can tell us if a company’s dividend is sustainable or not. A payout ratio above 100% means a company is paying out more in dividends than it earns in income. Avoid these companies whenever possible.

It shouldn’t depend on cheap credit. After the 2008 financial crisis, a lot of companies borrowed money at rock-bottom rates to pay out dividends. If rates keep rising, these companies could have a tough time paying those dividends. If you own stocks that check these boxes, your income stream should be in good shape for now.


Chart of the Day

“Trump Years” stocks are on a tear. We all know U.S. stocks took off after the election. But some stocks did better than others. Bank stocks spiked on hopes that Trump would deregulate the financial sector. Oil and gas stocks rallied because Trump is pro-energy. Industrial stocks have also surged since Election Day.

Industrial companies manufacture and distribute goods. They include construction companies and equipment makers. E.B. Tucker, editor of The Casey Report, thinks these companies will stay very busy while Trump rebuilds America’s hollowed out economy.

He’s so sure of it that he recommended four “Trump Years” stocks last month. One of those stocks is up 11% in just six weeks. Yesterday, it spiked 8% after the company crushed its fourth quarter earnings report.
The company announced higher sales, fatter profits, and lower taxes. It raised its guidance for the year. In other words, it expects to make a lot more money this year…now that Trump’s in charge.

You can learn about this company and E.B.’s other “Trump Years” stocks by signing up for The Casey Report. Click here to begin your free trial.


Stock & ETF Trading Signals

Wednesday, June 8, 2016

The 83 Best Stocks to Trade Weekly Options

Why download the 83 best stocks for weekly options? Our trading partner Don Kaufman will tell us why and he is sharing with us the 877 stocks and ETFs that offer weekly options, and the 83 that are the only ones you should trade.

Your Portfolio Deserves More Than a 50/50 Chance
It has been shown statistically, over the long run, that most traders lose money when only buying monthly options. Today there is more volume on weekly options than on the monthly options. Never before has there been a way to generate positive returns in the market using weekly options. Why flip a coin when you can use the 50 best stocks to trade weekly options on?

Diversification is Dead
As a Wall Street saying goes, "When they raid the house they take everyone." Professionals consider diversification as a hedge for people who don’t know how to hedge. Think about it - would you protect the value of your own home against a potential fire by diversifying, that is, buying two houses so if one burns down, the appreciation in the other offsets your loss? Of course not! You insure your home so if it burns down, the insurance covers most of the loss. Welcome to using weekly options. Real professionals know how to use weekly options to protect their portfolio from weekly news events, earnings reports, or surprise upgrades and downgrades.

Be The House
Today, investing in the stock market is a big gamble, almost like going to Vegas and playing the slots. And we all know what happens with slot machines. The House always wins. It may take a loss occasionally, but the overall strategy assures that the House will always come out on top. Weekly options let's you turn the tide and be the house every single week! Download the 50 best stocks to trade weekly options on so you can put the odds in your favor.

Just click here to to get the 83 BEST stocks for weekly options and the bonus free TheoVideo daily video newsletter will be included.....Download Now


Get Don's latest FREE eBooK "The Rebel's Guide to Trading Options"....Just Click Here


Friday, May 27, 2016

Hundreds of Oil Stocks Could Go to Zero…Will You Still Be Owning One of Them?

By Justin Spittler

The largest shale oil bankruptcy in years just happened. If you own oil stocks, you'll want to read today's essay very closely. Because there's a good chance hundreds more oil companies will go bankrupt soon. As you probably know, the oil market is a disaster. The price of oil has plunged 75% since 2014. In February, oil hit its lowest level since 2003.

Oil crashed for a simple reason: There’s too much of it. New methods like “fracking” have led to a huge spike in global oil production. Today, oil companies pump about 1 million more barrels a day than the world uses.

Last year, America’s biggest oil companies lost $67 billion..…

To offset low prices, oil companies have slashed spending by 60% over the past two years. They’ve laid off more than 120,000 workers. They’ve sold assets and abandoned projects. Some have even cut their prized dividends.

For many oil companies, deep spending cuts weren’t enough…

The number of bankruptcies in the oil industry has skyrocketed….

Bloomberg Business reported earlier this month:
Since the start of 2015, 130 North American oil and gas producers and service companies have filed for bankruptcy owing almost $44 billion, according to law firm Haynes & Boone.
And that doesn’t even include two “big name” bankruptcies in the last couple weeks. Two weeks ago, Linn Energy filed for bankruptcy, making it the largest shale oil bankruptcy since 2014. It owes lenders $8.3 billion.

A week later, SandRidge Energy declared bankruptcy. It became the second biggest shale oil company to go bankrupt. The company owes its lenders about $4.1 billion. Ultra Petroleum, Penn Virginia, Breitburn Energy, and Halcón Resources also filed for bankruptcy in the past couple weeks.

Hundreds more oil companies could go bankrupt this year..…

The Wall Street Journal reported last week:
This year, 175 oil and gas producers around the world are in danger of declaring bankruptcy, and the situation is nearly as dire for another 160 companies, many in the U.S., according to a report from Deloitte’s energy consultants.
Defaults by oil and gas companies are already skyrocketing. The Wall Street Journal continues:
Oil and gas companies this year have defaulted on $26 billion, according to Fitch Ratings data. That figure already surpasses the total for 2015, $17.5 billion.
Fitch, one of the nation’s largest credit agencies, expects 11% of U.S. energy bonds to default this year. That would be the highest default rate for the energy sector since 1999.

Many investors thought the oil crisis was over..…

That’s because the price of oil has surged 80% since February. Dispatch readers know better. For months, we’ve been warning there would be more bankruptcies and defaults. We said many oil companies need $50 oil to make money. The price of oil hasn’t topped $50 a barrel since last July. Even after its big rally, oil still trades for about half of what it did two years ago.

Oil prices will stay low as long as there’s too much oil..…

Although the world still has too much oil, the surplus has shrunk in the past few months. In February, the global economy was oversupplied by about 1.7 million barrels a day. Thanks to U.S. production cuts, the surplus is now just 1.0 million barrels a day. The number of rigs actively looking for oil in the U.S. has dropped by 80% since October. This month, the U.S. oil rig count hit its lowest level in 70 years.

However, many other countries aren’t cutting production at all. Saudi Arabia and Russia, two of the world’s biggest oil-producing countries, are both pumping near-record amounts of oil. Frankly, these countries don’t have much choice. Oil sales account for 77% of Saudi Arabia’s economy. And oil accounts for 50% of Russia’s exports. If these countries stop pumping oil, their economies could collapse.

Low prices have made it impossible for some oil companies to pay their debts..…

U.S. oil companies borrowed nearly $200 billion between 2010 and 2014. If you’ve been reading the Dispatch, you know the Federal Reserve is mostly to blame for this. It’s held its key interest rate near zero since 2008. This made it incredibly cheap to borrow money. When oil prices were high, the debt wasn’t an issue. Companies made enough money to pay the bills. That’s no longer the case. Today, many oil companies are burning through cash to pay their debts.

To make matters worse, many weak oil companies have been cut off from the credit market..…

Before prices collapsed, oil companies could refinance their debt if they ran into trouble. This could buy them time to sort out their problems. These days, many banks will no longer lend oil companies money. Bloomberg Business reported last month:
Almost two years into the worst oil bust in a generation, lenders including JPMorgan Chase & Co., Wells Fargo & Co. and Bank of America Corp. are slashing credit lines for struggling energy companies…
Since the start of 2016 lenders have yanked $5.6 billion of credit from 36 oil and gas producers, a reduction of 12 percent, making this the most severe retreat since crude began tumbling in mid-2014.
Oil stocks are still very risky..…

But that doesn’t mean you should avoid them entirely. As we’ve said before, oil stocks have likely entered a new phase. You see, when oil prices first tanked, investors sold oil stocks indiscriminately. Both strong and weak stocks plunged. In other words, investors “threw the baby out with the bath water.” You often see this behavior during a crisis.

Exxon Mobil (XOM), the world’s biggest oil company, fell 34% since 2014. Chevron (CVX), the world’s second biggest, dropped 48%. Now that oil has stabilized, the stronger companies are separating themselves from the weaker companies. This year, Exxon is up 15%. Chevron is up 11%. The crash in oil prices has given us a chance to buy world class oil companies at deep bargains.

If you want to own oil stocks, stick with the best companies..…

If you're going to invest in the sector, there are four key things to look for: 

Make sure you buy companies that can 1) make money at low oil prices. You should also look for companies with 2) healthy margins 3) plenty of cash and 4) little debt.

In March, Crisis Investing editor Nick Giambruno recommended a company that hits all of these checkmarks. It has a rock-solid balance sheet…some of the industry’s best profit margins…and “trophy assets” in America’s richest oil regions. It can even make money with oil as cheap as $35.

The stock is up 9% in two months. But Nick thinks it could just be getting started. After all, it’s still 30% below its 2014 high. You can get in on Nick’s oil pick by signing up for Crisis Investing. If interested, we encourage you to watch this short presentation. It explains how you can access Nick’s top investing ideas for $1,000 off our regular price.

This incredible deal ends soon. Click here to take advantage while you can.

You’ll also learn about an even bigger “crisis investing” opportunity on Nick’s radar. This coming crisis could radically change the financial future of every American. By watching this video, you’ll learn how to profit from it. Click here to watch.

Chart of the Day

Oil and gas companies are losing billions of dollars, we’re in earnings season right now. This is when companies tell investors if their earnings grew or shrunk last quarter. A good earnings season can send stocks higher. A bad one can drag stocks down.

As of Friday, 95% of the companies in the S&P 500 had shared first quarter results. Based on these results, the S&P 500 is on track to post a 6.8% decline in earnings. That would be the biggest drop in quarterly earnings since the 2009 financial crisis.

Oil and gas companies are a big reason U.S. stocks are having such a horrible earnings season.

As you can see below, first-quarter earnings for energy companies in the S&P 500 have plunged 107% since last year. Keep in mind, this group includes Exxon, Chevron, and other blue chip energy stocks.

Again, if you’re looking to buy oil stocks, make sure you “look under the company’s hood” before you buy it. Steer clear of companies that are losing money and have a lot of debt.


Get our latest FREE eBook "Understanding Options"....Just Click Here!


Sunday, August 2, 2015

Distressed Investing

By Jared Dillian 

When most people think of distressed investing, they think of buying CCC-rated bonds at 20 or 30 cents on the dollar, then maybe sitting in bankruptcy court to divvy up the capital structure, making healthy risk-adjusted returns in the end. You just need to hire a few lawyers.

Distressed investors are a different breed of cat. It’s one of those countercyclical businesses, like repo men, who do well when everyone else is getting hammered.

I remember distressed guys killing it in 2002. Most people remember the dot-com bust, but there was a nasty credit crunch that went along with it. Nasty. High yield/distressed investments had some amazing years in 2003 and 2004. Convertible bonds in particular.

Funny thing about distressed investors is that they like to stay within their comfort zone. In my experience, they’re not keen on commodities. Like coal mining, which this week saw one bankruptcy filing and another one in the works. Distressed guys hate commodities because they are just timing the earnings cycle – which is the same as market timing.  Distressed guys want less volatile earnings so their projections aren’t totally dependent on commodity prices rising.

Coal is distressed, all right. But you don’t see the distressed guys getting involved. Even they are too scared!


Here’s a somewhat controversial statement: I think most commodities are distressed. Coal is definitely distressed. So is iron ore. Copper, too. And yes, even gold. Corn and beans have had a nice little run, but metals and energy in particular have been a complete horrorshow.

So I think it’s time to start looking at commodities as a distressed asset class. The assumption is that fair value of these commodities/producers is well above current market prices, and current market prices are wrong because of, well, a lot of things. In particular, a self-reinforcing process where selling begets more selling.

If you’re a distressed investor and you’re buying something at a deep discount, if you have a long enough time horizon, you’ll be vindicated eventually. Sometimes, it takes a long time. Sometimes, not very long at all. It’s pretty great when it works.

I have never had much aptitude for it. But I am trying it now.

Gold: A Special Case


Gold is a little different.

How do you value gold? It has no cash flows. An industrial commodity like copper is pretty easy to value. With gold, you’re trying to gauge investment demand (at the retail or sovereign level), which is hard, against mining production, which is a little easier.

But what an ounce of gold is worth is entirely subjective. More subjective than copper or cocoa or coffee. For example, if everyone started using bitcoin, there would be little to no demand for gold. (For the record, I think cryptocurrencies indeed have had an impact on gold demand.)

Basically, people want gold when they think their government no longer cares about the purchasing power of their currency. In our case, that was when the Fed was conducting quantitative easing, known colloquially as printing money.

But that’s not really what people were nervous about. Think about it. The Fed was printing money for monetary policy reasons. They were trying to effect monetary policy with interest rates at the zero bound. That’s different from printing money to buy government bonds because nobody else wants to. That’s called debt monetization.

When budget deficits get sufficiently large, people worry about things like failed bond auctions, that the Fed will have to step in and be the buyer of last resort. This is the nightmare scenario described in Greenspan’s Gold and Economic Freedom essay.

We had $1.8 trillion deficits not that long ago. The bond auctions were a little scary. I thought debt monetization was a possibility.

The deficit is lower today, mostly because of higher taxes, more aggressive revenue collection, and economic growth. As you can see, the price of gold has corresponded almost perfectly with the budget deficit.


With a small deficit today, nobody cares about gold.

Is the deficit going higher or lower in the future? Higher. Ding-ding-ding, we have a winner. One of the reasons I’m happy owning gold as a part of my portfolio.

Paper vs. Things


Asset allocation gets a lot easier when you figure out that the financial markets are a tug-of-war between paper and things. Sometimes, like now, financial assets (stocks and bonds) outperform. Stocks are overpriced, and bonds are way overpriced. Other times, like 10 years ago, commodities outperformed.

It has to do with the degree of confidence people have in… other people. A bond is a promise to repay. A stock is a promise to pay dividends, or that there will be something left over at the end. A dollar is a promise that it’s worth something, namely, a divisible part of the sum total of the productive abilities of all the people in the country.

These are pieces of paper. Paper promises. When confidence in promises is high, nobody needs gold, coal, or copper. When confidence in promises is low, time to build that underground bunker in the backyard. Confidence in promises is currently at all-time highs. Without making a positive statement either way, I’d say that only in the year 2000 were commodities more undervalued than they are right now.

Sidebar: it is tempting to treat commodities as an asset class, but you should try not to. They are idiosyncratic, and for most commodities, the cost of carry is high enough that it’s impractical to hold them for long periods of time.

Commodity related equities are a different story.

Disclaimer


I’m kind of biased on this, and I always think commodities are undervalued because I’m a deeply suspicious person and I don’t believe promises. I’ve owned gold and silver for years (plus GLD and SLV, and GDX and SIL), and if prices get low enough, I will add to those positions.

Keep in mind that I worked for the government under the Clinton administration. Clinton’s mantra to government employees was, “Do more with less.” The man did a lot to restrain the growth of government—and he was a Democrat!


People resented him for it. They wanted their fancy toys and their boondoggles. Public servants have been much happier under Bush and Obama. Not coincidentally, gold bottomed in 2000, at the end of Clinton’s presidency, and has basically been going up since.

So here is the secret sauce: You want to know when commodities are going up?
Watch the deficit. If someone dreams up free college for everyone, buy commodities with veins popping out of your neck.
Jared Dillian
Jared Dillian

If you enjoyed Jared's article, you can sign up for The 10th Man, a free weekly letter, at mauldineconomics.com. Follow Jared on Twitter @dailydirtnap


The article The 10th Man: Distressed Investing was originally published at mauldineconomics.com.


Get our latest FREE eBook "Understanding Options"....Just Click Here!


Friday, April 10, 2015

How to Find High Probability Earnings Trades....This Weeks Free Webinar

Our trading partner John Carter of Simpler Options is back with another one of his wildly popular free webinars. This time around it's "How to Find High Probability Earnings Trades"......Register Now

This free webinar will be held this Tuesday April 14th at 8 p.m. eastern time.

In this webinar John will discuss......

  *  Why earnings announcements offer a quarterly opportunity you may want to      take off from work for
  *  Why playing big price movement is not the only way to trade around earnings
  *  How to plan around earnings season each quarter so you’re not caught by surprise
  *  How to avoid the common mistake traders make around earnings
  *  The simple way to know which options to trade around earnings so you never pick the wrong one

And much more…..

Don’t worry, if you can’t attend live. We’ll send you a link to the recorded webinar within 24-48 hours. But you must pre-register for the event.

Just Click Here to Complete Registration

See you Tuesday,
The Stock Market Club


Get our latest FREE eBook "Understanding Options"while you can....Just Click Here!

Monday, July 21, 2014

Beware of Flashy Stock Repurchases When The Market Is on The Rise

By Andrey Dashkov

Retail giant Bed Bath & Beyond just announced plans to buy back another $2 billion in shares, which the company will start doing after it completes its current share repurchase program. You’ve seen it before: Press releases emphasize that buybacks return value to shareholders, analysts sometimes rely on repurchases to spot a stock to write up next, and management likes to tout their focus on shareholder returns. But what’s the real story? Why would a company buy its own shares?


There are but a few situations when returning cash to shareholders instead of paying dividends or investing in new projects is prudent:
  • The company has largely exhausted investment opportunities that would generate a positive net present value (NPV).
  • The stock is trading below its intrinsic value; or
  • The tax on dividends is so high compared to the capital gains tax that it makes sense to boost the share price and let shareholders enjoy the extra return instead of receiving heavily taxed dividends.
When these situations happen we support repurchases. In the reality, however, managers often have their own reasons to buy back shares; let’s look at the more popular ones.

First, management’s compensation is often based on share price performance or earnings based metrics like earnings per share (EPS), which buybacks are designed to boost.

Second, higher share price increases the value of a company’s options. Managers are often shareholders, too, but unlike you and me, they have direct access to the Treasury. When managers own a lot of their own company’s stock, they may have too much skin in the game. This may skew their preferences toward increasing the share price at the expense of long term business growth.

Third, share buybacks became a standard (and often abused) signal to the market that: a) the company’s stock is undervalued, and b) that management takes care of the shareholders. Both of these statements may be correct in isolation, based on the company’s fundamentals and management practices. Nonetheless, a buyback should not convince you that either is true.

One additional reason is often overlooked. Many a CEO has been fired for an acquisition that did not work out. When the decision is made to dump the acquisition, it is accompanied by a write off against earnings, sometimes worth billions of dollars. Wall Street armchair quarterbacks are quick to point out how much better off shareholders would have been if they had just paid out what they lost in dividends. Buying back company shares, with all the accompanied hoopla, is less likely to be a career threatening move.

Linking the two subjects together makes for nice copy; however, keep it in perspective. For example, a technology company that realizes their product line is becoming obsolete will often make acquisitions to increase their product line market share, or move them into a new business with long term potential. Buying back company stock, then having to go into the market and borrow at high interest rates, might be the exact wrong move. The key is making the right acquisitions for the company to continue to grow and pay dividends for the next generation.

In fact, managers have proven to be pretty bad stock pickers even when they have only one stock to pick. As my colleague Chris Wood showed in A Look at Stock Buybacks, managements have bought shares of their own companies at pretty bad times in the past. Moreover, the expectations of higher valuation based on higher EPS did not always materialize. Even though a lot of investors use P/E as their main gauge of value (which they shouldn’t), there is no convincing evidence that buybacks can support high valuation multiples in the long term.

Your Bottom Line


History has shown that the only value-creating buybacks were the ones carried out when stocks were deeply undervalued. In those instances, the repurchases helped companies outperform the market. But overall the optimism and confidence inducing press releases that accompany buybacks should be taken with a huge grain of salt.

As a rule of thumb, beware of increased buybacks when the market is on the rise (everybody is an investment guru when everything is going up) or when management compensation is closely tied to the share price performance or earnings based metrics. Companies with better corporate governance may fare better when it comes to managing conflicts of interest, but there is a significant vested interest there that investors should be aware of. Don’t mistake noise for a sign is all.

When it comes to returning value to shareholders, we appreciate companies that invest in long term projects—or pay dividends. Despite the potential tax implications, the yield strapped investors may be better served with a special dividend these days than with a promise of a better price in the future.

Learn more ways to cut through press rhetoric by signing up for our free weekly e-letter, Miller’s Money Weekly, where my colleagues and I share timely financial insight tailored for seniors and conservative investors alike.

Sign up here, and we’ll send a complimentary copy straight to your inbox every Thursday


Get the complete schedule for the Premier Trader University free trading webinars....Just Click Here!
 

Wednesday, November 27, 2013

Fundamentals Rendered Irrelevant by Fed Actions: Probability Based Option Trading

The fundamental backdrop behind the ramp higher in equity prices in 2013 is far from inspiring. However, fundamentals do not matter when the Federal Reserve is flooding U.S. financial markets with an ocean of freshly printed fiat dollars.

As we approach the holiday season, retail stores are usually in a position of strength. However, this year holiday sales are expected to be lower than the previous year based on analysts commentary and surveys that have been completed. This holiday season analysts are not expecting strong sales growth. However, in light of all of this U.S. stocks continue to move higher.

Earnings growth, sales growth, or strong management are irrelevant in determining price action in today’s stock market. In fact, the entire business cycle has been replaced with the quantitative easing and a Federal Reserve that is inflating two massive bubbles simultaneously.

Through artificially low interest rates largely resulting from bond buying, the Federal Reserve has created a bubble in Treasury bonds. In addition to the Treasury bubble, we are seeing wild price action in equity markets as hot money flows seek a higher return. Usually fundamentals such as earnings, earnings estimates, and profitability drive stock prices.

However, as can be here the U.S. stock market is being driven by something totally different......Read "Fundamentals Rendered Irrelevant by Fed Actions: Probability Based Option Trading"


Get our "Options Trading Test Drive Today!


Wednesday, August 7, 2013

Doubting your ability to pick the perfect stock?

Our trading partners at Premier Trader University are gearing up for another great free webinar on Thursday. This week we'll be focusing on trading ETF's around earnings season. This is especially interesting if you have been doubting your ability to pick the perfect stock?

Why not skip the pressure. Exchange Traded Funds (ETFs) are traded in a basket so you don't have to pick just one.

In this webinar, we'll tell you our favorite ETFs to trade with Options. With these hidden gems, you'll receive exposure to different countries trading just a single product. Plus, we'll let you in on a little secret, trading ETFs are a perfect for trading around earnings seasons. And we'll show you how it's done.

Just click here to get Your logins for Thursdays webinar

See you Thursday,

Ray @ The Stock Market Club

Get our complete schedule for our FREE Trading Webinars


Friday, April 26, 2013

Where is the Larger Bubble: the S&P 500 Index or U.S. Treasuries?

Today we have a plethora of companies reporting earnings and are moving through the 1st Quarter earnings season at a rapid pace. Thus far, earnings have been far from exciting and have made the previous 2013 forward earnings estimates laughable.

The only way we get to the proposed valuations is through multiple expansion which is simply going to require the Federal Reserve to continue to pump $85 billion into Treasury’s and MBS securities each month. I am confident they will comply.

There are a few analysts out there who are discussing the potential bubble forming in equities and other risk assets as Bernanke’s plan is working to the extent that asset prices are rising. However, even fewer analysts are pointing out that both retail and institutional money is constantly chasing yield at this point.

Simply take a look at the 2013 price action in high yield dividend paying stocks, high yield bonds, preferred stocks, and master limited partnerships. It is safe to say that a bubble has formed not just in equities, but in various fixed investments as well.

Consider the following chart of the S&P 500 Index (SPX) shown as the dotted trendline and Johnson & Johnson (JNJ) shown as the solid black line.....Read the entire article "Where is the Larger Bubble: the S&P 500 Index or U.S. Treasuries"


Click here to Download the 'NEW' Iron Condor Trading Strategy

Tuesday, July 24, 2012

How To Position Yourself for a 10 Year Pattern Breakout

As mentioned last Friday just before things took a dive on the weekend, a look at the major market indices did not look promising. If we take an even longer term look and examine the monthly charts we can see that The S&P 500 as well as the Dow Jones have been approaching multi decade rising channel resistance lines. Further, they also appear to be forming bearish rising wedge patterns.

Monthly Long Term Chart Analysis & Thoughts....

As many of my longer term subscribers can attest to, I always preach that technical analysis is one part art and one part science: you can never be completely certain on what the outcome of a pattern is going to be. However, we can use historical analysis to make better investments. The great American Novelist Mark Twain probably said it best in that “history does not repeat itself, but it rhymes”. Regarding a rising wedge pattern, we know that roughly two thirds of the time they will break to the downside. This also means that one third of the time they break to the upside.

In accomplishing our goal of capital growth we must do a number of things. We must make returns on our investments, we must protect our investments, and we must limit our losses. While all three aspects work in tandem with each other, there are times when focus must be allocated to one specific approach.

Regarding the current technical setup, I’m not so focused on the 67% chance that these wedges will break to the downside, but more so the impact of each outcome on the average Joe’s portfolio and mom and pop businesses. The S&P 500 and the Dow are approaching long term resistance lines that have been in place for decades. If we do break to the downside, which I suspect we will, there could be a very significant sell off with consequences that no one can predict at this point though I mention some things in the chart above. Alternatively, there is significant overhead resistance in the various indices, and I don’t believe an upside break would be too monumental.

That being said, I always like to keep an open outlook and wait for the right opportunity. I’m trying to think of scenarios that would prelude further upside action and I really am not coming up with much. As evidenced by the completion of the recent 5 wave uptrend on the S&P that coincided nicely with the various quantitative easing policies, Ben Bernanke and the fed have had less and less impact. I truly can’t see many fiscal developments that would prompt any significant bullish action.

The only scenario I really think that could pump up equities is a series of positive earnings announcements. A lot of expectations, earnings numbers, guidance, etc… have been revised downwards over the last couple of quarters, so there is the opportunity for some positive surprises that could lead to some bullish price action. In absence of such a scenario, I really can’t think of much else that would prompt a run up.

Look at these charts of positive and negative earnings surprises… and the dates and remember what happened following this negative data....

Positive Earnings Surprise


Negative Earnings Surprise


That being said, I am recommending two courses of action. For those steadfast bulls, lock in some profits and/or buy some protection. Missing out on some of the upside is a lot better than losing some of the gains you have fought so hard for over the past couple of years. For the more aggressive traders and investors, start following my updates a little more regularly as I foresee many shorting opportunities coming up in the future. As many of you know, sell offs are often quick and abrupt, and timing is extremely important when playing the downside.

Further, trading could get very volatile in the near future. Historically, and even more so looking forward as August and September have been very costly for the average investor. Our focus will be in taking the highest probability trades that offer the best risk to reward scenarios. There will be times when we miss trades, and times when they’re not timed perfectly. But, as those who have been with me for a while can attest to, patience pays off in the long run....

Join my Free Market Analysis & Trade Idea Newsletter > Now at The Gold & Oil Guy

Chris Vermeulen

Get our Free Trading Videos, Lessons and eBook today!

Saturday, July 21, 2012

Put Your Seatbelts On, It’s About To Get Bumpy!

It was just about a year ago today when the S&P was sitting at fresh highs and everyone was enjoying a rather upbeat summer. It was a nice summer, the markets were calm, and there was a surreal sense of optimism. Then, in the matter of a few days, things got real ugly, real quickly.

Well, it doesn’t seem like too much has changed since then. We’ve had mixed earnings reports, ever evolving worries in Europe, and the always looming fiscal mess in the U.S. Once again, are we in the calm before the storm?

It looks like things in Europe may start to heat up again. Riots turned violent again in Spain as protestors took to the street over austerity measures. With seemingly no resolution, a sinking tourism industry in the PIGS, and a typically hot summer August on its way, all signs point to further turmoil.

Technically, we’re currently seeing a number of bearish indicators setting up in the S&P and other markets. First, on the weekly chart of the SP500 Futures we can see what appears to be a bear flag formation developing. Note the recent rise in price since the beginning of June on decreasing volume.


Weekly SP500 Futures Chart Patterns


Daily Chart Elliott Wave Count For SP500

A second look at the S&P daily illustrates a down trend and 5 wave count bounce in the market, both are currently pointing to lower prices.

>> Completion of two intermediate cycles within longer term 5 wave pattern

>> Downwards wave one from April until beginning of June followed by wave 2 correction from June until present.

The wave two correction typically proceeds the longest wave, wave three, which is pointing towards a large move down (Note that in the first shorter term cycle the downwards wave three was the longest by far. We expect the same to be repeated in the longer term cycle.)


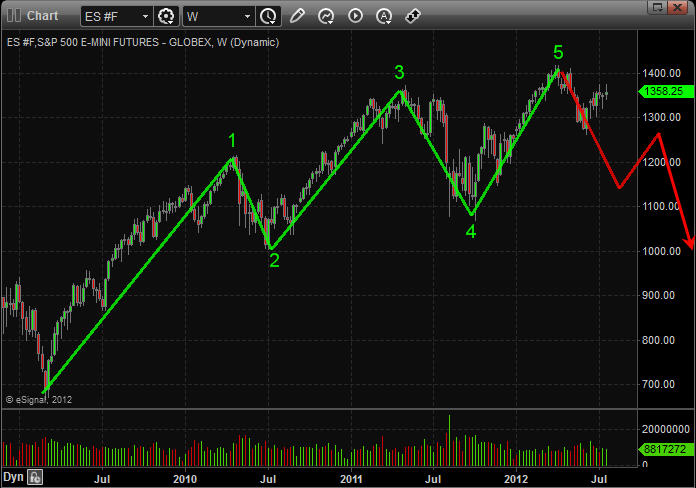
SP500 BIG PICTURE Wave Count

A look at the longer term view once again using the weekly chart, again supports our argument for a major correction. We have just completed a 5 wave pattern since the 2009 lows, and it is looking more like a big pull back is due. Remember most major trends end after the fifth wave.


Copper Weekly Chart Patterns

If we take a look at the copper ETF, “JJC”, we are provided with further justification. Copper is often referred to as “Dr.Copper” due to its industrial application and is known to be a leading indicator for equity markets. Copper has significantly underperformed equity markets and is likely leading the next move down. A look at the weekly chart which points to a rather dismal outlook. There is a major head and shoulder patterns developing.


Major Market Pattern Analysis Conclusion:

Last summer turned into a bloodbath with nothing but red candlesticks taking stocks and commodities sharply lower. If you haven’t already, it’s time to lock in some profits. Short, intermediate, and long term cycles are pointing down, and the increasingly bearish technical developments cannot be ignored. We’ll be looking at entering multiple shorts potentially in the very near future once/if setups present themselves.

 Buckle up and stay tune for more....


Stay in the loop by joining my free weekly newsletter
& videos to stay ahead of the crowd. 

Click here to visit The Gold & Oil Guy.com


Get our Free Trading Videos, Lessons and eBook today!

Tuesday, October 18, 2011

The SP 500, Apple Earnings and Feeding The A.D.D. Monster


The last hour of trading was intense on Tuesday and then all eyes were focused on Apple’s earnings which were released around 4:30 ET. The initial reaction to the earnings release is negative although as I write this AAPL is bouncing sharply higher in after market trading on strong volume.

To put the final hour’s volatility into perspective, at 3 P.M. Eastern Time the S&P 500 Index was trading at 1,217. A mere 12 minutes later the S&P 500 Index pushed 15 handles higher to trade up to 1,232. Then sellers stepped in and pushed the S&P 500 lower by nearly 12 handles in the following 20 minutes.

The price action was like a roller coaster and I was sitting watching the flickering red and green bars in real time with the anticipation of a child. It was the most excitement I have had in quite some time, but please don’t hold that against me. I don’t know whether reading my previous line makes me laugh or cry, but the truth must be heard I suppose.

Enough self deprecation, I want to get down to business with some charts and what is likely to happen in coming sessions. The sell the news event in AAPL has the potential to really change the price action tomorrow. If prices hold at lower levels, the indices could roll over sharply tomorrow. The S&P 500 E-Mini futures contracts are showing signs of significant weakness after the earnings miss by Apple in aftermarket trading.

Some other potentially game changing news items came out of Europe where Reuters reported earlier today that the Eurozone will likely pass legislation that will ban naked CDS ownership on sovereign debt instruments. Additionally, Treasury Secretary Timothy Geithner stated this morning that a forthcoming FHA announcement involving a new housing refinance plan was going to be made public in coming days. The statement regarding the new FHA plan helped the banks and homebuilders show relative strength during intraday trading and likely were behind much of the intraday rally.

I would point out that the S&P 500 Index (SPX) broke out slightly above the August 31 highs before rolling over. The reason that is critical is because the S&P 500 E-Mini futures did not achieve a breakout, but tested to the penny the August 31st highs. I am going to be totally focused on tomorrow’s close as I believe it will leave behind clues about the future price action in the S&P 500 leading up to option expiration where volatility is generally exacerbated. The daily chart of the S&P 500 Index is shown below:


If Wednesday’s close is below the recent highs near 1,230 we could see this correction intensify. The price action on Tuesday helped stop out the bears and if we see a significant reversal tomorrow the intraday rally today will have been nothing more than a bull trap. The price action Tuesday & Wednesday could lead to the perfect storm for market participants where bears were stopped out and bulls are trapped on the potential reversal.

Another interesting pattern worth discussing is the head and shoulders pattern seen on the SPY hourly chart. The strong rally to the upside may have indeed negated the pattern, but if prices don’t follow through to the upside in the near term and the neckline of this pattern is broken to the downside we could see serious downside follow through. The hourly chart of the Spider SPY Trading ETF is shown below:


Ultimately there are two probably scenarios which have different implications going forward. The short-term bullish scenario would likely see prices breakout over recent highs and push higher toward the key resistance area around the 1,260 price level. The 1,260 price level corresponds with the neckline that was broken back in August that led to heavy selling pressure.

Bullish Scenario
If we do breakout to the upside, the longer term ramification may wind up being quite bearish as most indicators would be screaming that price action was massively overbought at those levels and a sharp selloff could transpire into year end. The daily chart of the S&P 500 Index illustrates the bullish scenario below:


Bearish Scenario
The short term bearish scenario would likely involve a break below Monday’s lows that would work down to around the 1,140 level or possibly even lower. If a breakdown took place, a higher low could possibly be carved out on the daily chart which could lead to a multi month rally that would likely see the neckline mentioned above tested around the holiday season. The daily chart of the S&P 500 below shows the bearish scenario:


There are a variety of reasons why either scenario could unfold. Most of the analysis that I look at argues that the bearish scenario is more probable. However, based on what happened in the final hour of trading on Tuesday and the surprise earnings miss from Apple anything could happen.

I will likely wait for a confirmed breakout either to the upside above recent highs or to the downside below the neckline of the head and shoulders pattern illustrated above before accepting any risk. I am of the opinion that risk is exceptionally high in the near term. I am not going to try to be a hero, instead I am just going to wait patiently for a high probability setup to unfold.

Until a convincing breakout in either direction is confirmed, I am going to sit on the sidelines. I am quite content just watching the short-term price action without taking on any new risk. For those that want to be heroes or feel they have to trade, I would trade small and use relatively tight stops to define risk. Risk is excessively high!

Subscribers of OTS have pocketed more than 150% return in the past two months. If you’d like to stay ahead of the market using My Low Risk Option Strategies and Trades check out OTS at Options Trading Signals.Com and take advantage of our free occasional trade ideas or a 66% coupon to sign up for daily market analysis, videos and Option Trades each week.

JW Jones

Get J.W.s Latest Options Trading Signals Articles

Tuesday, January 25, 2011

Warning To Options Traders Looking at Netflix Earnings

One of the hardest things for me to remember is not to believe everything I see. I am a sucker for the latest “can’t lose” strategy supported by the experts. This morning I ran across a trade that looked too good to be true. I think it is, but I think it is instructive to walk through the potential hidden land mine. The event is the Wednesday afternoon release of NFLX earnings but there is a hidden trap for option traders using one commonly used earnings play structure.

The construction of the play is that of a “double calendar” spread. The underlying profit engine is an attempt to exploit the routinely seen spike in implied volatility (IV) of the options series most closely following earnings release. In this case, NFLX has weekly options which expire 48 hours after the scheduled announcement.

In order to understand the situation, let’s walk through the components. Just Click Here for the step-by-step analysis and expected price range.


Check Out Our Free Weekly Low Risk Stock Picks


Share