Showing posts with label newsletter. Show all posts

Monday, April 13, 2020

We Adjusted Our Retirement Account Positions with This Major Signal Issued - Did You Get The Signal?

Our trading partner Chris Vermeulen, who are readers have followed for a while now, is loving what is happening in the markets for the last three weeks. He wants a big bounce here because it is going to set us up with a huge long-term investment position once price confirms this next entry signal.

Last week Chris issued a trade alert to members of his long-term investing newsletter. This allows you to protect your wealth and assets while continuing to take advantage of opportunities generated by the U.S and global markets over the next several months and possibly into next year. This is the first trade alert issued in 2020 of this kind, and he may have another very soon, but it's not too late to take advantage of the first signal.

If you are a trader or investor, with a retirement account of any type, or have assets in the stock market, then you need to take action and sign up to get these important investment trade signals.

We all have trading accounts, and while our trading accounts are important, what is even more important are our long-term investment and retirement accounts. Why? Because they are, in most cases, our largest store of wealth other than our homes.

If they are not protected during a time like this, you could lose another 25-50% or more of your entire net worth. The good news is we can preserve and even grow out long term capital when things get ugly like they are now and Chris shows us how.

Check It Out Here

Sincerely,

Chris Vermeulen
Founder of The Technical Traders


Stock & ETF Trading Signals

Monday, August 26, 2019

Precious Metals ADL Predictions Getting Ready for a Big Move

This weekend we thought we would share some really important data and charts with all of you precious metals bugs/traders (like us). You probably remember our October 5th, 2018 call in Gold that has set off an incredible series of events for all of us.

We made a prediction that day that Gold would rotate higher from the $1200 level targeting the $1300 level, then stall and move lower to set up a “momentum base” near April 21st to 24th before accelerating much higher after June/July 2019. Our original research chart is shown below. But first, be sure to opt-in to our free market forecast newsletter

This incredible research targeted the $1600+ level by September/November 2019. We are only about $70 away from that level right now and we have new ADL research to share with all of our followers.


If you are a fan of our research or you can understand the value of the ADL predictive modeling system and what we have highlighted for our followers – you already know that any future ADL predictions for precious metals should be of particular interest to all of you. What are metals going to do over the next few months and how can you prepare for this move, let us help you try to prepare for this next move.

Check out these exciting charts full of opportunities that we will be sharing.

This Gold Monthly chat highlighting the ADL predictive modeling system results shows why gold traders need to be patient and wait for the next setup. That setup exists over the next 30 days as the ADL predictive modeling system is suggesting that Gold will attempt a downside price rotation to levels near $1490 before attempting another rally back above $1600. This is the next proper price rotation setup that traders need to look for. The second setup occurs in Jan/Feb 2020 where the price is expected to rotate from above $1600 to levels near $1540 before launching into another big rally to levels above $1870.

The Adaptive Dynamic Learning (ADL) predictive modeling system is one of the most incredible price modeling tools we use in our research. We’ve just shown you what our research tools believe Gold will do over the next 14+ months. We believe we are helping more traders and investors by proving our incredible research tools work better than any other technology solutions available in the market right now and are proving it by posting these types of charts many months before price can attempt to prove or disprove our research.


Now, one of the biggest moves is going to be in Silver and we’ve all been waiting for the incredible reversion of the Gold/Silver ratio. It is at that point when Silver begins to rally faster than Gold is rallying that we will see a true reversion in the Gold/Silver ratio. That event will result in an incredible rally in silver that could push the price of silver above $35 to $40 per ounce – or higher.

Our ADL predictive modeling system running on a Quarterly Silver chart highlights the opportunity that still exists for metals traders. Silver will continue to rally as Gold rolls higher. Silver will continue to rally to levels just below $20 over the next 8+months. The big breakout to the upside starts to take place Q3 2020. That move will push Silver prices to levels above $20 where a brief rotation will take place. By Q1 2021, the price of silver will be rallying extensively and the cat will be out of the bag in terms of what or why the metals are skyrocketing.
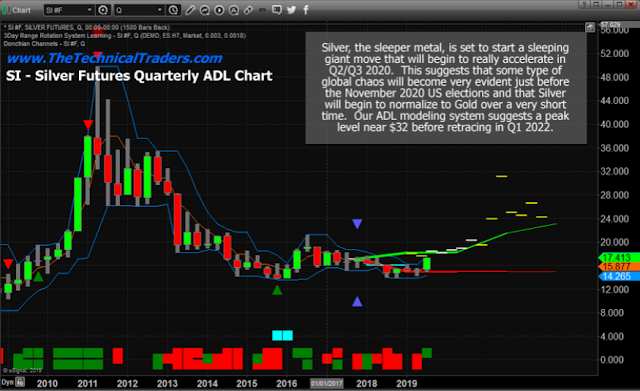

These moves in precious metals are going to be one of the most incredible opportunities for investors. There will be other swings in market sectors and major global market indexes as well. This is the time for all traders/investors to take advantage of the resources that are available to learn to take advantage of these setups. Our research team continues to deliver some of the most incredible research and predictive modeling results anyone has ever seen. If you can not see the value of being able to see 14 to 24 months into the future.

We urge you to consider finding resources and a team of researchers that can assist you over the next 12+ months as the moves in the global markets are going to be incredibly large and varied. Now is the time to take advantage of these opportunities and to find the right partners to assist you in finding the right trades.


Crucial Warning Signs About Gold, Silver, Miners and SP500

In early June I posted a detailed video explaining in showing the bottoming formation and gold and where to spot the breakout level, I also talked about crude oil reaching it upside target after a double bottom, and I called short term top in the SP 500 index. This was one of my premarket videos for members it gives you a good taste of what you can expect each and every morning before the Opening Bell. Watch Video Here.

I then posted a detailed report talking about where the next bull and bear markets are and how to identify them. This report focused mainly on the SP 500 index and the gold miners index. My charts compared the 2008 market top and bear market along with the 2019 market prices today. See Comparison Charts Here.

On June 26th I posted that silver was likely to pause for a week or two before it took another run up on June 26. This played out perfectly as well and silver is now head up to our first key price target of $17. See Silver Price Cycle and Analysis.

More recently on July 16th, I warned that the next financial crisis (bear market) was scary close, possibly just a couple weeks away. The charts I posted will make you really start to worry. See Scary Bear Market Setup Charts.

Concluding Thoughts

In short, you should be starting to get a feel of where commodities and asset class is headed for the next 8+ months. The next step is knowing when and what to buy and sell as these turning points take place, and this is the hard part. If you want someone to guide you through the next 12 - 24 months complete with detailed market analysis and trade alerts (entry, targets and exit price levels) join my ETF Trading Newsletter.

Be prepared for these incredible price swings before they happen and learn how you can identify and trade these fantastic trading opportunities in 2019, 2020, and beyond with our Wealth Building & Global Financial Reset Newsletter. You won’t want to miss this big move, folks. As you can see from our research, everything has been setting up for this move for many months.

Join me with a 1 or 2 year subscription to lock in the lowest rate possible and ride my coattails as I navigate these financial market and build wealth while others lose nearly everything they own during the next financial crisis.

As a technical analysis and trader since 1997, I have been through a few bull/bear market cycles. I believe I have a good pulse on the market and timing key turning points for both short term swing trading and long term investment capital. The opportunities starting to present themselves will be life changing if handled properly.

Free Gold or Silver with Membership!


Kill two birds with one stone and subscribe for two years to get your FREE PRECIOUS METAL and get enough trades to profit through the next metals bull market and financial crisis!

Chris Vermeulen
The Technical Traders



Stock & ETF Trading Signals

Thursday, March 8, 2018

Here's Why it Might Be Time to Take Natural Gas Seriously

Last week we identified a prime chart pattern in natural gas that matched our technical analysis and cycle price prediction system. This type of setup is our favorite as it leads to quick juicy profits and the last setup we had like this in natural gas I think we pocketed 74% return in 12 days using the ETF UGAZ.

Charts speak for themselves so let me show you what myself and our subscribers are into right now. We are long UGAZ and today (Wed March 7th) we locked in 9.1% profit with UGAZ on half the position. Our stops are now at break even, and we are looking for the final blast off stage, which may or may not happen, but we are ready!


We share this analysis so that you have some real predictive data to work with through March. We are not always 100% accurate in our modeling systems predictions or accuracy, but you can spend a little time reading our research reports through most of this year to see how we’ve been calling these market moves since well before the start of 2018. Visit the Technical Traders here to see what we offer our subscribers and learn how we can assist you in finding great trading opportunities. In fact, pay attention to the market moves as they play out over the next few weeks to see how accurate our research really is. We’re confident you will quickly understand that we provide the best predictive analysis you can find and are proud to offer our clients this type of research.

Get ready for this move and don’t miss the future ones. We’ll keep our members aware of all of these moves going forward so they can take advantage of these opportunities to generate profits.

Hope to see you in our member’s area, as well, where we can share more data and research to help you profit from these moves – visit The Technical Traders Right Here to learn more.


Stock & ETF Trading Signals

Saturday, August 13, 2016

Why Corporate America Can’t Prop Up Stocks Much Longer

By Justin Spittler

Corporate America is bracing for tough times. Since you’re reading an investment newsletter, you likely own stocks. And if you’re like most investors, you keep up with how the companies you own are performing. You might even listen to quarterly “earnings calls,” which are when CEOs present results and give their outlook on the business.

Most of the time, CEOs act as cheerleaders on these calls. If business is bad, they’ll say business is good. If business is good, they’ll say it’s great. And CEOs are notoriously optimistic about the economy. After all, thousands of investors and analysts listen to these calls. CEOs know their stock can crash if they’re pessimistic about the business or economy. Because many CEOs will say anything to make their stock go up, we don’t put much stock in their words. We pay much more attention to their actions. And right now, large U.S. companies are acting like very tough economic times are ahead.

Business investment fell 2.2% last quarter..…
This metric measures how much companies spend on property, plant, and equipment. It was the third straight quarter that business investment fell. That hasn’t happened since the 2008-2009 financial crisis. We wouldn’t see this if the economy was headed in the right direction. Companies would be building more factories. They’d be buying more machinery. They’d be spending more money on research and development.

Instead, companies have cut back on investments. This tell us they don’t see many good opportunities. That’s a bad sign for the economy, yet stocks keep rallying. The S&P 500, Dow, and NASDAQ have all recently hit new record highs. At this point, you’re probably wondering what’s keeping stocks afloat if it’s not the economy.

Companies have spent about $2.5 trillion on “share buybacks” since the financial crisis..…
A buyback is when a company buys its own stock from shareholders. This can lift a company's stock price.
According to investment bank Goldman Sachs (GS), buybacks have been the biggest driver of U.S. stock performance since the financial crisis. Buybacks also reduce the number of shares that trade on the market.

This boosts a company’s earnings per share. But buybacks don’t make a company more profitable. They only make profits look bigger “on paper.” Companies have been buying up their own stock for two reasons: 1) They don’t see many growth opportunities. And 2) it’s incredibly cheap to borrow money.

The Federal Reserve has held its key interest rate near zero since 2008..…
The Fed cut rates to encourage households and businesses to borrow and spend more money. Mainstream economists thought this would “stimulate” the economy. It didn’t work. The U.S. economy has grown at an annualized rate of just 2.1% since 2009. This makes the current “recovery” the slowest by far since World War II.

The Fed did get folks to borrow huge sums of money. U.S. corporations have borrowed more than $10 billion in the bond market since 2007. Last year, they issued a record $1.5 trillion in bonds.
Buybacks are a big reason companies borrowed so much. MarketWatch reported last week:
Companies have been taking on piles of debt to finance buybacks, leading the total debt on the S&P 500 to grow 56% during the past five years.
According to Yahoo! Finance, companies in the S&P 500 funded 22% of last year’s buybacks with debt. This year, debt paid for 39% of share buybacks.

Corporate debt is now dangerously high..… 
According to Barron’s, corporate debt now equals 45.3% of gross domestic product (GDP). The only time this key ratio has ever been higher was in 2009, when it hit 45.4%. If the economy was doing well, this wouldn’t be such a big problem. Companies would be making enough money to pay their debts.

But right now, Corporate America is struggling to make money. Profits for companies in the S&P 500 are on track to fall for the fifth straight quarter. That hasn’t happened since the 2008-2009 financial crisis.
There’s no telling when this earnings drought will end either. According to research firm FactSet, analysts expect third quarter corporate profits to fall 1.7%. The third quarter ends on September 30.

Keep in mind, the U.S. economy is technically in a “recovery” right now. Imagine what will happen to corporate profits during the next recession. The more profits fall, the less money companies will have to prop up their shares with buybacks.
  
Companies have already started to cut back on buybacks..…
According to Business Insider, buybacks fell 18% last quarter. This sharp decline in buyback activity followed a near record breaking first quarter, in which companies in the S&P 500 spent an incredible $166 billion on buybacks. That’s the second most ever, and the most in one quarter since 2007. We don’t know exactly why companies are suddenly spending less on buybacks.

Maybe it’s because corporate profits are drying up. Maybe companies are starting to realize they have too much debt. Or maybe it’s because stocks are expensive. According to the popular CAPE ratio, stocks in the S&P 500 are 62% more expensive than their historic average. Since 1881, U.S. stocks have only been more expensive three times: before the Great Depression, during the dot-com bubble, and leading up to the 2008-2009 financial crisis.

Like any investment, buybacks only make sense when stocks are a good deal. With stocks as expensive as they are today, buybacks are a terrible use of money.

Without buybacks, there won’t be much to keep U.S. stocks from falling..…
If you own stocks, take a good look at your portfolio. We recommend that you get out of any company that needs buybacks to retain shareholders. We also encourage you to put 10% to 15% of your wealth in gold. As we often say, gold is real money. It’s preserved wealth for centuries because gold is unlike any other asset. It’s durable, easy to transport, and easily divisible.

Gold is also the ultimate safe haven asset. It’s survived economic depressions, stock market crashes, and full blown currency crises. When investors are nervous about stocks or the economy, they buy gold.
The price of gold has jumped 27% this year. It’s beat the S&P 500 4-to-1.

If you don’t already own gold for protection, we encourage you to do so immediately..…
According to Casey Research founder Doug Casey, the financial system is held together by “chewing gum and bailing wire” right now. When the public wakes up and realizes this, “they’ll flock to gold… just as they’ve done for centuries.” Doug thinks this could cause the price of gold to easily soar 200% in the coming years.

You could make 2x, 5x, or 10x that much money in gold stocks..…
Yesterday, we showed you how leverage works in the resource market. As we explained, this powerful force is why gold stocks can soar even if the price of gold doesn’t rise by that much. This year, gold’s 27% jump caused the VanEck Vectors Gold Miners ETF (GDX), which tracks large gold miners, to soar 128%.

Some folks might see that and think they missed their chance to buy gold stocks. But regular readers know gold stocks can go many times higher. During the 2000-2003 bull market, the average gold stock rose 602%. The best ones returned more than 1,000%. We expect even bigger gains in the coming years. To learn why, watch this short presentation. In it, Doug explains why we’re headed for “the biggest gold mania” he’s even seen.

By the end of this video, you’ll know why there’s never been a better time to own gold stocks. You’ll also learn how to make the most of this new gold bull market. We’re talking gains of 1,000%...2,000%...even 5,000%. Those kind of returns might sound impossible. But as you’ll see, Doug's hit many “home runs” like this throughout his career. And for the first time ever, he's showing the world exactly how he did this.

To learn Doug’s SECRET to making giant gains in gold stocks, watch this free video.

How Will Negative Interest Rates, the War on Cash, and “Helicopter Money” Affect the Markets?

Today, we have something special to share with you. Instead of the usual “Chart of the Day,” you’ll find a six-minute video presentation put together by our colleagues at Palm Beach Research Group.

In the video below, Palm Beach Research Group co-founder Tom Dyson and Palm Beach Letter editor Teeka Tiwari discuss how radical government policies are affecting global financial markets. As Tom and Teeka explain, these central bank “experiments” will have severe side effects. They could even push the price of gold to $5,000. To learn why, watch the video below.


If you like what you saw from Tom and Teeka, we encourage you to sign up for their “speed round” training series. Click here to get started.


Get out latest FREE eBooK "Understanding Options"....Just Click Here

Stock & ETF Trading Signals

Wednesday, July 2, 2014

5 Simple Rules to Evolve Past the Hot Stock List

By Andrey Dashkov

If you’re a typical small time investor, chances are you prefer to let a team of analysts fuss about such irksome things as correlation and beta. Maybe you’ve bought a stock because your brother in law gave you a hot tip, maybe you heard something about it on a financial news show, or maybe you just loved the company’s product.


Friends often ask me for “hot stock tips”—which is like walking up to someone at the craps table and asking what number to bet on. An accomplished craps player will have position limits, stop losses, income targets, and an overall strategy that does not hinge on one roll of the dice. You need an overall strategy long before you put money down.

So, what do I tell those friends asking for hot stock tips? Well, that they can retire rich with a 50-20-30 portfolio:
  • Stocks. 50% in solid, diversified stocks providing healthy dividends and appreciation.
  • High Yield. 20% in high yield, dividend paying investments coupled with appropriate safety measures. These holdings are bought for yield; any appreciation is a nice bonus.
  • Stable Income. 30% in conservative, stable income vehicles.
Unless you’re starting entirely from scratch, you should review your current portfolio allocations, identify where you’re over or underallocated, and then look for investments to fill those holes. In our portfolio here at Miller's Money Forever, we separate our recommendations into StocksHigh Yield, and Stable Income to help you do just that.

The Art of the Pick


By the time an investment lands in our portfolio, we’ve already run it through our Five Point Balancing Test. When your boasting brother in law tempts you with a “can’t-miss opportunity” or some pundit touts a hot tech company on television, you can come back to these five points, again and again.
  1. Is it a solid company or investment vehicle? Investing your retirement money safely is a must. How do you know if a company is solid? Take the time to validate essential company information, particularly when the recommendation comes from a source with questionable motivation.
  2. Does it provide good income? A good stock combines a robust dividend and appreciation potential.
  3. Is there a good chance for appreciation? There are two types of appreciating stocks: those that rise because of general market conditions and those that rise further because of the way management runs the business. We want both.
  4. Does it protect against inflation? High inflation is one of the biggest enemies of a retirement portfolio.
  5. Is it easily reversible? Ask yourself, “Can I quickly and easily reverse this investment if something unexpected occurs?” The ability to liquidate inexpensively is critical to correcting errors.

Marking the Bull’s Eye So You Can Hit It


It’s worthwhile to write down your goal—including an income target and the price at which you’ll sell if things head south—with every investment. After all, if you can’t see the bull’s eye, how will you know if you’ve hit it? Buying any investment because a trusted adviser, newsletter, or pundit recommended it is not a good enough reason. Buying because your portfolio has a hole, you understand the company, the investment vehicle, the risks, and the potential is.

Remember, retiring rich means having enough money to enjoy your lifestyle without money worries. Do your homework on every investment and you’ll make that pleasant thought your life’s reality. Every week, the Miller’s Money team provides no nonsense, practical advice about the best ways to invest for your retirement in  Miller’s Money Weekly Sign up here to receive it every Thursday.

The article 5 Simple Rules to Evolve Past the Hot-Stock List was originally published at Millers Money


Check out our "Beginner's Guide to Trading Options"....Just Click Here!


-->

Saturday, April 19, 2014

How to Momentum Trade Gold & Silver Stocks

Back on April 9th I posted a short tutorial on how to momentum trade gold along with my short term gold forecast.

Today I wanted to do a follow up video for my gold market traders for three reasons:


1. I had lots of great feedback from traders taking advantage of what I showed to profit in the past week.
2. To show you how and why this strategy works better with gold stocks and silver stocks.
3. To provide my short term gold forecast so you are on the right side of the market for next week.
4. Also you should see my major long term Gold Forecast


Get my gold forecast and gold trade alerts at The Gold & Oil Guy


See you in the markets!
Chris Vermeulen


Sign up for one of our Free Trading Webinars....Just Click Here!


Saturday, March 29, 2014

Why Gold Is Falling and a Gold Forecast You May Not Like

The bitter truth about what may happen to gold is not all that exciting and likely don’t want to know, but you need to understand what is unfolding as we speak…..

Long story short, the prices of bonds look as though they are about to rally once again. Mounting fears of a stock market correction has money flowing into bonds which in turn will drive interest yields lower yet gain.

But the BIG PICTURE of what he FED said the other week about how they plan to raise rates in 2015 and cut QE down to $55 billion per month hurts the long term outlook for gold.

This news may not sound that important, it actually is and undermines the price of miners, silver and gold in a big way. Find out why gold is falling and the threat that could trigger a much larger meltdown in the long run with my gold forecast video.


Chris Vermeulen
Subscribe to my > ETF Trading Newsletter


Sign up for one of our Free Trading Webinars....Just Click Here!


Sunday, May 5, 2013

Stocks Preparing for Pullback, Buy Bad News, Sell the Good

The SP500 remains in a strong uptrend, but the index has posted a sizable gains for 2013 thus far so it’s only logical that a pullback within this bull market takes place sooner than later.

With May now upon us and historically prices fall more times than not we feel a 3-4 weeks correction is on the verge of starting. This Friday we just had very strong economic numbers confirming the economy is recovering. This news has sent stocks sharply higher as shorts cover their positions and investors who are not yet long get into position to profit from higher prices. But the herd psychology and their trades are typically incorrect as they invest based on fear and greed. The old saying is buy on negative news and sell on positive news will typically get you on the correct side of the market more times than not if used with price, volume and cycles.

The Technical Traders – SP500 Index Weekly Chart

If we look at the price of the SP500 we need it to breakdown below the recent pivot low before we become bearish. Volume which is not shown on this chart is below average as price moves higher and this is a bearish sign also.

Looking at a basic cycle using the stochastics indicator we can see that the current cycle is starting to turn down. Cycles tend to lead price during an uptrend so we could still have stocks move higher for another week or so but be aware that when price starts to drop its likely a market top. But until then you must respect the uptrend. Stocks can remain overbought and toppy looking for months… so done be gambling and trying to pick a top until we see breakdown start.

spy2

SP500 Stocks Trading Above 200 Moving Average – The Technical Traders View

Stocks trading above the 200 day moving average is a great indicator for helping spot broad market underlying strength/weakness. It does lag the market but is still very powerful. The chart below shows this info and my thinking of what is likely to unfold sooner than later though price may still rise for several days yet.

We also use a similar chart for timing swing trades and market tops which are based on stocks trading above the 20 day moving average. This chart is not shown here but is now trading at a level which generally triggers selling/market top.

spy1

Stock Market and SP500 Trading and Investing Conclusion:

In short, we are still bullish on the market as we focus on trading with the trend. We do not pick market tops and we do not pick market bottoms. Knowing that stocks make their biggest moves at the end of their uptrend and at the end of a down trend it’s only common sense that risk is extremely high if you are betting against the current trend.

The best thing to do is wait for a technical breakdown and reversal which puts the odds more in your favor with much less risk and typically a clear line in the sand to exit the position if you are incorrect.

The last major stock market top which formed in September of last year had a series of strong news and strong price action persuading the herd to buy stocks. Instead it was the last impulse wave up just before a strong correction took place. That is much like what we see now with the economic news.

Join our free newsletter and stay on right side of the market while reducing your trading/investing stress. My simple yet effective analysis walks you through the market each week without bias. Remember Price and Volume is what makes you money trading NOT news or forecasts.

Join our FREE Newsletter Today!


Check out our current specials for full subscription members.

Sunday, March 4, 2012

Volatility Bounces Bottom Awaiting Bad News or Selling to Strike!

Over the past 5 months we have seen volatility steadily decline as stocks and commodities rise in value. The 65% drop in the volatility index is now trading at a level which has triggered many selloffs in the stock market over the years as investors become more and more comfortable and greedy with rising stock prices.

Looking at the market from a HERD mentality and seeing everyone run to buy more stocks for their portfolio has me on edge. We could see a strong wave of fear/selling hit the S&P 500 Index over the next two weeks catching the masses with their hand in the cookie jar ........ again.

If you don’t know what the volatility index (VIX) is, then think of it as the fear index. It tells us how fearful/uncertain investors are or how complacent they are with rising stock prices. Additionally a rising VIX also demonstrates how certain the herd is that higher prices should continue.

The chart below shows this fear index on top with the SP500 index below and the correlation between the two underlying assets. Just remember the phrase “When the VIX is low it’s time to GO, When the VIX is high it’s time to BUY”.

Additionally the Volatility Index prices in fear for the next 30 days so do not be looking at this for big picture analysis. Fear happens very quickly and turns on a dime so it should only be used for short term trading, generally 3-15 days.

Volatility Index and SP500 Correlation & Forecast Daily Chart:
VIX Volatility Index Trading

Global Issues Continue To Grow But What Will Spark Global Fear?
Everyone has to admit the stock market has been on fire since the October lows of last year with the S&P 500 Index trading up over 26%. It has been a great run, but is it about to end? Where should investors focus on putting their money? Dividend stocks, bonds, gold, or just sit in cash for the time being?

I may be able to help you figure that out.

Below is a chart of the Volatility index and the gold exchange traded fund which tracks the price of gold bullion. Notice how when fear is just starting to ramp up gold tends to be a neutral or a little weak but not long after investors start selling their shares of securities we see money flow into the shiny yellow safe haven.

Gold & Fear Go Hand In Hand: Daily Chart
Looking at the relationship between investor fear/uncertainty and gold you will notice scared money has a tendency to move out of stocks and into safe havens.

Gold Trading Newsletter
Trading Conclusion Looking Forward 3 months…

In short, I feel the financial markets overall (stocks, commodities, and currencies) are going to start seeing a rise in volatility meaning larger daily swings which inherently increased overall downside risk to portfolios and all open positions.

To give you a really basic example of how risk increases, look at the daily potential risk the SP500 can have during different VIX price levels:

Volatility index under 20.00 Low Risk: Expect up to 1% price gaps at 9:30am ET, and up to 5% corrections from a previous high.

Volatility index between 20 – 30 Medium Risk: Expect up to 2% price gaps at 9:30am ET, and up to 15% corrections from recent market tops or bottoms.

Volatility index over 30 High Risk: Expect 3+% price gaps at 9:30am ET, and possibly another 5-15% correction from the previous VIX reading at Medium Risk

Note on price gaps: If you don’t know what I am talking about a price gap is simply the difference between the previous day’s close at 4:00pm ET and the opening price at 9:30am ET.

To continue on my market outlook, I feel the stock market will trade sideways or possibly grind higher for the next 1-2 weeks, during this time volatility should trade flat or slightly higher because it is already trading at a historically low level. It is just a matter of time before some bad news hits the market or sellers start to apply pressure and either of these will send the fear index higher.

I hope you found this info useful and if you would like to get these reports free every week delivered to your inbox be sure to visit here to join my FREE NEWSLETTER!

Chris Vermeulen

