Showing posts with label euro. Show all posts

Wednesday, July 6, 2016

Warning: This Could Be the Start of a Global Banking Crisis

By Justin Spittler

Europe’s banking system is collapsing. Over the past year, shares of Deutsche Bank (DB), Germany’s biggest bank, have plunged 56%. Swiss banking giant Credit Suisse (CS) is down 62% over the same period. Yesterday, both stocks hit record lows.

Dozens of other European bank stocks have also crashed. The Euro STOXX Banks, which tracks 48 of Europe’s largest banks, is down 48% over the past year. This is a major issue. That's because banks are the cornerstone of the financial system. They keep money flowing through the economy. If they’re struggling, it often means the economy is having major problems. Right now, European banks are flashing bright warning signs. That’s not just bad news for Europe—it’s also a serious threat to the rest of the world.

In today’s Dispatch, we’ll show you why Europe’s banking crisis could turn into a global banking crisis. You’ll also learn how to transform this threat into a chance to make big gains.

European banks are struggling to make money..…
Spanish banking giant BBVA’s (BBVA) profits fell 54% last quarter. First quarter profits at Deutsche Bank were down 58%. Swiss bank UBS’s (UBS) profits plunged 64%. European banks are hurting for a couple reasons. One, Europe is growing at the slowest pace in decades. Banks are making fewer loans as a result.

Two, negative interest rates are eating European banks alive. If you’ve been reading the Dispatch, you know negative rates are the latest radical government policy. They basically flip your bank account upside down. Instead of earning interest for keeping money in the bank, you pay the bank to hold your money.

Negative rates are clearly bad for savers. They’re also hurting Europe's biggest banks. That’s because these huge institutions have to pay their “bank,” the European Central Bank (ECB). Today, European banks pay £4 for every £1,000 they store at the ECB for a year. That might not sound like a lot. But it adds up quick when you manage trillions of euros like these banks do.

Last week, investors got another reason to avoid European banks..…
On Thursday, Great Britain voted to leave the European Union (EU), which it’s been in since 1973.
The “Brexit,” as the media is calling it, blindsided investors. As we explained yesterday, the market was expecting Great Britain to stay in EU. The unexpected outcome triggered a global stock market crash.

U.S. stocks had their worst day since August. Japanese stocks had their worst day in five years. European stocks had their biggest decline since the 2008 financial crisis. Friday’s global selloff erased $2.1 trillion in value from global stocks. It was the global stock market’s worst day in history. The panic didn’t die down much over the weekend. By the end of Monday, another $930 billion had disappeared from the global stock market.

European bank stocks were hit the hardest..…
Deutsche Bank plunged 22% between Friday and Monday. Credit Suisse fell 23%. UBS fell 20%. Barclays (BCS) and Royal Bank of Scotland (RBS) each plunged 37%. Both stocks are down more than 57% over the past year. These are gigantic moves in a matter of days. Remember, we’re not talking about small biotech stocks. These are some of the most important financial institutions on the planet.

Government officials are scrambling to contain the crisis..…
Today, the Bank of England (BoE) injected £3.1 billion into Britain’s banking system. It’s pledged to inject as much as £250 billion to stabilize its financial system. The BoE made its cash injection hours after the Bank of Japan (BOJ) pumped $1.5 billion into its banking system. As we'll show you in a second, we don't believe this will end well. That's because this excessive money printing (sometimes called "quantitative easing") doesn't stimulate the economy like governments intend it to.

Credit Suisse says other central banks could soon print more money too. Bloomberg Business reported on Friday:
“Market liquidity and overall liquidity in the U.K. is drying up as we speak in a very rapid way,” said John Woods, chief investment officer for Asia-Pacific at Credit Suisse Private Banking, told Bloomberg TV in Hong Kong. “It’s highly likely that we see monetary easing in a coordinated response” from central banks across the world, he said.
Great Britain is headed for a recession..…
A recession is when an economy shrinks two quarters in a row. Goldman Sachs (GS) says Britain could be in a recession by early 2017. But here’s the thing. We don’t think the BoE will let this happen. That’s because central bankers will do anything, including using reckless, unproven monetary policies, to avoid a recession these days.

Credit rating agency Standard & Poor’s agrees with us. Reuters reported today:
"Brexit is likely to represent a drag of about 1.2 percent of GDP for the UK in 2017," Jean-Michel Six, S&P's chief economist for Europe, the Middle East and Africa told a conference call for investors on Tuesday. "We have a significant slowdown but growth remains positive although obviously in a much more disappointing way. That is because we anticipate a very strong monetary response on the part of the Bank of England, in the form of additional quantitative easing, in the form of a further cut in interest rates," he added.
Bank of America (BAC) and Deutsche Bank also expect the BoE to fire up the printing press again. Bank of America says it could happen as soon as August.

QE won’t help Great Britain’s economy..…
As we told you above, QE doesn’t work. As regular readers know, the Federal Reserve pumped $3.5 trillion into the U.S financial system after the 2008 financial crisis. This massive money printing effort was supposed to juice the economy. But the U.S. is growing at its slowest pace since World War II. QE also failed to jumpstart Japan’s economy, which hasn’t grown in two decades. There’s no reason to think it will work this time.

If you’re nervous about the global financial system, we encourage you to take action today.…
The first thing you should do is own physical gold. Gold is real money. It’s held its value for thousands of years because it has a unique set of attributes: It’s easy to transport, easily divisible, and durable. You can take a gold coin anywhere in the world and folks will immediately recognize its value.

Unlike paper money, central bankers cannot create gold from nothing. It’s the ultimate antidote to crumbling paper currencies. That’s why the price of gold often soars when governments print money. This year, gold is up 24%. It’s trading at the highest price in two years. But it could go much higher as governments continue to run reckless monetary experiments.

If you want big profits from rising gold prices, own gold stocks..…
Dispatch readers know gold miners are leveraged to the price of gold. A small jump in the price of gold can cause gold stocks to surge. Gold’s 24% jump this year has caused GDX, a fund that tracks large gold stocks, to soar 96%. We believe this gold stock rally is just getting started. During the 2000 and 2003 gold bull market, the average gold stock gained 602%. The best ones soared 1,000% or more.

Nick Giambruno, editor of Crisis Investing, has recommended two gold stocks this year..…
He already closed out one of them for a quick double. It surged 103% in 14 months. Nick’s other gold stock is up 30% since March and is still dirt cheap at today's levels. Nick currently rates this stock a "Buy"…and says it could soon start paying a double digit dividend yield if gold keeps rising.

You can learn more about Nick’s gold stock by taking advantage of our special 60%-off sale for Crisis Investing. If you sign up today, you’ll be enrolled in a trial membership, which gives you 90 days risk-free to decide if the service is for you. But we encourage you to act soon. This special offer ends soon, and we likely won’t open this offer again for a long time.

You can learn more about this incredible offer by watching this video presentation. You’ll also learn about an even bigger threat to your wealth than Europe’s banking crisis. As you’ll see, almost no one is talking about this coming crisis. Yet, it could cause millions of Americans to lose their entire life savings. By the end of this video, you’ll know how to protect yourself. And just as importantly, you’ll know how to profit from this coming crisis. Click here to watch this free video.

Chart of the Day

U.S. bank stocks are also headed lower. Today’s chart shows the performance of the Financial Select Sector SPDR ETF (XLF) over the past year. XLF holds 94 major U.S. financial companies including behemoths JPMorgan Chase (JPM), Wells Fargo (WFC), and Bank of America (BAC). You can see XLF is down 11% since last June. While that's not as severe as the near 50% drop in European banks over the same period, it's still a clear sign to stay away.

U.S. banks have many of the same problems as European banks. Like Europe, the U.S. economy is growing at the slowest pace in decades. And while the U.S. economy doesn’t have negative rates yet, Fed Chair Janet Yellen has said they aren’t “off the table” if the U.S. economy runs into trouble. The arrival of negative rates to the U.S. could tip bank stocks into a crisis, just like they have in Europe.


Get our latest FREE eBook "Understanding Options"....Just Click Here!

Stock & ETF Trading Signals

Friday, April 24, 2015

Here's Why Gold Will Be Priceless in Three to Five Years

Over the next few years as debt, currencies and countries start to fall apart and individuals will be looking to place their money where it will hold its value and buying power during times of extreme uncertainty.

If you eliminate fiat currencies which are created out of this air and are nothing more than a credit we are left with precious metals and stones. As much as we have evolved over time, we could be valuing things like gold, silver, platinum, and precious stones more so than our currency.

Let’s face it, currencies are swinging in value 20-50% regularly and while most people do not realize it their buying power often is not as strong as it was. Would you rather hold a large portion of your capital in say the EURO which is falling like a rock in value costing you thousands of dollars a month, or would gold and silver which rises in value as your currency falls be a smarter decision?

Click Here to Read Chris Vermeulen's entire article and charts


Get our latest FREE eBook "Understanding Options"....Just Click Here!

Sunday, November 23, 2014

Week Ending Crude Oil, Gold and Coffee Markets Summary for Friday November 21st

Our trading partner Mike Seery brings us his weekly call on crude oil, gold and coffee. Could crude oil really be headed lower? If king dollar gets it's way it just might be headed much lower. Here's what Mike has to say about this and other futures commodity trades.

Crude oil futures are up 30 cents in the January contract trading higher for the 2nd consecutive trading session as a short term bottom may have been placed as China cut their interest rate today sending crude oil sharply higher in early trade trading as high as 77.82 a barrel before retracing while currently trading at 76.22 if you are still short this market I would place my stop above the 10 day high which in Monday’s trade will come down to 77.92 risking around 170 points or $1,700 per contract. The U.S dollar was sharply higher and that’s generally very bearish the commodity markets, however with China cutting their interest rate that combated the negativity coming out of the Euro currency causing short covering across the board as many of the commodities including energies, metals, and the grain sector were all higher today but continue to place your stop loss at that level and see what Monday’s trade brings. The fundamentals in oil still remain very bearish as Saudi Arabia has not cut production & the United States continues its torrid pace of production flooding the world market so even if you are stopped out on this trade sit on the sidelines and wait for another trend to develop as I’m not totally convinced that lower prices aren’t ahead in 2015. Crude oil futures are still trading slightly below their 20 but still far below their 100 day moving average telling you the trend is still to the downside and if the U.S dollar continues to move higher that eventually will put pressure on prices once again in my opinion but on a day to day basis anything can occur.
TREND: LOWER
CHART STRUCTURE: EXCELLENT

Still a Few Seats Left for this Weeks Free Webinar "Why you Should Trade Options on ETFs"....Just Click Here

As I talked about in yesterday’s blog I am telling investors to remain neutral as I do believe gold prices will remain choppy to lower for the rest of 2014 as prices rallied $9 to trade around $1,200 per ounce as extreme volatility has entered this market and I think today’s price action was very impressive due to the fact that the U.S dollar was up over 50 points which is generally very bearish precious metals, however China cut their interest rate pushing many commodities prices higher. Gold futures are trading above their 20 but below their 100 day moving average moving higher despite the fact that the ECB looks like they’re going to utilize more stimulus which is remarkable in my opinion as I do think if the U.S dollar continues to move higher eventually that will be very bearish gold prices so sit on the sidelines as you do not want to trade a choppy market. This market is extremely volatile with big up price swings and down swings so avoid and move on to a trendy market like the S&P 500. Volatility in gold is amazing lately with many days of a $30 – $50 trading range which is incredible going into the holiday season, however if you remember last year gold’s low was near December 31st and we opened up the next day around $20 higher and I think the same thing will happen because of the fact that stock sales which are losers are sold to offset winning trades come the month of December so I still look for another leg down but still would sit on the sidelines at the current time. TREND: NEUTRAL
CHART STRUCTURE: POOR

In this free video John shares his favorite ETF trading strategies and talks about the upcoming price move in the dollar.......Just Click Here

Coffee futures in the March contract sold off around 600 for the trading week currently trading at 190.70 in New York with high volatility in the last week with several sharply higher and lower trading sessions as I am advising investors to stay away from this market as the trend is extremely choppy and difficult to trade successfully in my opinion. Coffee prices are trading right at their 20 & 100 day moving average telling you that the trend is neutral as this volatility will remain for months to come as weather in Brazil is very fickle on a week to week basis as drought concerns are still in the back of traders’ minds as the weather currently is positive for production. The chart structure in coffee presently is very poor as I like to trade markets with tight chart structure which allows you to place tighter stop losses lowering monetary risk in my opinion. TREND: MIXED
CHART STRUCTURE: POOR

Get our latest FREE eBook "Understanding Options"....Just Click Here!

Saturday, June 7, 2014

Are You Ready for Negative Interest Rate and Pay the Bank to Hold Your Money?

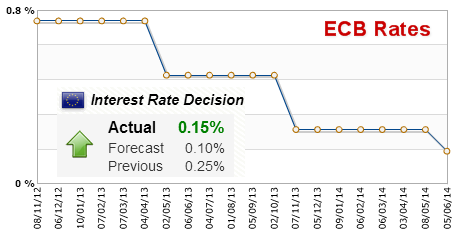
The six members of the European Central Bank (ECB) Executive Board and the 16 governors of the euro area central banks vote on where to set the rate. We watch interest rate changes closely as short term interest rates are the primary factor in currency valuation.
 

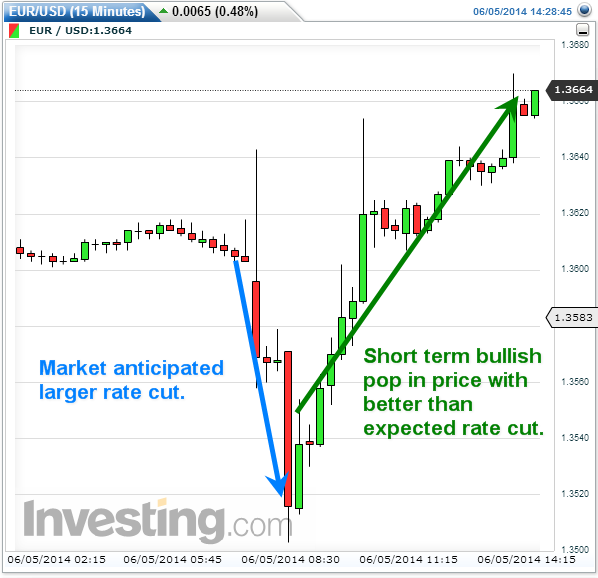
A higher than expected rate is positive for the EUR, while a lower than expected rate is negative for the EUR. Today (Thursday June 5th) we expected a rate cut. The cut was not as much as analysts expected which is bullish for the short term, but the rate is still declining and nearing zero, or even worse, negative territory.


ecbrates eurochart


A negative interest rate may sound crazy or impossible, but it's already happening in Denmark. Europe is already in a deflationary state and central banks are doing everything they can to bring about inflation by cutting rates and devaluing the euro. This will cause a ripple through multiple asset classes and will drastically alter the outcome of individuals worldwide. Just imagine if you had to pay a bank to hold your money and you do not earn any interest but rather pay interest.

People who have been saving their entire lives will get hit the hardest. Retired folks will stop earning money and start paying for all the money they hold held at banks. Individuals will go more into debt because money will be extremely cheap to borrow. Price of assets like equities, real estate, discretionary goods will rise because the cheap money everyone is borrowing will be used to buy more stuff. While all this happens everyone takes on more dept. It is a brutal spiral leading to increase debt levels, inflation and eventually bankruptcy.

If the euro dollar starts to decline at a quicker pace the U.S. dollar will likely rally. A strong dollar could affect the commodities market including gold, silver and the European stock markets. Todays rate cut led to a pop in the euro, but that is likely to be short lived. I hope this sheds some light on the markets and helps in your trading.

Chris Vermeulen

P.S. In the next few days members and myself will be looking to enter some trades based round this analysis. See Premium Trading Video & Newsletter

Sincerely,
Chris Vermeulen


Sign up for one of our Free Trading Webinars....Just Click Here!


Saturday, May 3, 2014

World Money Analyst: Europe....Cliff Ahead?

By Dirk Steinhoff
When Kevin Brekke, managing editor [of World Money Analyst], contacted me last week, I knew it was time again to survey the investment landscape. This month, I will focus on Europe and its decoupled financial and real economy markets.

Globally, the last two years were marked by booming stock exchanges of developed markets, disappointing bond markets, and devastation across the precious metals markets.

Since June 2012, the EURO STOXX 50 Index, Europe’s leading blue chip index for the Eurozone, has advanced by approximately 50% and outperformed even the S&P 500 and the MSCI World indices.


Over the last six months, European stock exchanges have seen a surprising change of leadership: The major stock market indices of the “weaker” countries, like Portugal, Spain, and Italy, have outperformed those considered stronger, like Germany. One of the top performers was a country that was and still remains in “bankruptcy” mode: Greece.


The question at this point is: Can these outstanding European stock market performances continue?

In our search for an answer, let’s start with a closer look at the economic conditions within the European Union (EU), where approximately 2/3 of total “exports” (internal and external) of the EU-28 are traded. And then let’s have a look at the economic setting of some major trading partners, such as the US and BRIC countries, which account for roughly 17% and 21%, respectively, of the external exports of the EU-28.
Although the EURO STOXX 50 Index has soared since June 2012, certain key measures of the underlying real economies paint a different picture.

To start, the GDP of the EU-28 is not really growing. In 2012, it contracted by 0.4% and grew by the smallest fraction of 0.1% in 2013. The GDP growth numbers for the countries in the euro area are even worse: -0.7% in 2012 and -0.4% in 2013. Whereas Germany’s GDP was up in 2013 by 0.5%, economic growth was down in Spain, Italy, and Greece by -1.2%, -1.8%, and -3.6%, respectively.

Real GDP Growth Rates 2002-2012
2002
2003
2004
2005
2006
2007
2008
2009
2010
2011
2012
EU
1.3
1.5
2.6
2.2
3.4
3.2
0.4
-4.5
2.0
1.6
-0.4
Germany
0.0
-0.4
1.2
0.7
3.7
3.3
1.1
-5.1
4.0
3.3
0.7
Spain
2.7
3.1
3.3
3.6
4.1
3.5
0.9
-3.8
-0.2
0.1
-1.6
France
0.9
0.9
2.5
1.8
2.5
2.3
-0.1
-3.1
1.7
2.0
0.0
Italy
0.5
0.0
1.7
0.9
2.2
1.7
-1.2
-5.5
1.7
0.5
-2.5
Portugal
0.8
-0.9
1.6
0.8
1.4
2.4
0.0
-2.9
1.9
-1.3
-3.2


The EU unemployment rate stood at 10.2% at the beginning of 2012 and stands at 12.1% today. That the European Union is anything but a homogenous body that moves in unison can be seen in the following chart:


Where Germany has a current unemployment rate of 5.2% and a youth (under 25) unemployment rate of 7.5%, the numbers for other countries are worrisome: Current unemployment in Spain is 26.7%, and 12.7% in Italy, with youth unemployment in Spain at an incredible 57.7%, and 41.6% in Italy. And don’t forget Greece, which is mired in a historically unparalleled economic depression where unemployment is 28% and youth unemployment is a shocking 61.4%. Keep in mind that all of these numbers are those officially released by bureaucratic agencies. The real numbers, as we know, would likely be even worse.

Recent EU industrial production numbers have shown some slight improvement. Nevertheless, industrial production has only managed to recover to its 2004 level, and remains way below its 2007 heights (see next graph).

Source: Eurostat

So let’s see: a shrinking GDP, high and rising unemployment, and stagnant production significantly below 2007 levels. Those are not the rosy ingredients of a booming economy (as indicated by the stock exchanges) but of one that is struggling.

Europe is not in growth mode.

This verdict is further supported by the export numbers for trade between EU countries, known as internal trade. In 2001, internal trade accounted for 67.9% of EU exports. Today, this share is down to 62.7%. In an attempt to compensate for sluggish European growth, EU companies had to develop other export markets, such as the US or the emerging markets.

Will these markets help rescue European companies?

Time to Taper Expectations

With regards to the U.S., two important developments are worth mentioning. The first key development, which will have severe consequences for the global economy, was brought to my attention by my friend Felix Zulauf, an internationally well-known investor and regular member of the Barron’s Roundtable for more than 20 years. Running ever-increasing deficits in its trade and current accounts for almost 30 years, the US thus provided an enormous amount of stimulus for foreign exporters. Since 2006, however, the US trade deficit has shrunk, with deteriorating trade data for many nations as a consequence.


The second key development is that the newly appointed head of the US Federal Reserve system, Janet Yellen, seems determined to continue the taper of its bond buying program. This fundamental shift in monetary policy could be questioned if the economic numbers for the US begin to show significant weakness. But in the meantime, the reduction of economic stimulus in the US should lead to a reduced appetite for European export goods.

The emerging markets had been seen, not too long ago, as the investment opportunity and alternative to the fiscal and debt crisis-stricken countries of the developed world. Today, on a nearly daily basis, you hear bad news about the situation and developments in the emerging countries: swaying stock markets, plunging currencies, company bankruptcies, corruption scandals, and even riots.

The emerging markets are dealing with the unintended consequences of the Quantitative Easing (including liquidity easing and credit easing) programs in the West. The increased liquidity spilled over into the emerging markets in the hunt for yield. This flow of capital into the emerging markets lowered capital costs, inflated asset prices like stocks and real estate, and boosted commodity prices. All that, and more, sparked the emerging markets boom.

Now, this process has reversed. The natural conclusion to exaggerated credit-driven growth, the tapering of QE programs, the shrinking US trade deficit, and lower commodity prices has been an outflow of capital from emerging markets, triggering lower asset prices and exchange rates. The attempt of some countries to defend their currencies by raising interest rates will only exert further pressure on their economies.

With weaker emerging market economies and currencies, there will be no big added demand for European exports. Revenues and profits for EU companies (measured in euros) will fall.

When Trends Collide

So, over the last two years we had opposing trends—booming European stock markets and weak underlying real economies. This conflicting mix was mainly fostered by easy money that drove down interest rates to historic low levels. Plowing money into stocks, despite the poor fundamentals, was the only solution for most investors.

At their current elevated levels European stock markets appear vulnerable, and it seems reasonable to doubt that we will see a continuation of booming stock markets. Of course, such a decoupling can continue for some time, but the longer it continues, the closer we will get to a correction of this anomaly. Either the real economy catches up to meet runaway stock prices, or stock prices come down to meet the poor economic reality. Or some combination of the two.

Because of the economic facts that I discussed above, in my view, we may be seeing just the beginning of a stronger correction in stock prices.

Dirk Steinhoff is chief investment officer of portfolio management (international clients) at the BFI Capital Group. Prior to joining BFI in 2007, Mr Steinhoff acted as an independent asset manager for over 15 years. He successfully founded and built two companies in the realm of infrastructure and real estate management. Mr Steinhoff holds a bachelor’s and master’s degree in civil engineering and business administration, magna cum laude, from the University of Technology in Berlin, Germany. 


Want to read more World Money Analyst articles like this? Subscribe to World Money Analyst today and learn how to look abroad for truly diverse opportunities that insulate you from domestic risk.
The article World Money Analyst: Europe: Cliff Ahead? was originally published at Mauldin Economics


Sign up for one of our Free Trading Webinars....Just Click Here!


Thursday, April 11, 2013

Free Futures Trend Jumper Strategy, the Dow eMini (YM)

Many of you are just beginning to get your FREE Trend Jumper up and running. Hopefully you were able to catch today’s winner that occurred right out the gate this morning. It ended with + 32 points using the three position approach.

Single Position Traders; + 13 points
Two Position Traders; + 31 points
Three Position Traders; + 32 Points

See Today’s FREE Trend Jumper Dow eMini Futures Trade 


Our other FREE Trend Jumper ‘module,’ the EURUSD Swingtrade, has a trade setting up as well. A setup seems imminent but we don’t know if it will trigger in or cancel. We’ll just need to watch it and remain patient and disciplined. 


Full Version Trend Jumper Owners have been treated to a multi session winning streak on many of our favorite markets.

Today was FED Minutes and Crude Oil Inventory Day so it is always good to lower your expectations a bit, trade less and get to your profit goals as quickly as possible. Like we teach in our Live Traderoom, if we can get to our signature ‘power of quitting’ goals early, we’re going to take advantage of the opportunity. And, staying on point with our ‘scalping’ theme (did you see the video in the earlier post?), many trades were quick to finish today.

Crude Oil Futures ended with two trades today for + .32, $320. Heating Oil Futures hit its target on the nail, + 37 ticks, $155 (One and done in 5 minutes.) Unleaded Gas Futures; + 124 ticks, $520 (One and done, 40 minutes)

There were lots of other strong finishes today in the futures world of daytrading, too. But how about our forex trades. There is a lot of action on that front as well. Here’s a look at a few highlights:

NZDUSD is up Hundreds of pips in just a few days — see screenshot

Yen Crosses are heading higher

Aussie crosses are in a variety of profitable trades hitting early targets

GBPUSD is still going strong

NZDCAD just hit a big profit target, + 185 pips to the 1st target and on the way higher

We trade daily charts and only spend a few minutes per day placing and managing these trades. There is NO better way to trade Forex, in my humble opinion. Moreover, there is no better way to stay out of the way of your trading and to just let the tradeplan do its thing. That IS one of the big secrets to success in this business. Once a day, then stay outta the way!!

One of our Current Forex Trades, NZDUSD 


It's not to late to get caught up....Sign up for Trend Jumper today!


Thursday, December 1, 2011

The Currency War Big Picture Analysis for Gold, Silver & Stocks

I think you will admit that we are in the middle of one major crazy financial mess. The part that makes things really crazy is that it’s not just in the United States anymore but rather serious global problem which if not handled properly could change the way we live our lives going forward or possibly even spark some type of war, hopefully things don’t get that crazy...... But I do know one thing. Fear is the most powerful force on the planet and people do some crazy things when they are backed into a corner.

Anyways, on a more positive tone…... today China decided to help provide more liquidity for the financial system along with the central banks. This news triggered a monster rally in overnight trading making the market gap up sharply at the opening bell. This news did hit the US dollar index hard sending it sharply lower but the question remains “Will today’s news be a one week hiccup in the market?” If Euroland starts printing money it will likely send the dollar higher and stocks lower for 6 -12 months.

Just today I was joking with Kerry Lutz of the Financial Survivor Network about how each country should just give each other country a second chance. Wipe the dept clean and start over knowing this time around exactly how each country truly operates at a financial level allowing everyone to avoid a repeat of this BS. Some countries will get off way better than others because they would get so much dept wiped clean. But isn’t it better than years of problems and possibly wars over food, gold, guns, oil and Canadian water? 

All joking aside, let’s take a look at the weekly long term charts.....…

Dollar Index Showing Possible Massive Rally If Euro Starts Printing Money:

I’m sure my off the cuff options/thoughts will cause a stir but I am fine with that. Everyone I talk to is thinking the dollar is about to fall off a cliff while I think it’s very possible that it does just the opposite. Either way I will be looking to benefit from which ever move unfolds.

Weekly Gold Chart:


Weekly Silver Chart:


Weekly SP500 Chart:


Long Term Thoughts:

I would first like to say that tonight’s report is out of my norm. Generally I do not focus on the big picture negative stuff and I like to avoid it for a few reasons...... One, it’s just downright depressing to talk and think about. And Second I don’t want to be labelled as one of those “The Sky Is Falling” kinds of guys.
So, that being said I think these charts above show a situation what is very possible to happen in the coming 6-12 months. Keep in mind that my focus is on short term time frames as it allows me to avoid and actually profit from major market moves while providing enough information for my followers to learn technical analysis and trade management. And the obvious idea of not looking too far into the future with a negative outlook.......

With headline risk changing the market direction on a weekly basis, this negative outlook could easily change in a couple months. I will recap on the big picture as things unfold in January/February.

Chris Vermeulen
The Gold and Oil Guy.com

Don't miss some of Chris' most recent articles......

Is This December Similar to 2007 & 2008 for Gold & Stocks?


How to Trade Oil ETFs When $100 Per Barrel is Reached

Sunday, October 23, 2011

The Euro Zone Wags The Gold and Silver Dog


If Greece defaults and the European situation begins to spin out of control where will money flow? It would not make sense for market participants to buy Euro’s during a default regardless of whether the default it structured or not. In fact, it is more likely that European central banks and businesses would be looking to either hedge their Euro exposure or convert their cash positions to another currency all together.

Some market pundits would argue that gold and silver would likely benefit and I would not necessarily argue with that logic. However, the physical gold and silver markets are not that large and depending on the breadth of the situation, vast sums of money would be looking for a home. The two most logical places for hot money to target in search of safety would be the U.S. Dollar and U.S. Treasury’s.

The U.S. Dollar and U.S. Treasury obligations are both large, liquid markets that could facilitate the kind of demand that would be fostered by an economic event taking place in the Eurozone. My contention is that the U.S. Dollar would rally sharply along with U.S. Treasury’s and risk assets would likely selloff as the flight to safety would be in full swing.

To illustrate the point that the U.S. Dollar will likely rally on a European crisis, the chart below illustrates the price performance of the Euro compared to the U.S. Dollar Index. The chart speaks for itself:

Euro Dollar Options

Clearly the chart above supports my thesis that if the Euro begins to falter, the U.S. Dollar Index will rally sharply. In the long run I am not bullish on the U.S. Dollar, however in the case of a major event coming out of the Eurozone the Dollar will be one of the prettiest assets, among the ugly fiat currencies.

The first leg of the rally in the U.S. Dollar occurred back in late August. I alerted members and we took a call ratio spread on UUP that produced an 81% return based on risk. I am starting to see a similar type of situation setting up that could be an early indication that the U.S. Dollar is setting up to rally sharply higher in the weeks ahead. The daily chart of the U.S. Dollar Index is shown below:

US Dollar Index Options

As can be seen from the chart above, the U.S. Dollar Index has tested the key support level where the rally that began in late August transpired. When an underlying asset has a huge breakout it is quite common to see price come back and test the key breakout level in following weeks or months. We are seeing that situation play out during intraday trade on Friday.

We are coming into one of the most important weeks of the year. Several cycle analysts are mentioning the importance of the October 26th – 28th time frame as a possible turning point. I am not a cycle expert, but what I do know is that we should know more about Europe’s situation during that time frame. It would not shock me to see the U.S. Dollar come under pressure and risk assets rally into the October 26th – 28th time frame. However, as long as the U.S. Dollar Index can hold above the key breakout area the bulls will not be in complete control.

If I am right about the U.S. Dollar rallying higher, the impact the rally would have on gold and silver could be extreme. While I think gold would show relative strength during that type of economic scenario, I think both metals would be under pressure if the U.S. Dollar started to surge. In fact, if the Dollar really took off to the upside I think both gold and silver could potentially selloff sharply.

As I am keenly aware, anytime I write something negative about gold and silver my inbox fills up with hate mail. However, if my expectations play out there will be some short term pain in the metals, but the selloff may offer the last buying opportunity before gold goes into its final parabolic stage of this bull market. The weekly chart of gold below illustrates the key support levels that may get tested should the Dollar rally.

Gold Options Trading

For quite some time silver has been showing relative weakness to gold. It is important to consider that should the U.S. Dollar rally, silver will likely underperform gold considerably. The weekly chart of silver is illustrated below with key support areas that may get tested should the Dollar rally:

Silver Options Trading

Clearly there is a significant amount of uncertainty surrounding the future of the Eurozone and the Euro currency. While I do not know for sure when the situation in Europe will come to a head, I think the U.S. Dollar will be a great proxy for traders and investors to monitor regarding the ongoing European debacle.

If the Dollar breaks down below the key support level discussed above, gold and silver will likely start the next leg of the precious metals bull market. However, as long as the U.S. Dollar can hold that key level it is quite possible for gold and silver to probe below recent lows.

Both gold and silver have been rallying for quite some time, but the recent pullback is the most severe drawdown so far. It should not be that difficult to surmise that gold and silver may have more downside ahead of them as a function of working off the long term overbought conditions which occurred during the recent precious metals bull market.

Make no mistake, if the Dollar does rally in coming months risk assets will be under significant selling pressure. While the price action will be painful, those prepared and flush with cash will have an amazing buying opportunity in gold, silver, and the mining complex. Right now, risk remains excruciatingly high as the European bureaucrats wag the market’s dog.

Subscribers of OTS have pocketed more than 150% return in the past two months. If you’d like to stay ahead of the market using My Low Risk Option Strategies and Trades check out OTS at Options Trading Signals.com and take advantage of our free occasional trade ideas or a 66% coupon to sign up for daily market analysis, videos and Option Trades each week.

JW Jones

Here's J.W.s Latest Articles

Monday, August 22, 2011

Chris Vermeulen: Crude Oil and Gold Thoughts....What is Next?


The past few weeks have been fast moving with fearful investors clearly in control. As we all know fear is the most powerful force in the financial market and when the hedge funds and the masses get spooked they all dart in one direction like a school of fish. Watching the charts and volume levels it’s clear that money was/is flowing out of stocks and into precious metals as the risk off safe play. 

To make a long story short, I feel as though Euro-Land is going through something similar to what we (the USA) went through in late 2008 and first quarter of 2009. Keeping my analysis simple and to the point it’s very likely that Euro-Land will resolve their financial issues and their stock markets will bottom in the next month or so… If their market bottoms, so will the US market, which will be perfect timing as the market is currently oversold, sentiment is now turning bearish and we have had a sizable pullback in line with normal bull market corrections.

My thinking looking forward 2-6 weeks is that stocks rally, financials rocket higher, bond prices fall, gold falls and oil rises as it will be a risk off trading environment again. Of course all this would happen after Euro-Land resolves some of their key financial issues. I’m being very optimistic here but we could be nearing a major low that could kick start another massive 1 year rally.

Stepping away from that longer term outlook let’s take a peek at the shorter term trends for oil, gold and stocks.

Crude Oil 60 Minute Chart (1 month view)
The recent price action for crude oil remains bearish/neutral in my opinion. We saw a drift higher into resistance with declining volume then a sharp pullback on heavy volume. This tells me oil remains in a down trend. It may be forming a base which would act as a launch pad in the coming weeks for higher prices but only time will tell and I will update as price unfolds.


Gold 4 Hour Chart (One Month View)
Gold has been performing very well for our entry point but the recent price action is starting to look toppy. Gold and many commodities regularly form this pattern of three wave pushes to new highs just before a sizable correction takes place. I am bullish on gold long term and for a few more weeks, but I do feel as though there will be a multi month correction in the price of gold (Read More) soon so be sure to tighten your protective stops as price moves higher.


SPY ETF Weekly Chart (Two Year View)
The stock market has been hit hard and a lot of damage has also been done to the charts on a technical stand point. The amount of damage and fear that has happening generally takes some time to stabilize and heal before another move takes place. Until Euro-Land resolves some of their major issues the US market will be held hostage and under pressure. So I anticipate several weeks of volatility and wild daily price swings similar to what we saw in July of 2010. This type of trading environment can work very well for options traders (Read More).


Weekly Trading Conclusion:
In short, the market price action is favoring very short term traders (day traders). We are seeing complete price swings which can normally be swing traded happen in just hours… Until we get another extreme setup or stabilization (less big headline news) in the market we will be more of a spectator than a trader to preserve capital.

Consider subscribing to Chris Vermeulens calls so that you will be consistently informed, have 24/7 Email access to me with questions, and also get Gold, Silver, SP500 and Oil Trend Analysis on a regular basis. Subscribe now at The Gold and Oil Guy.Com

Friday, June 17, 2011

The European Debt Crisis and the Fear That Grips Us

J.W. Jones is waiting patiently for signs that price action is going to reverse before getting involved, then what?.......

The price action in U.S. financial markets on Wednesday was the culmination of fear and disease. Fear was represented by a breakout in the Volatility Index (VIX) and the disease was related to the sovereign debt crisis unfolding in the Eurozone. The violent reaction by the Greek citizenry to proposed austerity measures paired with grumblings coming from multiple Eurozone nations ignited fear among traders and investors alike.

I am not an expert on debt instruments, but it seems that there is a considerable amount of systemic risk within the debt structure of the Eurozone. When the notional derivatives such as credit default swaps are factored into the equation the risk to the global financial system intensifies significantly. The real question is who is holding the counterparty risk on the other side of the Greek debt? Even if the Greek situation is resolved without default, what is going to happen to Spain and Portugal’s debt?

The solvency of many of the Eurozone nations has come under question and the price action in the Euro currency is indicative of the fear present among market participants. I believe that the economic disaster that is unfolding in Europe currently will eventually manifest itself stateside. Austerity measures either through higher taxes, monetization of our public debt, and a complete restructuring of entitlement programs is likely to occur. However, in the meantime domestic markets will struggle to gain their footings in the face of a strong U.S. Dollar. The strength of the U.S. Dollar Index represented by the ETF UUP on Wednesday helped place selling pressure on U.S. equities and commodities alike. The daily chart of UUP is shown below:


If the U.S. Dollar continues to rise, the impact the increase in value of the Dollar will have on U.S. financial markets could be debilitating for equities. Poor economic data, continued housing problems, and the political uncertainty surrounding the debt ceiling all make for a potentially dangerous situation for U.S. capital markets. With this much fear and uncertainty in the marketplace and volatility stemming from a variety of issues related to the Eurozone, investors are fearful. The spreading disease of the sovereign debt contagion is rapidly infecting global financial markets and if handled inappropriately could drastically alter the entire capital market construct.

Instead of worrying about all of the fear and uncertainty in the market place, I look at market internals, market cycles, fundamentals, and technical analysis as guides for shaping my approach to trading. We are on the verge of a major inflection point for financial markets, specifically equities. While it might surprise readers to know, I am leaning towards a near term bottom in the S&P 500. The S&P 500 could rally to the 1,305 (SPX) price level (20 Period Simple Moving Average) which represents an increase of 3%. It is also feasible that we may witness a test of the 50 period moving average on the daily chart of the S&P 500 (SPX)which would represent an increase from Wednesday’s close of over 5%. Markets do not move in a straight line. While investors and traders may expect a breakdown in price action, rarely is the crowd correct.

The daily chart of the S&P 500 with its annotations shown below illustrates my thought process as it relates to near term price action for the index:


If price action breaks below the March pivot lows a panic induced selloff could begin and the next leg of the secular bear market will likely be underway. We may have already initiated the secular bear with the recent downturn, but I will remain neutral until the March pivot lows are broken. If price action breaks through the March lows and we see multiple days with daily closes below the 1,250 (SPX) price level I will become very bearish. The chart below illustrates the key price levels if the SPX breaks down:


While many readers may find this interesting, today members of my service at OptionsTradingSignals.com were able to lock in gains on an SPY position we initiated late last week. I initiated a SPY 125 Put Calendar spread which I converted to a double calendar spread on Tuesday. The position will produce profits if price action on the SPY remains between around $123.50 / share and $130.21 / share at the close this Friday (June Expiration).

During the nasty selloff today, the implied volatility of the SPY Double Calendar Spread was juiced and we were able to take profits on the position and lock in a 13% gross return based on maximum risk. We have the remainder of the position on currently with stop levels in place. If price cooperates, the trade offers a potential return of around 20% near the close this Friday.

Calendar spreads work great in an environment where volatility levels are rising and they profit from time decay (Theta) which is a mathematical certainty. Recently the service has been producing solid gains for members using calendar spreads during this choppy price action. While I like to use other trade constructions, calendar spreads have produced outstanding risk / reward opportunities for astute option traders and I will not hesitate to use any tool that is working in a particular market climate.

A Brief Trading Lesson
Members of my service know that I regularly watch a variety of underlying indices and sectors to get a feel for the broad market. Besides the VIX, one of the most critical ETF’s for traders to monitor is the financials. If you are new to trading or are trying to learn, it is critically important to understand that the S&P 500 has an arduous time rallying if banks are selling off.

In contrast, when the financials are holding up well or are working higher and the broader tape is trading flat or slightly in the red it offers a clue that the broader market may be preparing to move higher later that session or the following day. Yesterday (Tuesday) the financials were warning traders and investors into the close that today could be troublesome. The daily chart at the close on Tuesday shows the financial ETF XLF’s recent price action:


The ugly close for financials was a warning and investors and traders who did not pay attention to the financials had a rough day today. The only long position that I was holding today was a long GLD position. Gold held up nicely today and we have some nice gains for the trade, but the key point to make is that by noticing the price action in the financials late Tuesday afternoon prevented me from initiating a poorly timed long trade.

Conclusion
Given the amount of uncertainty and risk associated with current price action in the S&P 500, I would urge readers to monitor risk closely and review open positions. While I do not necessarily believe a horrific selloff or a Black Swan event is waiting in the shadows for unsuspecting traders and investors, it is impossible to rule out a breakdown of the key pivot lows from March of this year. I am leaning toward the mindset that a short to intermediate term bottom may be forming, but I will not be doing any of the heavy lifting.

I will wait patiently for signs that price action is going to reverse before getting involved. Trying to pick tops and bottoms is a fool’s game, particularly when the game is changing rapidly based on news coming from Europe which can dramatically alter the tape. Risk is extremely high at inflection points such as the one we are currently near. Some of the best traders I know are successful because they refrain from trading when price action is volatile and risk is abnormally high. Sometimes sitting on the sidelines and listening to Mr. Market talk can be the best trade of all!

If you would like to be informed on SP 500, Volatility Index, Gold, and Silver intermediate direction and option trade alerts several times per week… take a look at  Options Trading Signals.Com today for a 24 hour 66% off coupon, and/or sign up for J.W.'s occasional free updates.

Sunday, June 12, 2011

What the U.S. Dollar and the Euro Mean to the S&P 500

The buzz around the blogosphere and in the media is that Quantitative Easing II is scheduled to end in around 3 weeks. Already pundits are asking about Quantitative Easing III as a matter of when, not if. In reality a QE III Lite version is already in the cards as the Federal Reserve has stated they will be buying Treasuries and Mortgage Backed Securities (MBS) with maturing issues. The Fed also plans on reinvesting the interest earned from the existing portfolio (Roughly $15 billion/monthly).

When it comes to the application of financial principles, doing the opposite of what everyone else does generally leads to an extreme variation in the overall results. While the results are not always better, they are at the very least significantly different from what most lemmings within the group experience. In every aspect of my financial life I try to do the opposite of what the herd is doing. It takes experience and a significant level of discipline, but buying from the herd when they are selling and being willing to sell into a crowd when they are buying is a great way to trade. It sounds easy, but for most people it is not, myself included.

Right now financial markets are uncertain. I would be remiss if I did not point out the recent strength in the U.S. Dollar Index and the potential higher low that it has carved out on the daily and weekly charts. The weekly chart of the U.S. Dollar Index is shown below:


The current pattern on the U.S. Dollar Weekly chart is bullish. We could see the U.S. Dollar Index trade significantly higher from here as it has been under severe selling pressure for an extended period of time. While I believe technical analysis is just one context through which to view financial markets, it is uncanny how often market cycles and headline events line up. Is it merely a coincidence that the U.S. Dollar is potentially bottoming around the same time the Federal Reserve is ending the QE II asset purchase program?

Regardless of what camp economists are in, we presently live in a strange time for financial markets and capitalism in general. One of the more interesting charts to study is the Euro currency, which in contrast to the U.S. Dollar Index appears to have a more bearish pattern. Could it be that the U.S. Dollar is setting up to rally because of the perceived weakness of the Eurozone? The daily chart of the Euro ETF is shown below:


The Dollar may be firming up here based on the Euro’s weakness and it may have absolutely nothing to do with QE II ending. I always refer to price action and never question Mr. Market’s directional bias. If the U.S. Dollar begins to work higher what impact will it have on equities?

A stronger U.S. Dollar would certainly put pressure on risk assets, specifically equity and commodity prices. As it turns out, we are at an interesting juncture in financial markets at this point in time.
The 4 year stock market cycle is nearing an end, a presidential election will take place in less than 18 months, the U.S. government has a massive debt crisis developing, and the European debt crisis continues to mature in what will likely be a microcosm of what we will face here in the United States. The Middle East remains tense at the very least and the recent OPEC announcement to maintain supply levels has helped support oil prices.

Higher oil prices have obviously slowed down the U.S. economy as the consumer is strapped with higher costs on nearly everything, specifically food and energy. In addition, the unemployment numbers are seemingly not improving and housing appears to be rolling over . . . again.

Almost everywhere we look the news is bleak. Mr. Market has shrugged off bad news time and time again since the March 2009 lows. The long term shorts remain frustrated to say the least and those who were actively shorting along the way have likely been stopped out multiple times. Everywhere I look market commentary is bearish and pundits are talking about additional weakness as they point to a rallying Dollar and multiple economic headwinds facing domestic markets.

Traders and investors should be focused on a few specific price levels on the S&P 500. With the Dollar rallying, the S&P 500 index has remained under extreme selling pressure for multiple weeks. The S&P 500 (SPX) is likely going to test its 200 period moving average. From there I am expecting a bounce higher, although the bounce may be nothing more than a Dead Cat Bounce.

As always, time and price will be the final arbiter but if the Dollar continues to trade higher we could see the S&P 500 lose its 200 period moving average and eventually test a major support level which needs to hold up for the bulls. If the March 16, 2011 pivot lows are taken out to the downside, the next leg of the secular bear market may be under way. The daily chart of the SPX illustrated below shows the key price levels and the potential price action that may lead up to a key test of the March 2011 pivot lows:


Very rarely does the first mouse get the cheese, so I would anticipate a bounce off of the 200 period moving average which currently coincides with the March pivot lows. With not only the pivot lows but the 200 period moving average offering support a breakdown lower will be a large tell about the health and future price action of the S&P 500.

Right now I am just going to focus on how the S&P 500 handles the key support zone illustrated above. The forthcoming price action will tell traders everything we need to know about the health of financial markets. I have no idea if we are about to enter a double dip recession nor do I know whether price action will even test the March pivot lows.

What I do know is that price action in coming days around key support areas is going to be critical. I am convinced that Mr. Market will tell us whether the bullish party will continue or come to an end in the next few weeks/months. A breakdown of the March pivot lows in the future will likely initiate the launch sequence for the next secular bear market. I would keep the S&P 500 1,250 price level on the radar going forward. Risk remains high.

If you would like to receive J.W. Jones emails several times per week on SP 500, Volatility Index, Gold, and Silver intermediate direction and option trade alerts… take a look at Options Trading Signals.com today for a 24 hour 66% off coupon, and/or sign up for his occasional free updates.


Share